ERS Charts of Note
Subscribe to get highlights from our current and past research, Monday through Friday, or see our privacy policy.
Get the latest charts via email, or on our mobile app for  and
and 
Wednesday, September 25, 2019
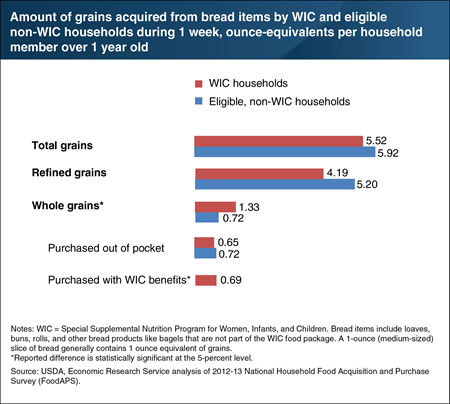
In 2009, USDA’s Special Supplemental Nutrition Program for Women, Infants, and Children (WIC) added whole-grain bread and other whole-grain options, such as brown rice and whole-grain tortillas, to its supplemental food packages for pregnant women, breastfeeding women, and children ages 1 through 4 years old. Most Americans underconsume whole grains relative to Federal dietary recommendations. ERS researchers used USDA’s National Household Food Acquisition and Purchase Survey (FoodAPS) to compare the amounts of whole and refined grains acquired from bread by WIC and eligible non-WIC households. During the FoodAPS survey week, WIC households acquired about the same amount of total grains from bread as eligible non-participants. However, they bought more whole grain bread. WIC households acquired 1.33 ounce-equivalents of whole grains from bread per member, on average, versus 0.72 ounce-equivalents for eligible non-WIC households. This difference can be attributed to purchases of whole grain bread made with WIC benefits. This chart appears in the ERS report, USDA Special Supplemental Nutrition Program for Women, Infants, and Children (WIC): A New Look at Key Questions 10 Years After USDA Added Whole-Grain Bread to WIC Food Packages in 2009, August 2019.
Friday, September 13, 2019
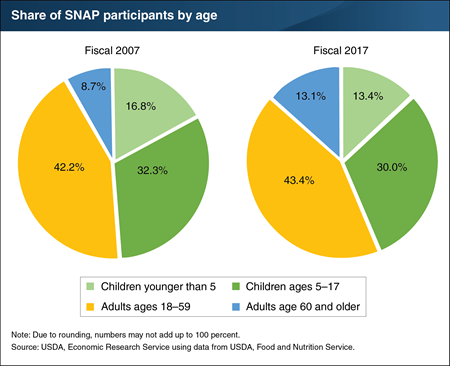
In an average month in fiscal 2018, USDA’s Supplemental Nutrition Assistance Program (SNAP) provided 40.3 million low-income Americans with benefits to purchase food at authorized food stores. In fiscal 2017 (the latest year for which demographic data are available), adults aged 18–59 accounted for 43.4 percent of participants, children younger than age 5 accounted for 13.4 percent of participants, school-age children accounted for 30.0 percent of participants, and adults aged 60 and older accounted for 13.1 percent of participants. The composition of SNAP participants can be affected by changing economic conditions, modifications to program requirements, and demographic trends. Over the last decade, children’s share of the SNAP caseload has fallen from 49.1 percent in fiscal 2007 to 43.4 percent in fiscal 2017. The share of SNAP participants who are age 60 or older has risen from 8.7 to 13.1 percent over this period. The second chart appears in the Food Security and Nutrition Assistance section of the ERS data product, Ag and Food Statistics: Charting the Essentials.
Tuesday, September 10, 2019
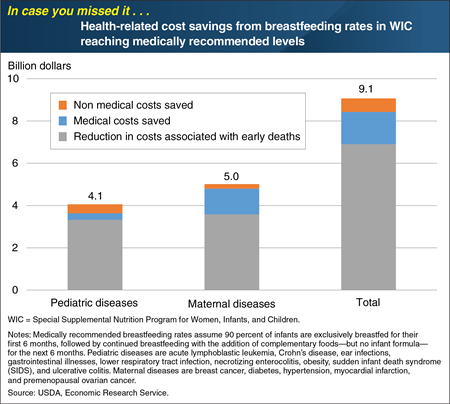
USDA’s Special Supplemental Nutrition Program for Women, Infants, and Children (WIC) encourages and supports breastfeeding among postpartum women participating in the program. Studies have found that breastfeeding confers a number of health benefits to both infant and mother. The American Academy of Pediatrics recommends exclusive breastfeeding for about 6 months, followed by continued breastfeeding until at least 12 months of age as complementary foods are introduced. A recent ERS study estimated the potential cost savings to WIC households and/or their private and government health insurance providers if 90 percent of WIC infants in 2016 had been breastfed for 12 months (first 6 months exclusively). Cost savings were calculated based on estimated reductions in nine pediatric and five maternal diseases. ERS researchers found the estimated cost savings would total $9.1 billion. Three-quarters of the savings, $6.9 billion, is derived from reductions in early deaths of mothers and infants. Medical costs, including physician fees and hospital costs, account for $1.5 billion of the savings, and nonmedical costs, such as lost wages from missed work days due to maternal illness or caring for a sick infant, account for another $0.6 billion. The data for this chart appear in “Economic Implications of Increased Breastfeeding Rates in WIC” from ERS’s Amber Waves magazine, February 2019. This Chart of Note was originally published March 15, 2019.
Wednesday, August 28, 2019
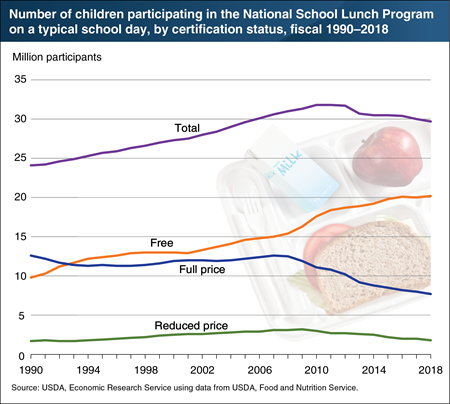
On a typical school day in fiscal year 2018, 29.7 million children participated in USDA’s National School Lunch Program (NSLP), and USDA expenditures on the program totaled $13.8 billion for the year. These expenditures include cash reimbursements for meals served and the value of foods provided to schools by USDA. In return for the reimbursements and donated foods, schools must serve lunches that meet Federal nutrition requirements and offer these lunches to children from low-income families for free or at a reduced-price. Almost three-quarters (74 percent) of lunches were provided for free or at a reduced-price in 2018. Since 2001, free lunch participation has increased every year, from 12.9 million children in 2001 to 20.2 million in 2018. Over the same period, full-price lunch participation peaked at 12.6 million children in 2007, and reduced-price meal participation peaked at 3.2 million in 2009. Through 2011, overall NSLP participation increased, reaching a high of 31.8 million children, driven by growth in free-meal participation. Since then, declining participation of children receiving reduced- and full-price lunches has led to a drop in overall participation. A longer version of this chart (starting in 1970) appears in the Child Nutrition Programs: Charts topic page on the ERS website.
Wednesday, August 21, 2019
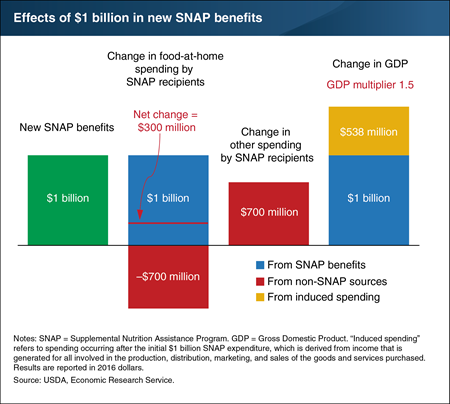
Low-income participants in USDA’s Supplemental Nutrition Assistance Program (SNAP) generally spend their benefits soon after receiving them. This spending by SNAP households “multiplies” throughout the U.S. economy as the businesses supplying the food and other goods purchased—and their employees—receive additional funds to make purchases of their own. A recent ERS study examined the multiplier effect of a hypothetical $1 billion increase in SNAP benefits. Most SNAP participants spend their own cash in addition to SNAP benefits to purchase adequate food. Thus, SNAP households would spend the full amount of the increased benefits, but would redirect some of the cash that they were spending on food at grocery stores to other goods or services. The study predicted that the $1 billion in additional SNAP benefits would raise SNAP households’ food spending by $300 million and their non-food spending by $700 million. This increased spending, combined with the subsequent multiplier-induced spending of both non-SNAP households and SNAP households ($538 million), would raise Gross Domestic Product (GDP) by $1.54 billion. This chart appears in the ERS report, The Supplemental Nutrition Assistance Program (SNAP) and the Economy: New Estimates of the SNAP Multiplier, and the Amber Waves article, “Quantifying the Impact of SNAP Benefits on the U.S. Economy and Jobs,” released July 18, 2019.
Thursday, August 15, 2019
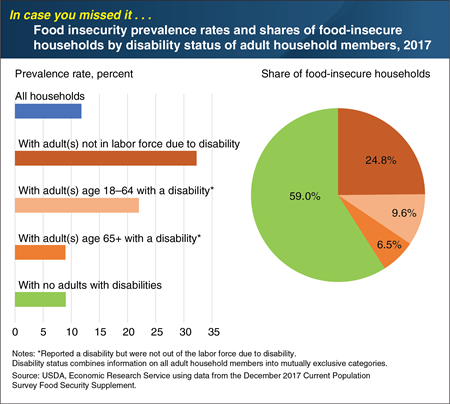
Households with adult members who have a disability are at higher risk of experiencing food insecurity—having to struggle at some time during the year to provide enough food for all their members. U.S. households that included adults with disabilities who were not in the labor force due to disability had the highest food insecurity rate in 2017 at 32.3 percent, followed by households with working-age adults with disabilities not out of the labor force due to disability at 22.0 percent. Households with elderly adults with disabilities do not appear to have as great a risk for food insecurity. In 2017, 9.0 percent of these households were food insecure, a rate similar to that of households with no adults with disabilities. Elderly adults with disabilities may have developed their disabilities after their working years and have savings and/or more stable income sources, such as Social Security or pensions, than working-age adults with disabilities. Among all food-insecure households in 2017, 41 percent included an adult with a disability. A version of this chart appears in the ERS data visualization “Food insecurity and very low food security by education, employment, disability status, and SNAP participation.” This Chart of Note was originally published April 2, 2019.
Monday, August 12, 2019
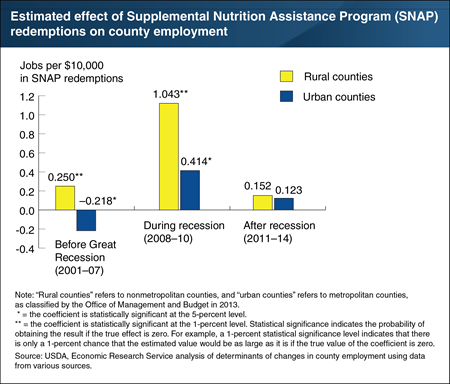
The Supplemental Nutrition Assistance Program (SNAP) provided benefits to an average of more than 46 million recipients per month and accounted for 52 percent of USDA’s spending in 2014. That year, SNAP recipients redeemed more than $69 billion worth of benefits. Recent ERS research estimated the effect of SNAP redemptions on county-level employment. During and immediately after the Great Recession (2008–10), each additional $10,000 in SNAP redemptions contributed on average 1.04 additional jobs in rural counties and 0.41 job in urban counties. By contrast, before the recession (2001–07), SNAP redemptions had a much smaller positive effect on employment in rural counties (about 0.25 job per $10,000 in redemptions) and a negative effect in urban counties (a loss of about 0.22 job per $10,000 in redemptions). After the recession (2011–14), SNAP redemptions had a statistically insignificant effect on employment in both rural and urban counties. Per dollar spent, the effect of SNAP redemptions on local employment during the recession was greater than the employment effect of other government transfer payments combined—including Social Security, Medicare, Medicaid, unemployment insurance compensation, and veterans’ benefits—and also the employment effect of total Federal Government spending. SNAP’s relatively large effect on employment during the recession may owe to the fact that, unlike many other government programs, SNAP payments are provided directly to low-income people, who tend to immediately spend additional income. This chart uses data found in the May 2019 ERS report, The Impacts of Supplemental Nutrition Assistance Program Redemptions on County-Level Employment. Also see the May 2019 article, “SNAP Redemptions Contributed to Employment During the Great Recession” in ERS’s Amber Waves magazine.
Thursday, August 8, 2019
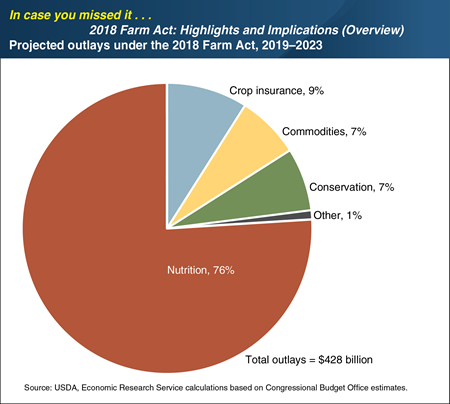
The Agriculture Improvement Act of 2018 (2018 Farm Act) was signed into law December 20, 2018, and will remain in force through the end of fiscal year 2023, although some provisions extend beyond 2023. The Congressional Budget Office (CBO) projected that the new Farm Act would mandate spending of $428 billion dollars over the next 5 fiscal years (2019-2023). A large majority of projected spending—76 percent ($326.02 billion)—would fund nutrition programs, with most going to the Supplemental Nutrition Assistance Program (SNAP). Crop insurance ($38.01 billion), farm commodity programs ($31.44 billion), and conservation programs ($29.27 billion) accounted for nearly all of the remaining outlays. Approximately 0.8 percent ($3.54 billion) would fund all other programs, including trade, credit, rural development, research and extension, forestry, energy, horticulture, and miscellaneous programs. Overall, the 2018 Farm Act made fewer changes to food and farm policy than the 2014 Farm Act. Nutrition policy, particularly SNAP, continued with minor changes. Crop insurance options and agricultural commodity programs continued largely as under the 2014 Farm Act. All major conservation programs continued, although some were modified significantly. This chart appears on the USDA Website page, “The Agriculture Improvement Act of 2018: Highlights and Implications,” dated December 20, 2018. This Chart of Note was originally published January 28, 2019.
Friday, August 2, 2019
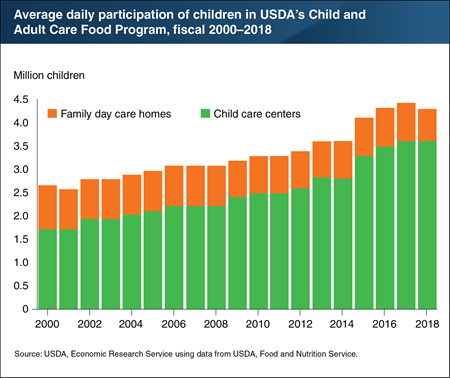
On a typical day in fiscal year 2018, USDA’s Child and Adult Care Food Program (CACFP) provided subsidized meals and snacks to more than 4.3 million children at child care centers and family day care homes. Participation in CACFP through child care centers has grown from 1.7 million children in 2000 to 3.6 million in 2018, while participation through family day care homes has dropped from 1 million children in 2000 to fewer than 800,000 in 2018. The rise in center-based participation more than offset the decline in home-based participation through 2017, resulting in participation in CACFP increasing from 2.7 million children in 2000 to 4.4 million in 2017. The number of children attending centers who participated in the program in 2018 was the same as in 2017, but fewer children in day care homes participated. The program also provided subsidized meals for 131,634 older or functionally impaired adults at adult day care centers in 2018. Meals and snacks served to CACFP participants must meet USDA nutrition standards to receive Federal reimbursements. USDA’s costs for CACFP in fiscal 2018 totaled $3.6 billion. This chart appears on the chart page of ERS’s Child Nutrition Programs topic page.
Thursday, July 18, 2019
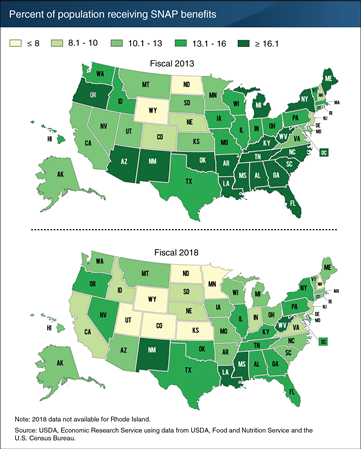
USDA’s Supplemental Nutrition Assistance Program (SNAP) provides benefits for purchasing food in authorized food stores to needy households with limited incomes and assets. In fiscal 2018, an average of 40.3 million low-income individuals per month received SNAP benefits in the United States. The percent of Americans participating in the program declined from 15.0 percent in 2013 to 12.3 percent in 2018, marking the fifth consecutive year of a decline in the percent of the population receiving SNAP. In seven States—Colorado, Kansas, Minnesota, New Hampshire, North Dakota, Utah, and Wyoming—8 percent or fewer of residents received SNAP benefits in 2018. Between 2013 and 2018, 46 States and the District of Columbia saw a decrease in the share of residents receiving SNAP benefits, while 4 States experienced increases. Idaho showed the largest decline in percent of residents participating in SNAP—a 36-percent decline from 14.1 to 9.0 percent of residents. Eighteen States and the District of Columbia had declines in participation shares of at least 25 percent between 2013 and 2018. Nevada had the largest increase in participation share, growing from 12.9 to 14.5 percent of residents. The fiscal 2018 map appears in the Food Security and Nutrition Assistance section of the ERS data product “Ag and Food Statistics: Charting the Essentials,” updated in June 2019.
Thursday, June 20, 2019
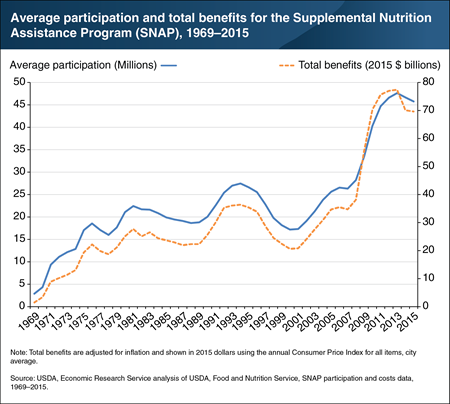
The Supplemental Nutrition Assistance Program (SNAP) is the largest USDA program. During fiscal year 2014, it provided benefits to an average of more than 46 million recipients per month and accounted for 52 percent of USDA’s spending. That year, SNAP recipients redeemed more than $69 billion worth of benefits at SNAP-authorized stores—83 percent of which were located in urban areas and 17 percent in rural areas. Between fiscal years 2000 and 2013, average monthly SNAP participation nearly tripled, while the inflation-adjusted value of benefits paid under the program nearly quadrupled. The growth in program participation and the value of benefits paid were particularly rapid during and immediately after the Great Recession, which officially began in December 2007 and ended in June 2009. However, the recession resulted in high poverty rates well after it officially ended. The increase in program spending between 2009 and 2013 was due in part to rising SNAP participation in response to high levels of poverty during this period. A temporary increase in benefit rates mandated by the American Recovery and Reinvestment Act (ARRA) in early 2009 and other policies to increase access to the program also likely expanded SNAP participation and spending. This chart appears in the May 2019 ERS report Investigating Impacts of SNAP Redemptions on County-Level Employment. Also see the May 2019 article, “SNAP Redemptions Contributed to Employment During the Great Recession” in ERS’s Amber Waves magazine.
Tuesday, June 4, 2019
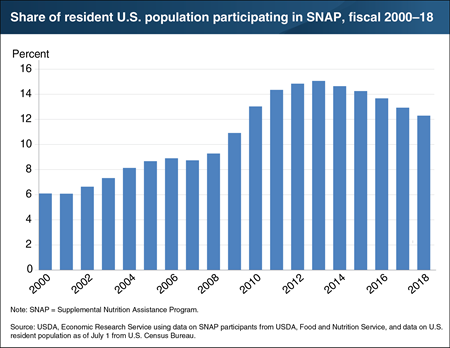
USDA’s Supplemental Nutrition Assistance Program (SNAP) is the Nation’s largest food assistance program. In an average month in fiscal 2018, 40.3 million people—about 12 percent of the Nation’s population—participated in the program, receiving benefits averaging $125.25 per person per month. The share of the Nation’s population participating in SNAP grew from 6 percent in 2000 to approximately 9 percent in 2007, and then increased more sharply to just under 11 percent in 2009 as economic conditions deteriorated during the Great Recession, which officially lasted from December 2007 to June 2009. The share of the population receiving SNAP benefits continued to rise as labor market conditions in low-wage occupations remained weak and poverty rates remained high after the Great Recession’s official end. Policies to increase program access and temporarily increase benefit levels also likely encouraged eligible people to enroll in SNAP. By 2013, 15 percent of the U.S. population participated in the program each month. From 2014 to 2018, the share of the population enrolled in SNAP fell each year as economic conditions improved. This chart appears in the ERS report, The Food Assistance Landscape: FY 2018 Annual Report, April 2019.
Friday, May 24, 2019
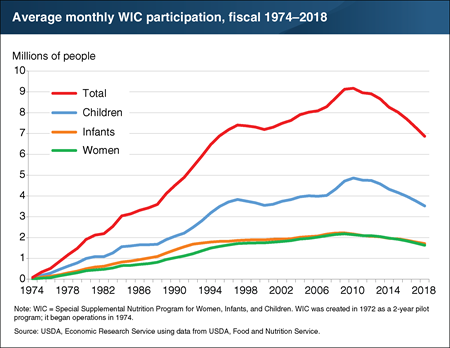
USDA’s Special Supplemental Nutrition Program for Women, Infants, and Children (WIC) provides supplemental food, nutrition education, and health care referrals to low-income pregnant, breastfeeding, and postpartum women, as well as infants and children up to age 5 who are at nutritional risk. An average 6.9 million people per month participated in the program in fiscal 2018, a 6-percent decrease from 2017. This marked the largest single-year decrease in the program’s history. For the 8th consecutive fiscal year, participation for each of the three major WIC-participant groups—women, infants, and children—fell by 4–6 percent. Improving economic conditions in recent years have likely played a role in the participation decline. Because applicants must have incomes at or below 185 percent of poverty or participate in certain other assistance programs to be eligible, the number of people eligible for WIC is closely linked to the health of the U.S. economy. Falling WIC caseloads may also reflect the decline in the number of U.S. births. During 2008–17, the number of births fell by an average of 1.4 percent per year (except in 2014, when the number of births rose by 1.4 percent). This chart appears in the ERS report, The Food Assistance Landscape: FY 2018 Annual Report, April 2019.
Tuesday, May 7, 2019
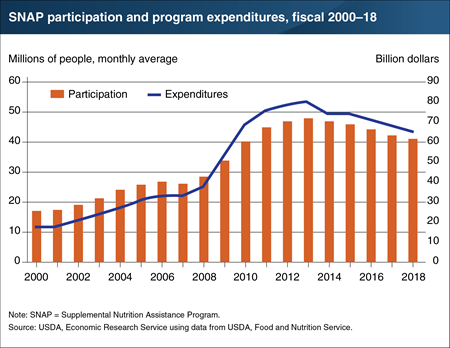
The Supplemental Nutrition Assistance Program (SNAP) is the cornerstone of USDA’s food and nutrition assistance programs, accounting for 68 percent of all Federal food and nutrition assistance spending in fiscal 2018. An average of 40.3 million people per month participated in the program in fiscal 2018, 4 percent fewer than in fiscal 2017. As the fifth consecutive year of declining participation, fiscal 2018’s caseload was 15 percent less than the historical high average of 47.6 million participants per month in fiscal 2013. The decrease in SNAP participation in 2018 was likely associated with the country’s continued economic improvement in recent years. Federal spending for SNAP fell by 5 percent in fiscal 2018 to $65.0 billion—19 percent less than the historical high of $79.9 billion set in fiscal 2013. This chart appears in the ERS report, The Food Assistance Landscape: FY 2018 Annual Report, released on April 18, 2019.
Tuesday, April 2, 2019
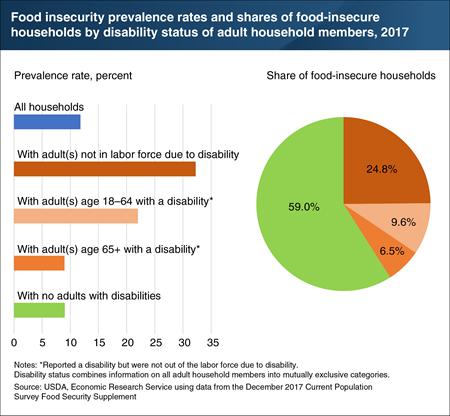
Households with adult members who have a disability are at higher risk of experiencing food insecurity—having to struggle at some time during the year to provide enough food for all their members. U.S. households that included adults with disabilities who were not in the labor force due to disability had the highest food insecurity rate in 2017 at 32.3 percent, followed by households with working-age adults with disabilities not out of the labor force due to disability at 22.0 percent. Households with elderly adults with disabilities do not appear to have as great a risk for food insecurity. In 2017, 9.0 percent of these households were food insecure, a rate similar to that of households with no adults with disabilities. Elderly adults with disabilities may have developed their disabilities after their working years and have savings and/or more stable income sources, such as Social Security or pensions, than working-age adults with disabilities. Among all food-insecure households in 2017, 41 percent included an adult with a disability. A version of this chart appears in the ERS data visualization "Food insecurity and very low food security by education, employment, disability status, and SNAP participation."
Friday, March 15, 2019
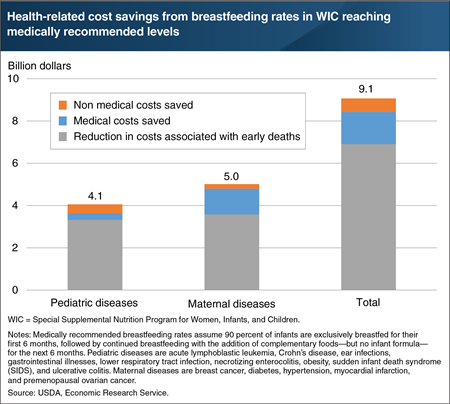
USDA’s Special Supplemental Nutrition Program for Women, Infants, and Children (WIC) encourages and supports breastfeeding among postpartum women participating in the program. Studies have found that breastfeeding confers a number of health benefits to both infant and mother. The American Academy of Pediatrics recommends exclusive breastfeeding for about 6 months, followed by continued breastfeeding until at least 12 months of age as complementary foods are introduced. A recent ERS study estimated the potential cost savings to WIC households and/or their private and government health insurance providers if 90 percent of WIC infants in 2016 had been breastfed for 12 months (first 6 months exclusively). Cost savings were calculated based on estimated reductions in nine pediatric and five maternal diseases. ERS researchers found the estimated cost savings would total $9.1 billion. Three-quarters of the savings, $6.9 billion, is derived from reductions in early deaths of mothers and infants. Medical costs, including physician fees and hospital costs, account for $1.5 billion of the savings, and nonmedical costs, such as lost wages from missed work days due to maternal illness or caring for a sick infant, account for another $0.6 billion. The data for this chart appear in “Economic Implications of Increased Breastfeeding Rates in WIC” from ERS’s Amber Waves magazine, February 2019.
Friday, March 1, 2019
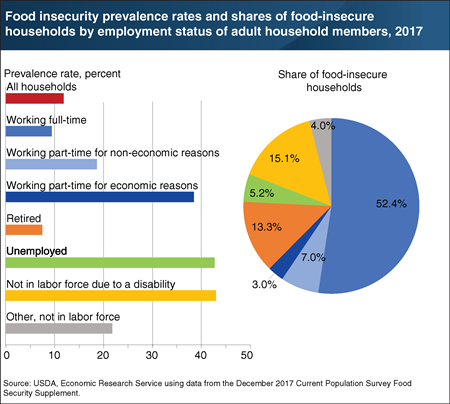
The prevalence of food insecurity—having difficulty providing enough food for all household members at some time during the year—varies across U.S. households by employment status of adult members. While some types of households may be more likely to be food insecure, those households may be less numerous and therefore make up a small share of all food-insecure households. For example, food insecurity rates in 2017 were highest for households with no one employed or retired and someone unemployed looking for work (42.7 percent) or with someone out of the labor force because of a disability (43.0 percent), but those households accounted for 5.2 and 15.1 percent, respectively, of all food-insecure households. In contrast, the food insecurity rate among households with an adult working full time was a relatively low 9.4 percent, but those households made up slightly over half of all food-insecure households, demonstrating that full-time employment does not fully protect households from food insecurity. Wages and benefits—not just number of hours worked—along with non-food obligations for the family’s earnings, can have significant effects on a household’s food-insecurity risk. A version of this chart appears in the ERS data visualization “Food insecurity and very low food security by education, employment, disability status, and SNAP participation.”
Tuesday, February 26, 2019
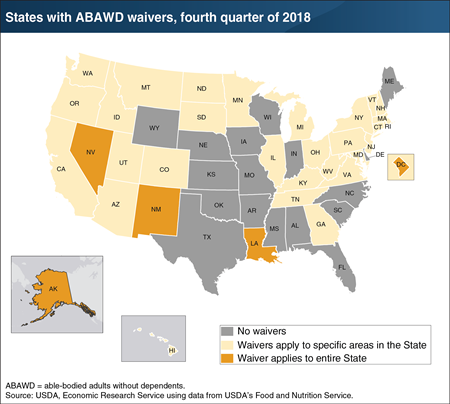
Signed into law December 20, 2018, the Agriculture Improvement Act of 2018 (2018 Farm Act) reauthorized USDA’s Supplemental Nutrition Assistance Program (SNAP), the Nation’s largest food assistance program, through fiscal 2023. Although the program’s eligibility guidelines and work requirements were a major focus of legislative debate, they were not changed in the final legislation. Under current rules, working-age SNAP recipients, with some exceptions, must register for work and accept a suitable job if offered. In addition, able-bodied adults ages 18-49 with no dependents (ABAWDs) who work less than 20 hours a week can receive SNAP benefits for only 3 months out of every 3 years. States can request from USDA a waiver of this time limit in locations where unemployment rates are high or jobs are insufficient, as measured by a limited set of economic indicators. As of December 2018, four States (Alaska, Louisiana, Nevada, and New Mexico)—along with the District of Columbia, Guam, and the Virgin Islands—had received USDA approval to waive the time limit on ABAWDs receiving SNAP benefits. Another 29 States had ABAWD time limit waivers in specific locations, and 17 States were enforcing the limit. USDA proposed new rules, published in the Federal Register on February 1, 2019, to tighten the conditions under which States could be approved to implement ABAWD waivers. This chart appears in the Nutrition Title section of The Agriculture Improvement Act of 2018: Highlights and Implications, produced by ERS researchers.
Friday, February 15, 2019
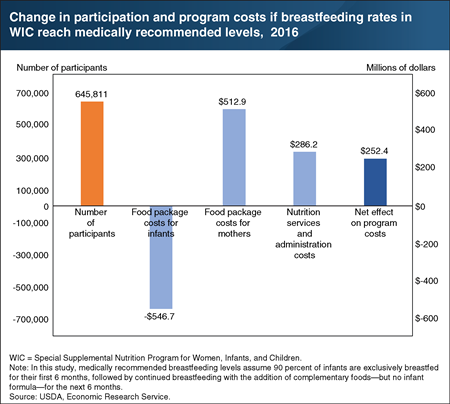
Breastfeeding promotion and support is a priority in USDA’s Special Supplemental Nutrition Program for Women, Infants, and Children (WIC). Although breastfeeding rates among infants participating in WIC have been increasing in recent decades, they remain below those of other infants. At the request of the U.S. Senate Committee on Appropriations, ERS examined the economic impacts of breastfeeding on the WIC program. ERS researchers estimated the economic costs and benefits if breastfeeding rates for WIC infants were more aligned with medically recommended levels i.e., if 90 percent of infants participating in WIC in 2016 had been exclusively breastfed for their first 6 months, followed by another 6 months with complementary foods—but no infant formula. Results from the analysis indicate that the number of mothers who participated in WIC that year would have increased by 646,000 per month, an 8-percent increase in the monthly number of total participants. This increase is the result of breastfeeding mothers being able to participate in WIC for 12 months postpartum versus 6 months for nonbreastfeeding mothers. Although infants’ food package costs would have decreased by $546.7 million that year, mothers’ food package costs would have increased by $512.9 million, and nutrition services and administrative costs would have increased by another $286.2 million. The net effect would have been an increase of $252.4 million—a 4-percent increase in total 2016 program costs. This chart appears in the ERS report, The Economic Impacts of Breastfeeding: A Focus on USDA’s Special Supplemental Nutrition Program for Women, Infants, and Children (WIC), released on February 14, 2019.
Monday, January 28, 2019
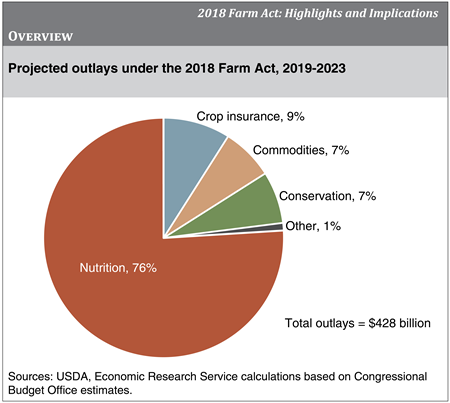
The Agriculture Improvement Act of 2018 (2018 Farm Act) was signed into law December 20, 2018, and will remain in force through the end of fiscal year 2023, although some provisions extend beyond 2023. The Congressional Budget Office (CBO) projects that the new Farm Act will mandate spending of $428 billion dollars over the next 5 fiscal years (2019-2023). A large majority of projected spending—76 percent ($326.02 billion)—will fund nutrition programs, with most going to the Supplemental Nutrition Assistance Program (SNAP). Crop insurance ($38.01 billion), farm commodity programs ($31.44 billion), and conservation programs ($29.27 billion) account for nearly all of the remaining outlays. Approximately 0.8 percent ($3.54 billion) will fund all other programs, including trade, credit, rural development, research and extension, forestry, energy, horticulture, and miscellaneous programs. Overall, the new Farm Act makes fewer changes to food and farm policy than the 2014 Farm Act. Nutrition policy, particularly SNAP, will continue with minor changes. Crop insurance options and agricultural commodity programs will continue largely as under the 2014 Farm Act. All major conservation programs will continue, although some were modified significantly. This chart appears in “The Agriculture Improvement Act of 2018: Highlights and Implications,” December 20, 2018.


