
Percent of residents participating in SNAP decreased in 46 States from 2013 to 2018
- by Laura Tiehen
- 7/18/2019
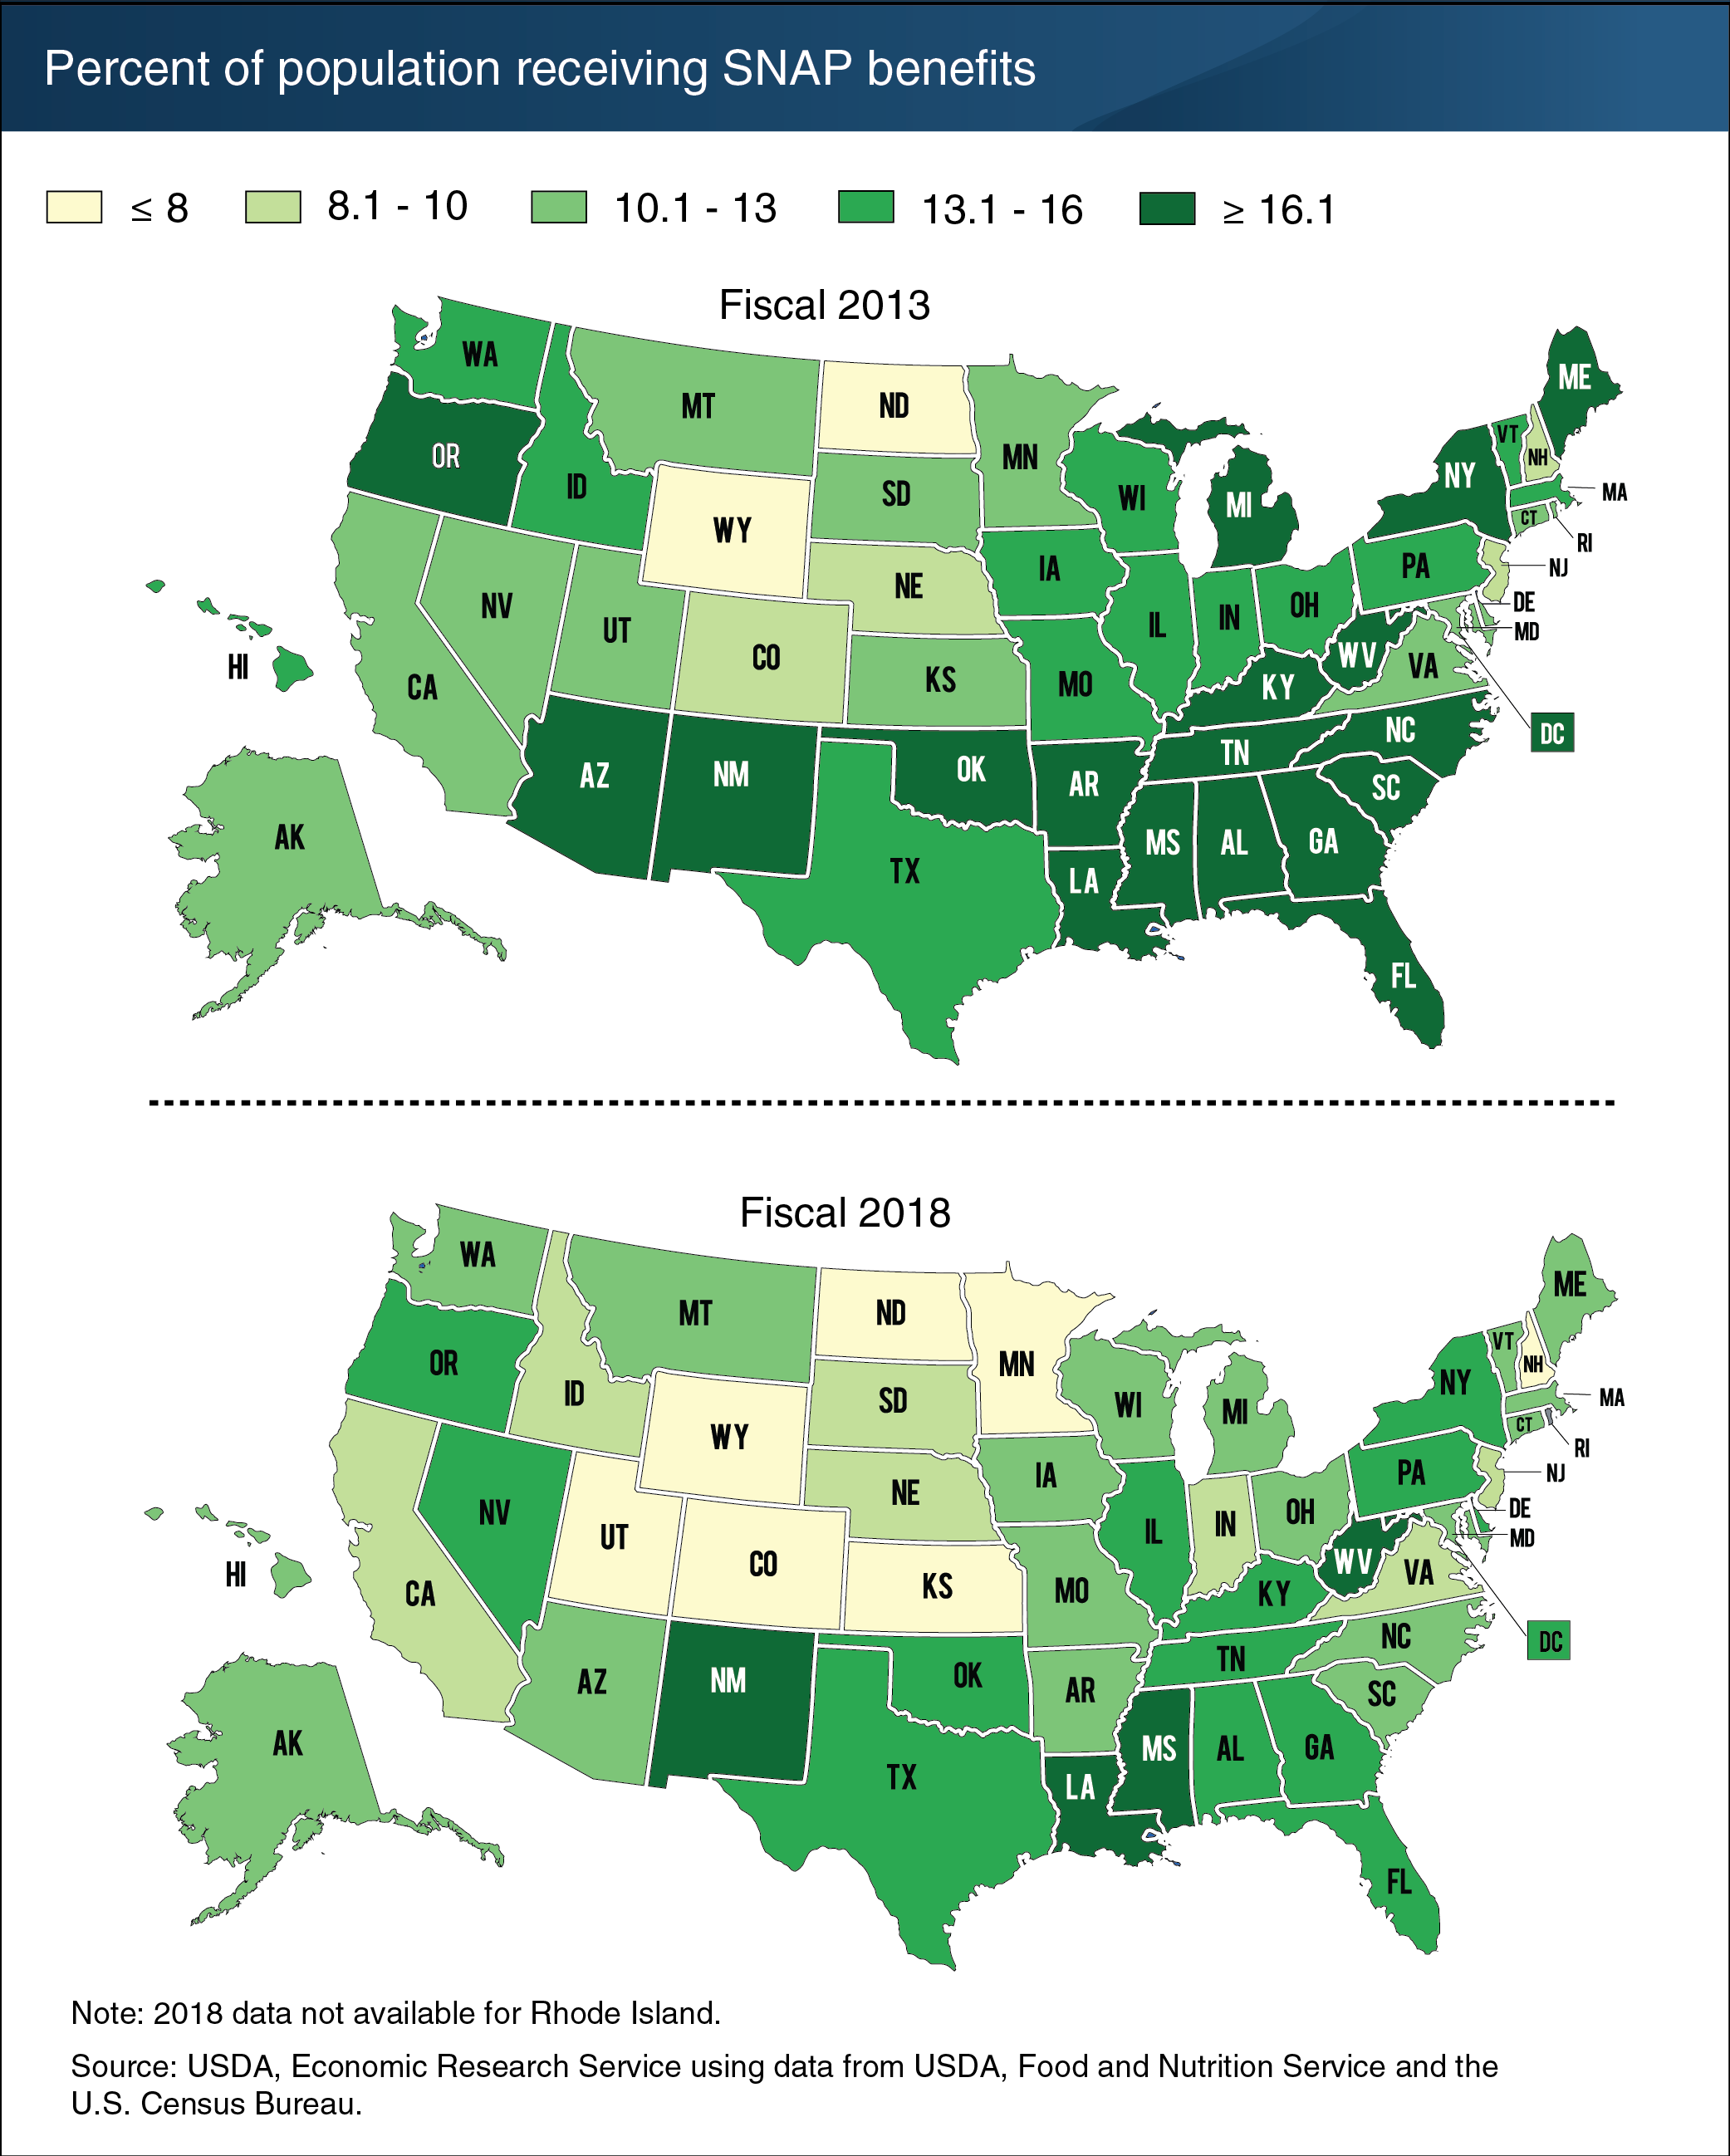
USDA’s Supplemental Nutrition Assistance Program (SNAP) provides benefits for purchasing food in authorized food stores to needy households with limited incomes and assets. In fiscal 2018, an average of 40.3 million low-income individuals per month received SNAP benefits in the United States. The percent of Americans participating in the program declined from 15.0 percent in 2013 to 12.3 percent in 2018, marking the fifth consecutive year of a decline in the percent of the population receiving SNAP. In seven States—Colorado, Kansas, Minnesota, New Hampshire, North Dakota, Utah, and Wyoming—8 percent or fewer of residents received SNAP benefits in 2018. Between 2013 and 2018, 46 States and the District of Columbia saw a decrease in the share of residents receiving SNAP benefits, while 4 States experienced increases. Idaho showed the largest decline in percent of residents participating in SNAP—a 36-percent decline from 14.1 to 9.0 percent of residents. Eighteen States and the District of Columbia had declines in participation shares of at least 25 percent between 2013 and 2018. Nevada had the largest increase in participation share, growing from 12.9 to 14.5 percent of residents. The fiscal 2018 map appears in the Food Security and Nutrition Assistance section of the ERS data product “Ag and Food Statistics: Charting the Essentials,” updated in June 2019.