ERS Charts of Note
Subscribe to get highlights from our current and past research, Monday through Friday, or see our privacy policy.
Get the latest charts via email, or on our mobile app for  and
and 
Tuesday, March 27, 2012
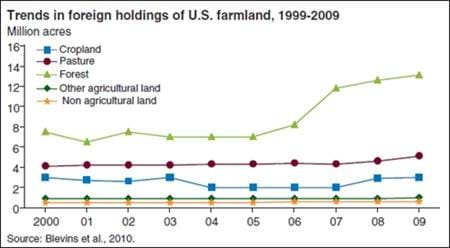
Despite recent increases in foreign ownership of forest land, annual data compiled by USDA's Farm Service Agency reveal that, as of February 2009, only 1.7 percent of privately owned land in farms or forest-22.8 million acres-was owned by foreigners. The majority of this land is owned by people or firms from two countries: Canada (34 percent) and the Netherlands (17 percent). Most foreign ownership is concentrated in Maine: 15.7 percent of Maine's privately owned farm and forest land, or 2.82 million acres, is foreign owned. Of this amount, 2.77 million acres are forest land. Hawaii, Washington, Nevada, Alabama, and Texas all have relatively high levels of foreign ownership of farm and forest land. This graph is found in the ERS report, Trends in U.S. Farmland Values and Ownership, EIB-92, February 2012.
Wednesday, March 21, 2012
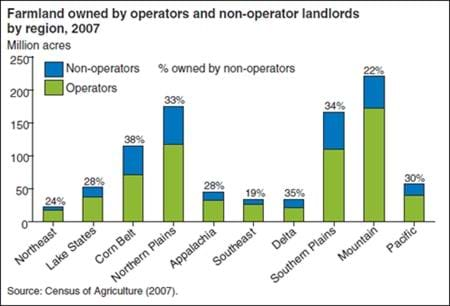
Coupled with questions about the likely stability of farmland values are questions about whether active farmers benefited from the recent increases in those values. Three of the top four regions in terms of land in agriculture (Northern and Southern Plains and the Corn Belt) have non-operating owners (owners who do not themselves farm) owning more than 30 percent of the land. Non-operators owned 29 percent of all land in farms in 2007. Non-operators tend to be older, less likely to live on the farm, and less likely to participate in conservation programs. This graph is found in the ERS report, Trends in U.S. Farmland Values and Ownership, EIB-92, February 2012.
Tuesday, March 20, 2012
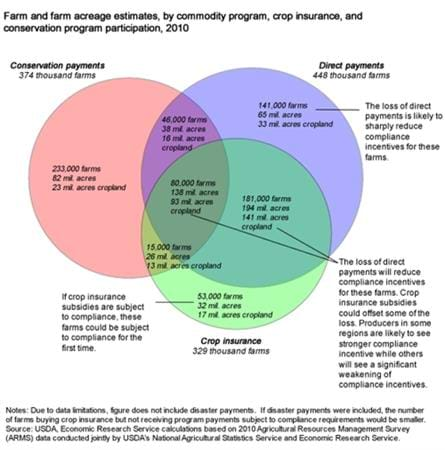
In recent years, direct payments (DPs) have been a key source of environmental compliance (EC) incentives. Under EC, farmers must apply approved soil conservation systems to highly erodible cropland and refrain from draining wetland to maintain eligibility for most USDA agricultural programs. Federally subsidized crop insurance is the only large USDA program that is not currently subject to EC. Direct payments may be reduced or eliminated in the next farm bill (due in 2012) to help reduce the Federal budget deficit. An end to DPs would sharply reduce compliance incentives for many farms. Some farmers (but not all) would continue to be subject to EC because of other payments, primarily conservation and disaster assistance. One way to fill the incentive gap for other farmers would be to extend EC requirements to crop insurance. The extent to which crop insurance could replace compliance incentives now supplied by DPs will depend, in part, on the extent to which farmers who receive DPs also buy crop insurance. Roughly 141,000 farmers (7 percent), operating on 33 million acres of cropland (8 percent), received DPs in 2010 but did not purchase crop insurance or receive conservation payments. For these farms, extending compliance requirements to cover crop insurance would not replace DP incentives. In 2010, 181,000 farms (9 percent), operating on 141 million acres of cropland (36 percent), received DPs and also purchased crop insurance, but did not receive conservation payments. For these farms, making crop insurance subject to compliance sanction could help compensate for compliance incentives lost if direct payments end. Farmers who do not receive DPs or other payments subject to compliance but do purchase crop insurance may be subject to compliance requirements for the first time. In 2010, an estimated 53,000 farms (2.4 percent) with 17 million crop acres (4.3 percent) received neither conservation payments nor DPs but did purchase crop insurance. Some of these farms may already be subject to compliance requirements because of disaster payments. Of course, farms facing compliance requirements based on crop insurance coverage would be affected only if they continued to purchase crop insurance. This chart is found in the ERS report, The Future of Environmental Compliance Incentives in U.S. Agriculture, EIB-94, March 2012.
Tuesday, February 28, 2012
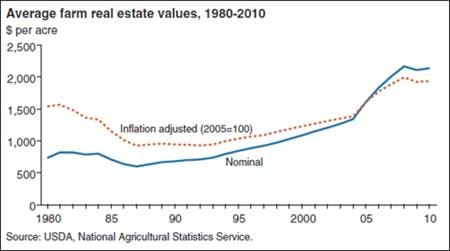
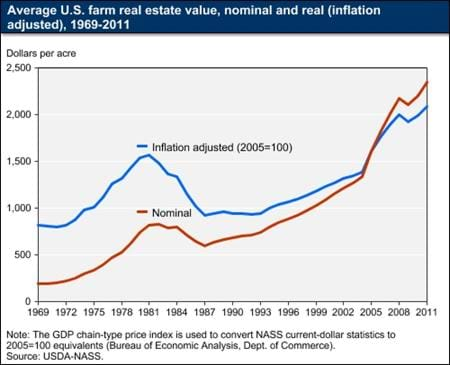
Because farm real estate represents much of the value of U.S. farm sector assets, large swings in farmland values can affect the financial well-being of agricultural producers. Since the farm crisis of the mid-1980s, farm real estate values (including land and buildings) have been rising in both nominal and real (i.e., inflation adjusted) terms. Between 1994 and 2004, real values increased between 2 and 4 percent annually. In 2005 and 2006, values jumped 16 percent and 11 percent, before slowing to 6-7 percent in 2007 and 2008. This chart comes from the ERS report, Trends in U.S. Farmland Values and Ownership, EIB-92, February 2012.
Wednesday, December 28, 2011
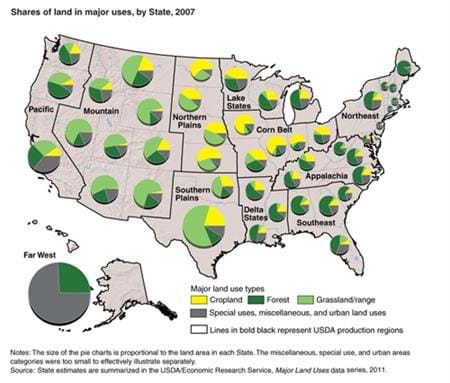
Land-use patterns vary greatly by region, reflecting differences in soils, climate, topography, and patterns of population settlement. Some clear regional land-use patterns exist. Cropland is roughly concentrated in the central regions of the contiguous United States, where the Northern Plains and Corn Belt hold the majority of their land in cropland. The Mountain region and Southern Plains have the majority of their land in grassland pasture and range. The Northern Plains and Pacific regions also have relatively high shares of grazing acreage, with more than a third and a quarter of their land area, respectively, allocated to grassland and pasture and range. Forest-use land is most prevalent in the Eastern regions, such as the Northeast, Appalachian, Southeast, and Delta States, which have a majority of their land in forest uses. The Northeast and Southeast have the highest shares of urban land, while the Lake States, Corn Belt, Appalachian, and Pacific regions also have urban shares above the nation's average. This map is found in the ERS report, Major Uses of Land in the United States, 2007, EIB-89, December 2011. The data that underpin the report are available in Major Land Uses, a data product on the ERS website, updated December 19, 2011.
Wednesday, August 24, 2011
Farmland values rose throughout much of the post-World War II period. From 1969 to 1981, real farmland prices increased 92 percent as agricultural producers responded to high returns and federal policies encouraging investment in agriculture. After 1981, farmland values began to decline in response to rapidly rising interest rates and higher energy prices. Since the farm crisis of the mid-1980s, farmland real estate values (including land and buildings) have been rising in both nominal and real (i.e., inflation-adjusted) terms. Between 1994 and 2004, real values increased between 2 and 4 percent annually, and in 2005 and 2006 increased by 16 percent and 10 percent respectively. Since then, real growth in farmland values has slowed, but is still increasing by 3 to 5 percent annually. States in several regions, including the Corn Belt and Great Plains, experienced double digit growth between 2010 and 2011, while many States in the Southeast and Northeast experienced declines. This chart comes from Agricultural Land Values on the ERS website, updated in August 2011.
Tuesday, August 23, 2011
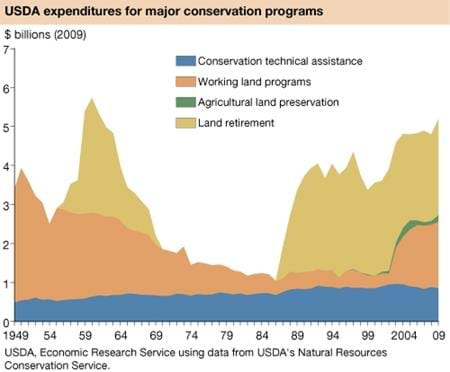
USDA provides technical and financial assistance to help farmers implement conservation practices on working agricultural lands or on lands temporarily retired from production. As measured in constant (2009) dollars, Federal conservation assistance has fluctuated widely during the past 60 years. Rapid increases in spending have typically been associated with large-scale land retirement in the Soil Bank (1956-1972) and Conservation Reserve (1986-present) Programs. Since 2002, however, and after several decades with stable levels of spending, there has been a big increase in conservation assistance through programs that help farmers defray conservation costs on working agricultural lands. This chart may be found in the September 2011 issue of Amber Waves magazine.
Tuesday, July 19, 2011
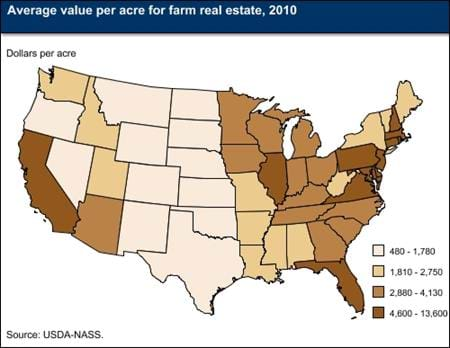
Agricultural land values vary across States and regions depending on the inherent quality of the land for agricultural production, and on competing demands for other uses, such as development. As of January 2010, the Northeast farm production region had the highest average value of farm real estate, at $4,690 per acre, due in large part to the expected value of agricultural land for future nonagricultural uses. Rhode Island had the highest average value of any State, at $13,600 per acre. At the other extreme, farmland values in New Mexico, which contains large amounts of low-value rangeland, averaged $480 per acre. The average for the coterminous 48 States was $2,140. This map comes from Agricultural Land Values on the ERS website, updated in June 2011.


