
Food acquisition locations differ by household income and SNAP participation
- by Jessica E. Todd
- 8/1/2016
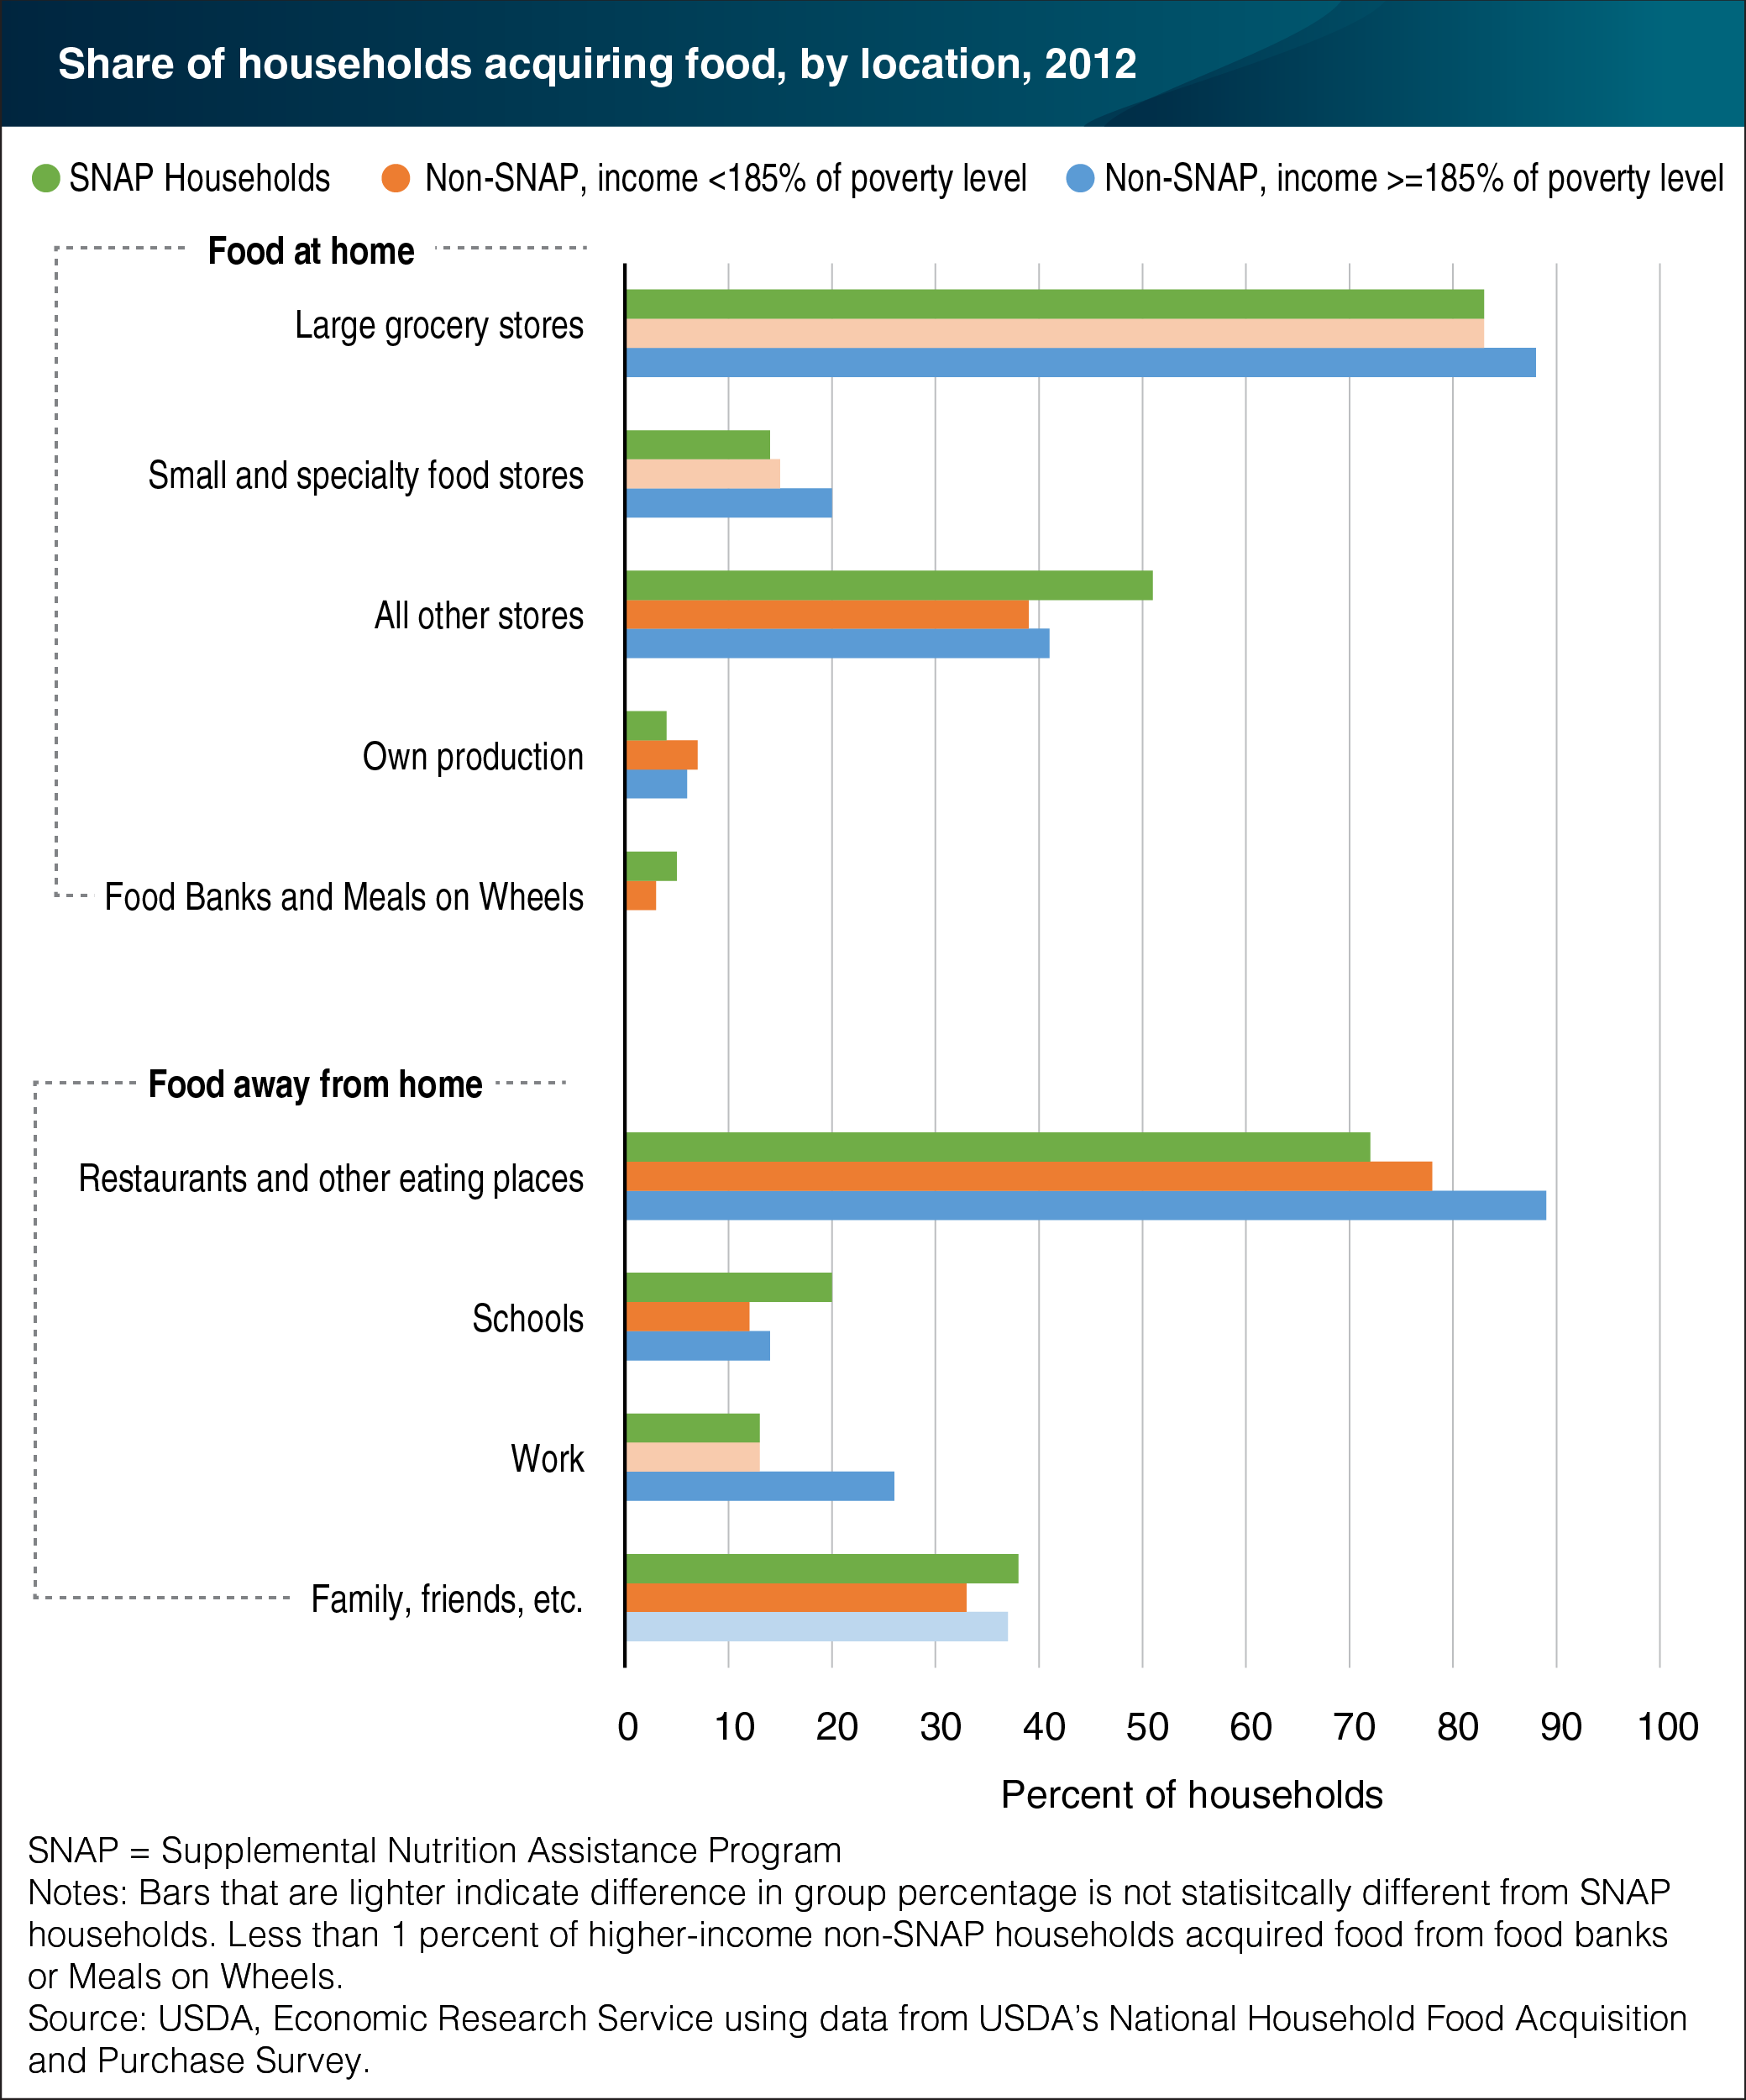
Understanding where U.S. households acquire food, what they acquire, and what they pay is essential to identifying which food and nutrition policies might improve diet quality. USDA’s National Household Food Acquisition and Purchase Survey (FoodAPS) provides a complete picture of these key aspects during a 7-day period in 2012 by including both food at home and food away from home acquisitions. Higher-income households are more likely to visit large grocery stores (88 versus 83 percent) and small or specialty food stores (20 versus 14-15 percent) than households that participate in USDA’s Supplemental Nutrition Assistance Program (SNAP) and lower-income non-SNAP households. SNAP households are more likely to report an acquisition in the ‘all other stores’ category compared with both non-SNAP groups (51 versus 39-41 percent), which includes convenience stores, gas stations, and pharmacies. Considering food away from home, SNAP households are least likely to visit restaurants/other eating places when compared to lower-income non-SNAP and higher-income households. In addition, a larger share of SNAP households obtain food from schools (20 percent) than lower-income non-SNAP households (12 percent) and higher-income households (14 percent). Finally, higher-income households are twice as likely to get food from work than the other two groups, which is not surprising given their greater employment rates. The data for this chart can be found in the ERS report, Where Households Get Food in a Typical Week: Findings from USDA’s FoodAPS, released on July 27, 2016.