
Increased productivity now the primary source of growth in world agricultural output
- by Keith Fuglie
- 10/16/2015
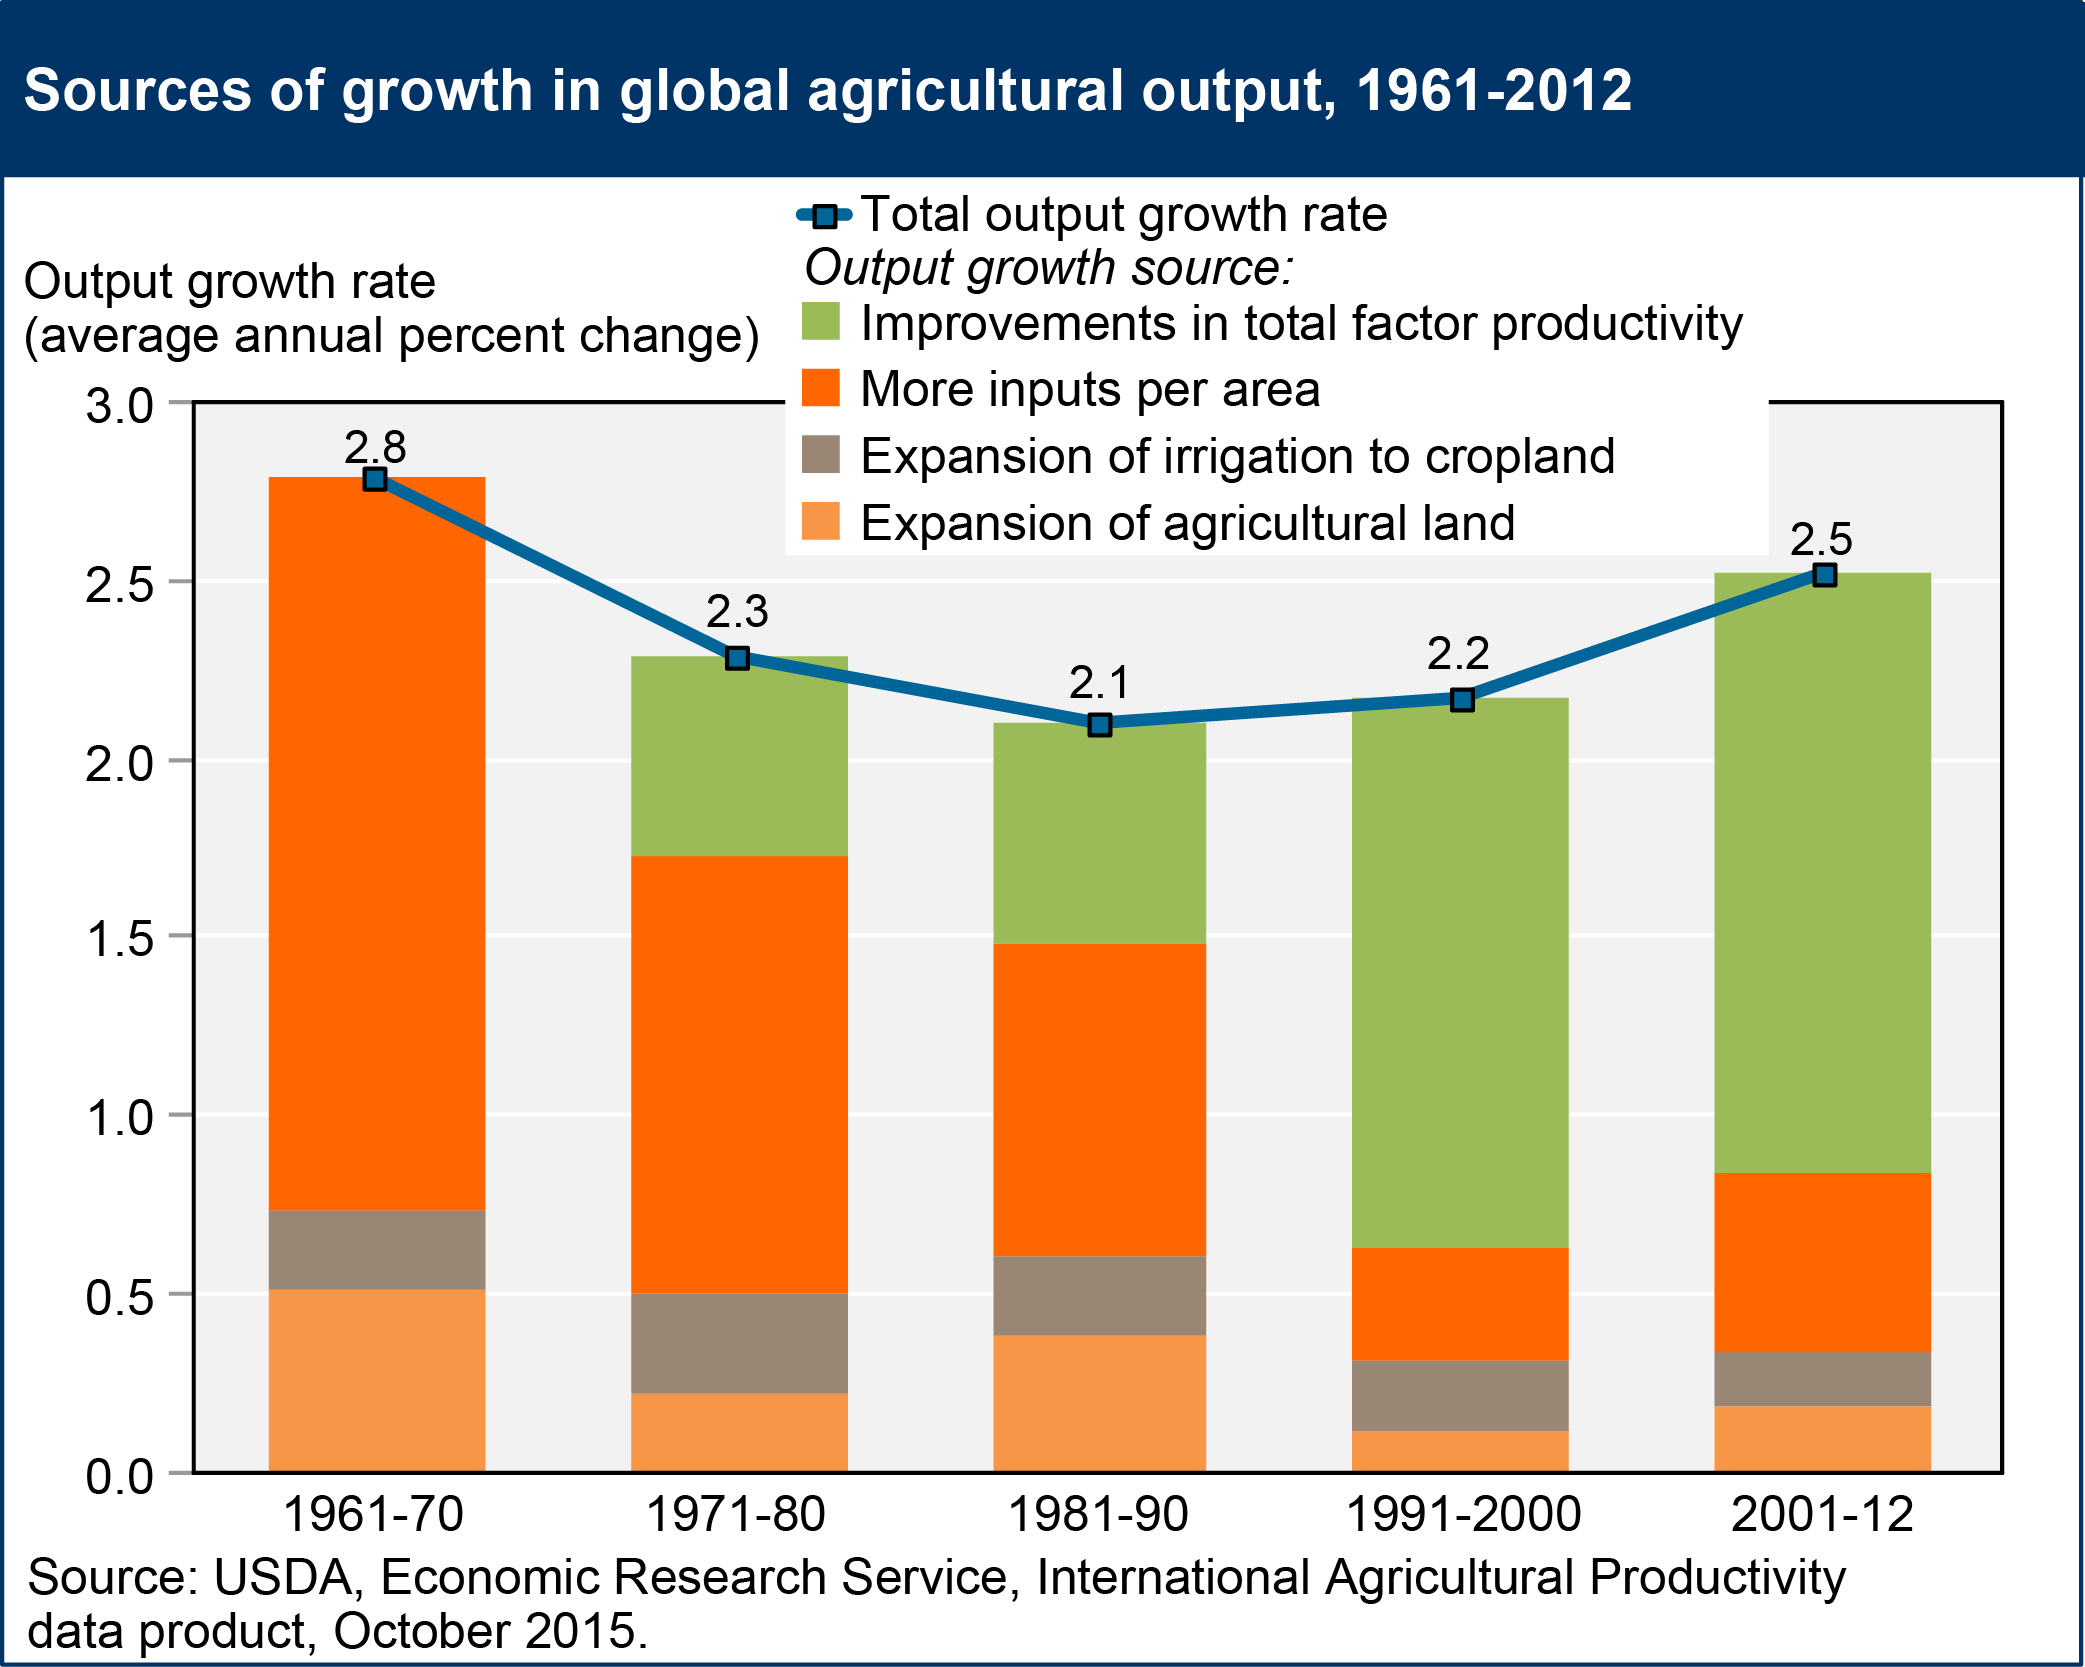
The average annual rate of global agricultural output growth slowed in the 1970s and 1980s, then accelerated in the 1990s and 2000s. In the latest period estimated (2001-12), global output of total crop and livestock commodities was expanding at an average rate of 2.5 percent per year. In the decades prior to 1990, most output growth came about from intensification of input use (i.e., using more labor, capital, and material inputs per acre of agricultural land). Bringing new land into agriculture production and extending irrigation to existing agricultural land were also important sources of growth. This changed over the last two decades, as input growth slowed. In 2001-12, improvements in productivity—getting more output from existing resources—accounted for about two-thirds of the total growth in agricultural output worldwide, reflecting the use of new technology and changes in management practices by agricultural producers around the world. This chart is based on the ERS data product, International Agricultural Productivity, updated October 2015.