
Dairy production is concentrated in climates that expose animals to less heat stress
- by Nigel Key and Stacy Sneeringer
- 7/8/2015
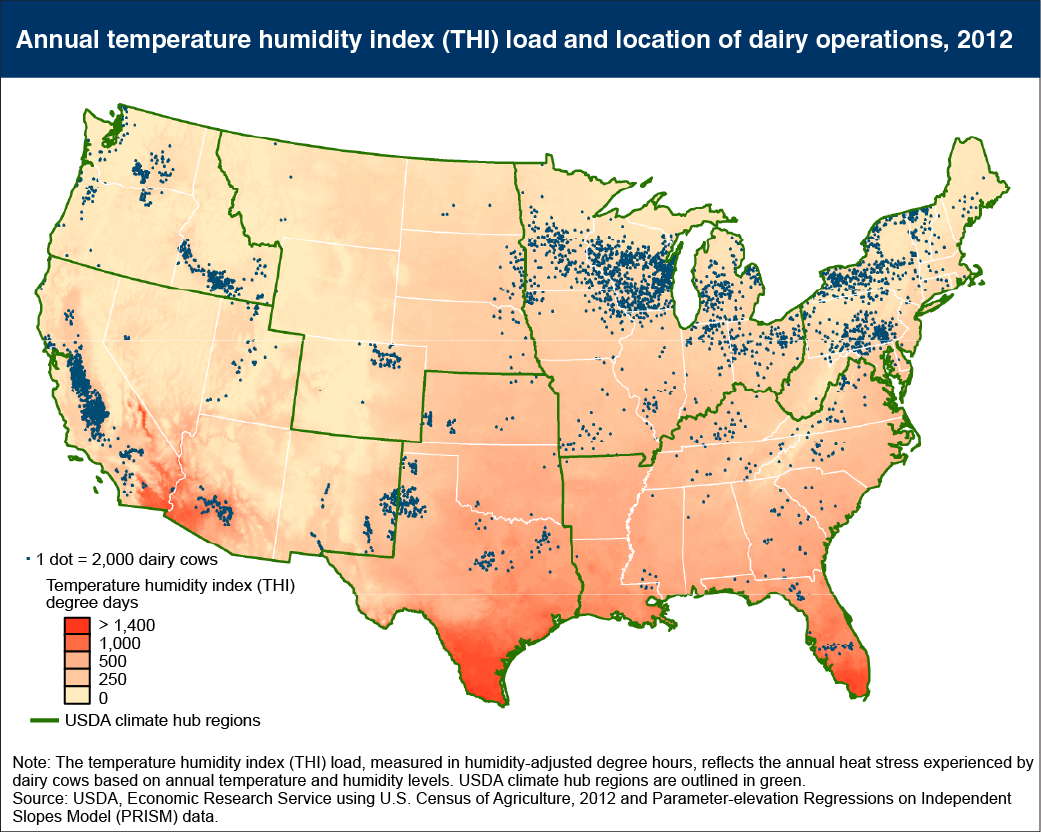
Above a temperature threshold, an animal may experience heat stress resulting in changes in its respiration, blood chemistry, hormones, metabolism, and feed intake. Dairy cattle are particularly sensitive to heat stress; high temperatures lower milk output and reduce the percentages of fat, solids, lactose, and protein in milk. In the United States, dairy production is largely concentrated in climates that expose animals to less heat stress. The Temperature Humidity Index (THI) load provides a measure of the amount of heat stress an animal is under. The annual THI load is similar to “cooling degree days,” a concept often used to convey the amount of energy needed to cool a building in the summer. The map shows concentrations of dairy cows in regions with relatively low levels of heat stress: California’s Central Valley, Idaho, Wisconsin, New York, and Pennsylvania. Relatively few dairies are located in the very warm Gulf Coast region (which includes southern Texas, Louisiana, Mississippi, Alabama, and Florida). This map is drawn from Climate Change, Heat Stress, and Dairy Production, ERR-175, September 2014.