
Ice cream and frozen dairy production dipped from 2000 to 2024
- by Angel Terán and Sara Scott
- 7/16/2025
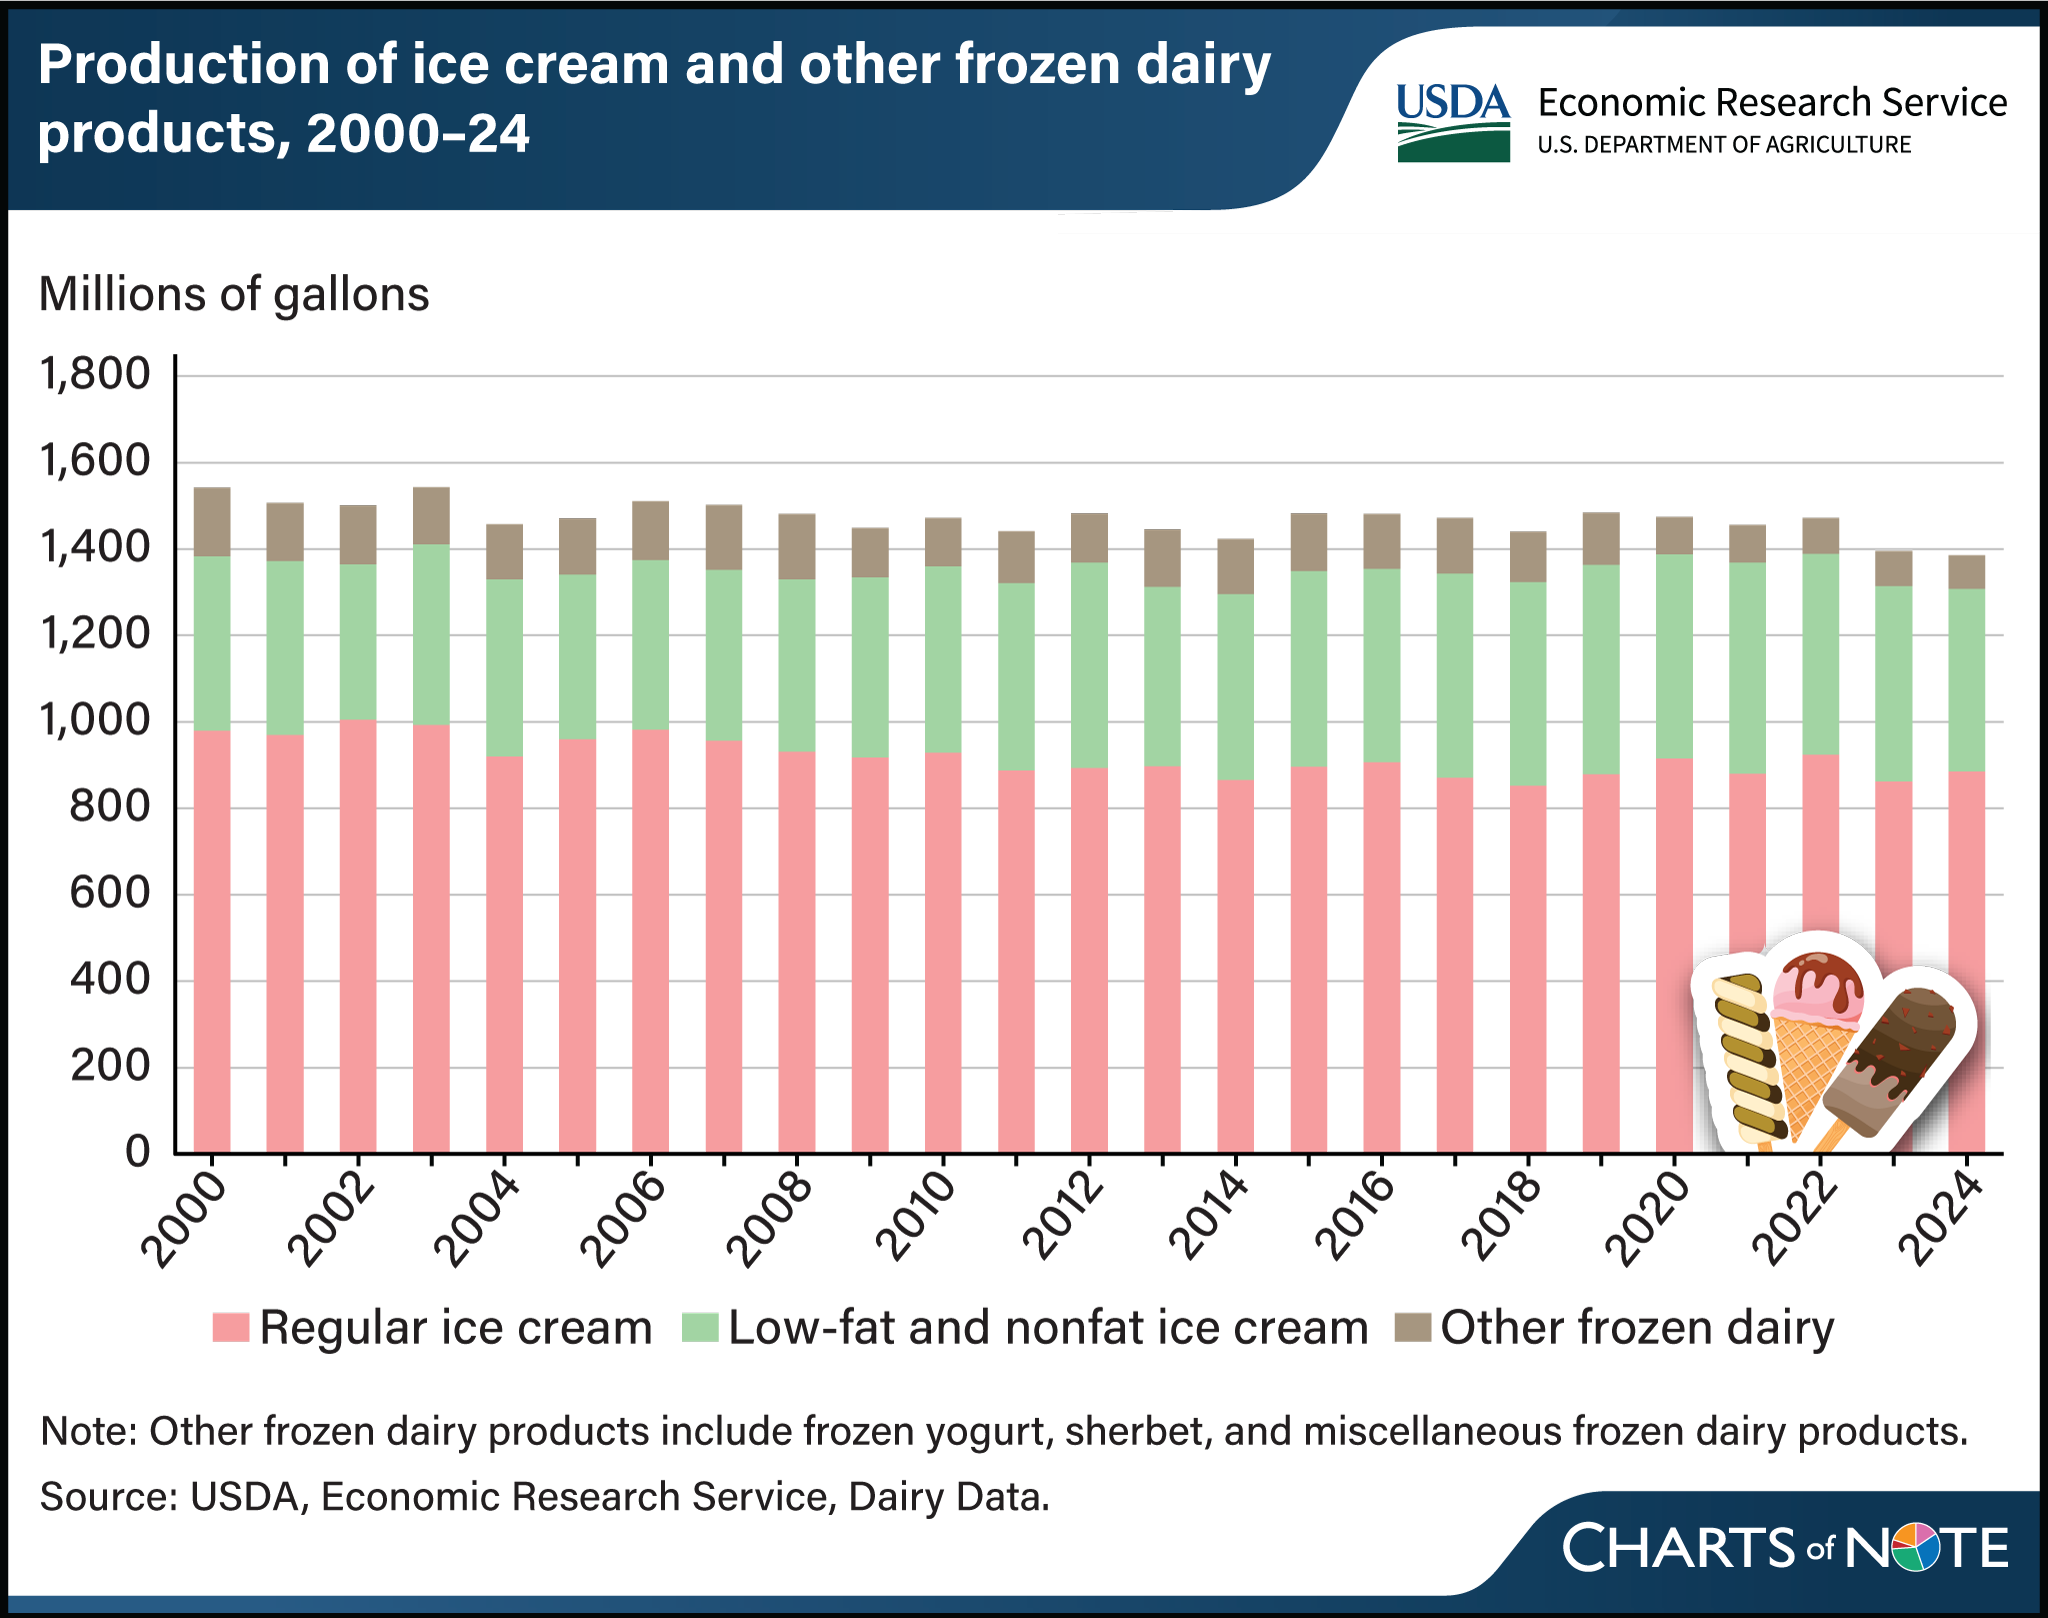
From 2000 to 2024, U.S. production of ice cream and other frozen dairy products declined by 10 percent, falling from a peak of 1,542 million gallons in 2003 to 1,386 million gallons in 2024. Data indicate an uptick in production from 2019–22, but production has started to decline since 2022. While overall frozen dairy production volumes softened from 2000 to 2024, the category mix evolved. Regular ice cream remained the dominant category (around 60–65 percent of total ice cream production), but low-fat and nonfat ice cream scooped up market share, with their production share varying between 24 and 34 percent. Since 2023, however, low-fat and nonfat ice cream, along with frozen dairy treats such as sherbet and frozen yogurt, have decreased both in volume and market share, creating more space in the frozen aisle for regular ice cream. Information about ice cream supply and per capita availability of ice cream by category is available in the USDA, Economic Research Service Dairy Data.