
State-level changes in food sales varied in 2024
- by Wilson Sinclair and Eliana Zeballos
- 7/9/2025
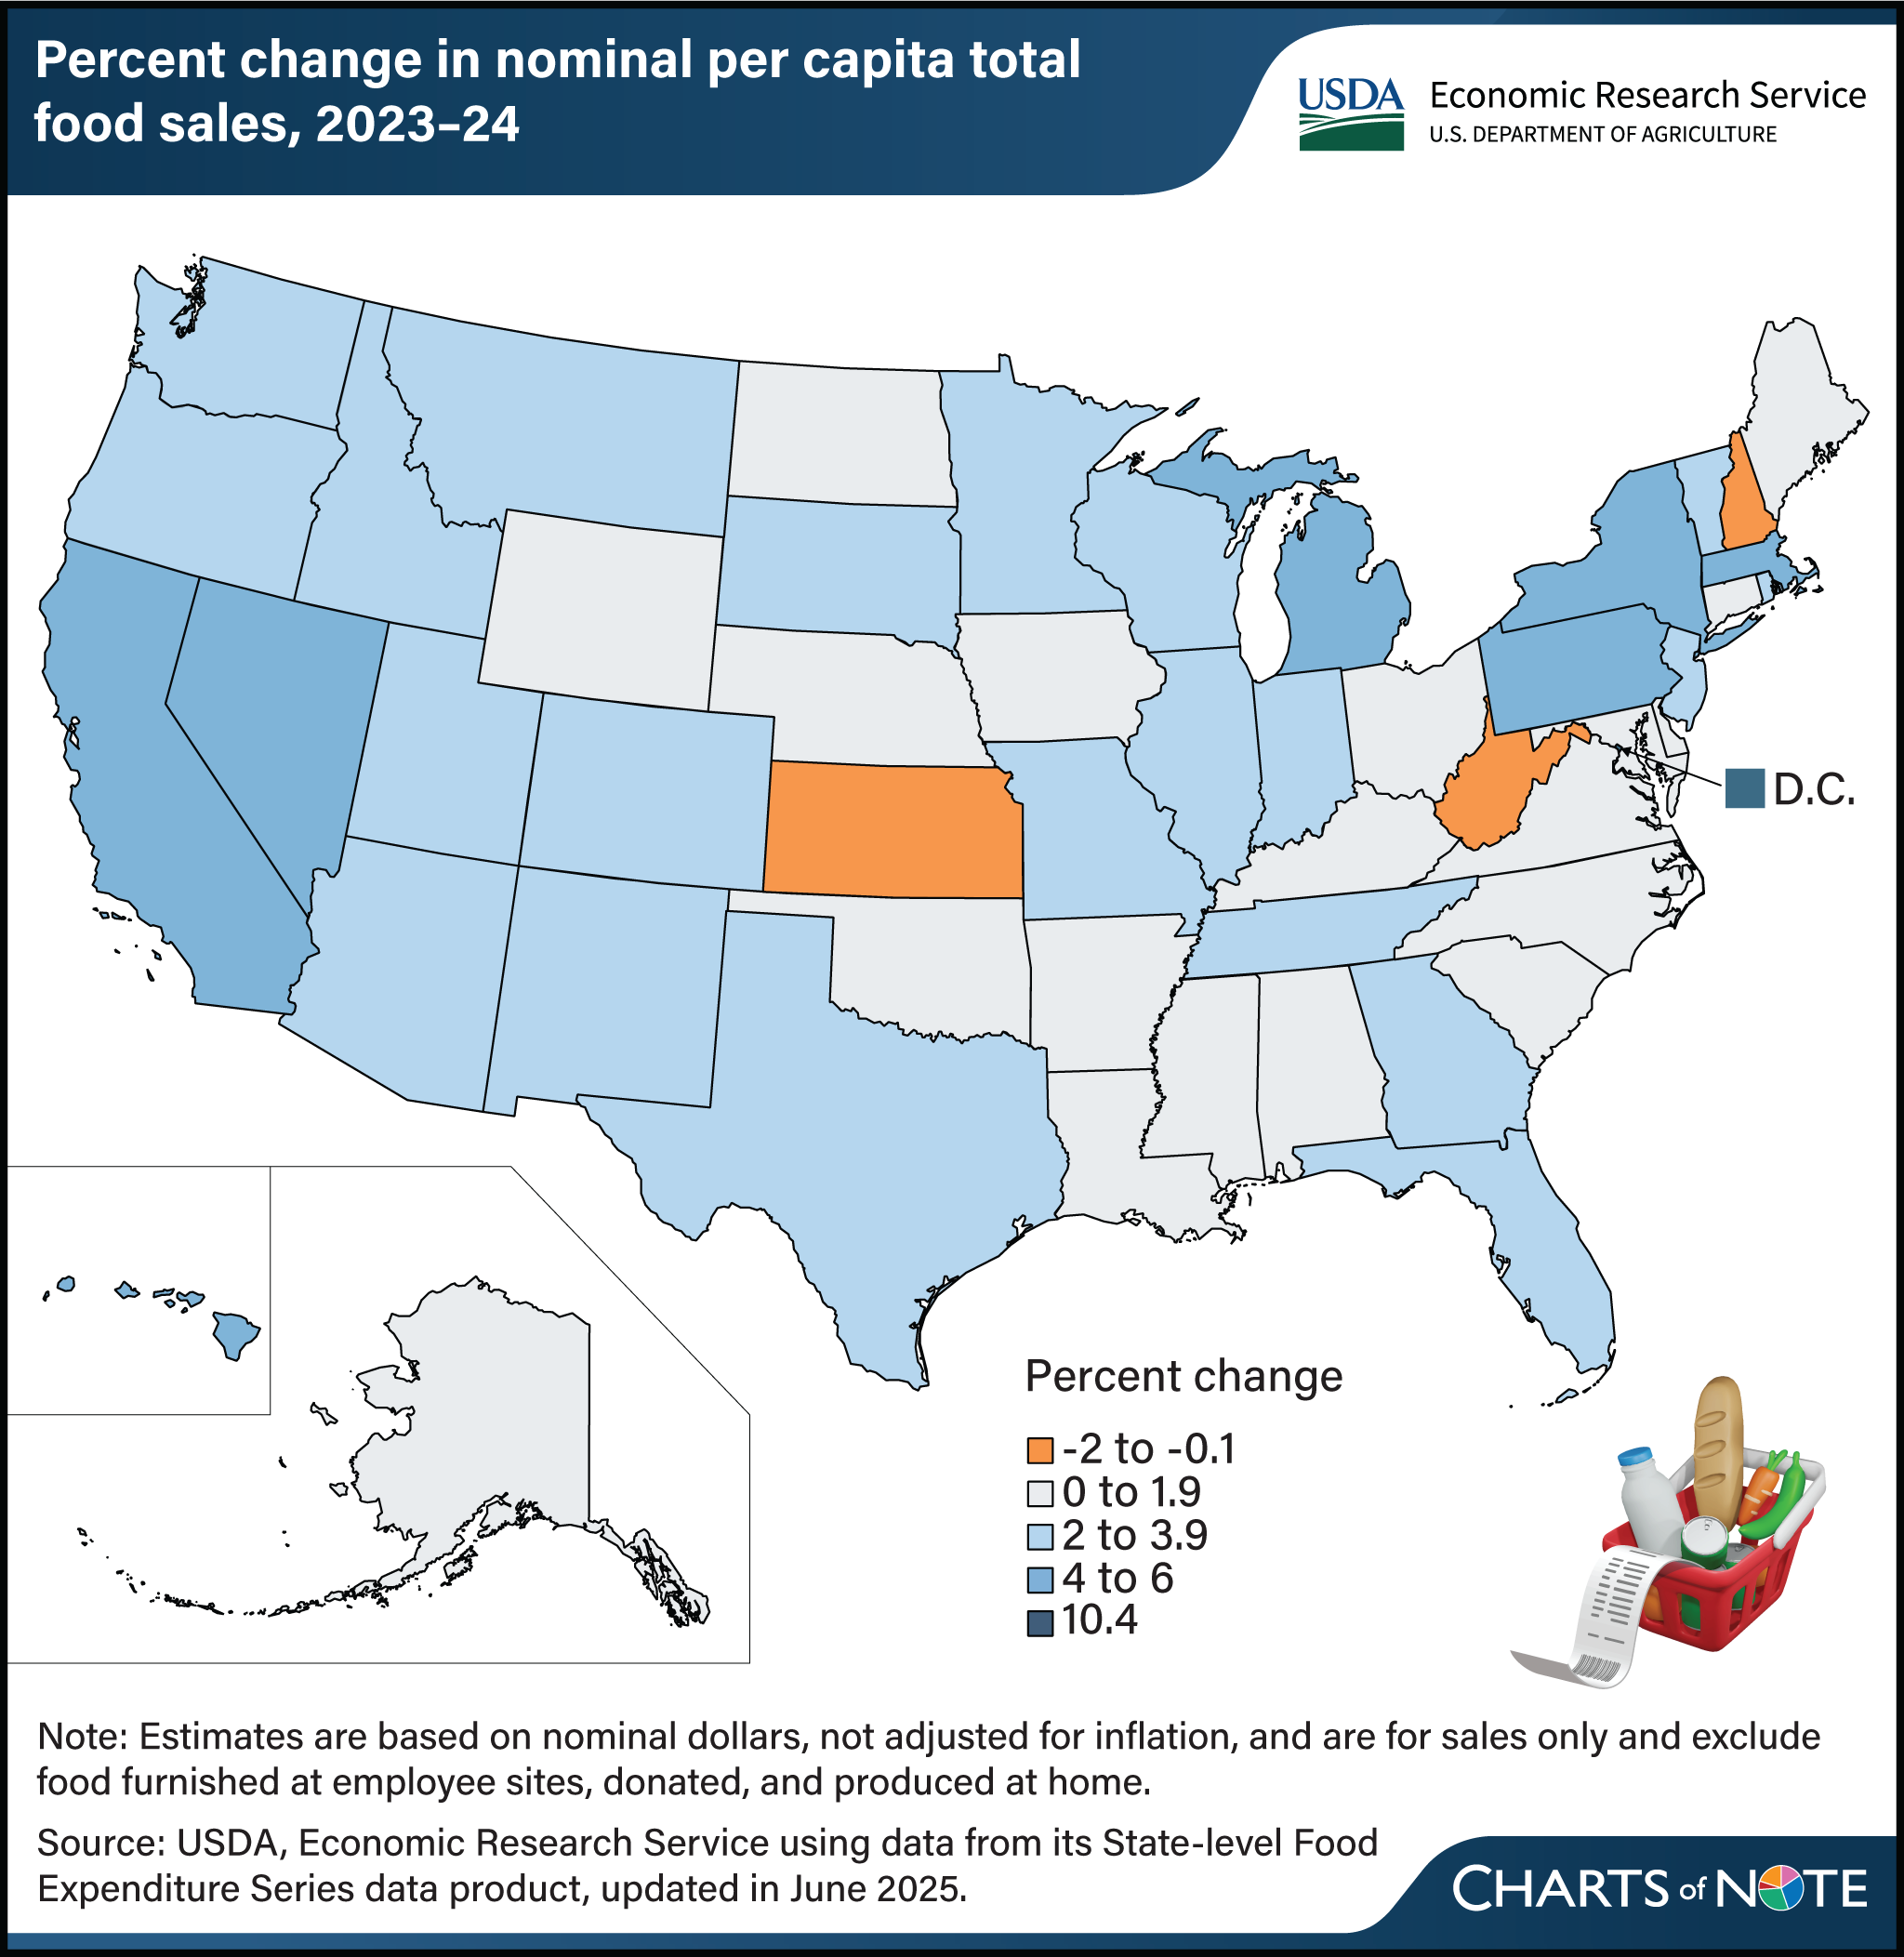
Per capita total U.S. food spending increased 3.2 percent from 2023 to 2024, slightly outpacing the 2.3-percent increase in food prices over the same period, showing a stronger demand for food despite higher prices. However, national trends in sales mask uneven growth across States. Three states showed a decrease in per capita food sales, with New Hampshire declining the most, down 2 percent in 2024. This was driven by a 6.6-percent decrease in sales at grocery stores, supercenters, and other food-at-home (FAH) outlets, which was only partially offset by a 2.1-percent increase at food-away-from-home (FAFH) outlets such as restaurants. West Virginia and Kansas were the only other States where total per capita food sales declined, falling by 1 percent and 0.2 percent, respectively. In both States, FAH sales decreased more than FAFH sales increased. Overall, per capita FAH sales decreased in 12 States in 2024, while FAFH sales increased in all 50 States. Per capita food sales overall increased the most in Washington, DC (10.4 percent), driven by the rise in FAFH sales. Other States with high growth include New York (5.9 percent) and California (5.5 percent). This chart is drawn from USDA, Economic Research Service’s State-level Food Expenditure Series, updated June 2025.