

Food Price Inflation Slowed in 2023 and 2024
- by Victoria Davidenko, Megan Sweitzer and Winfrey Norton
- 6/12/2025
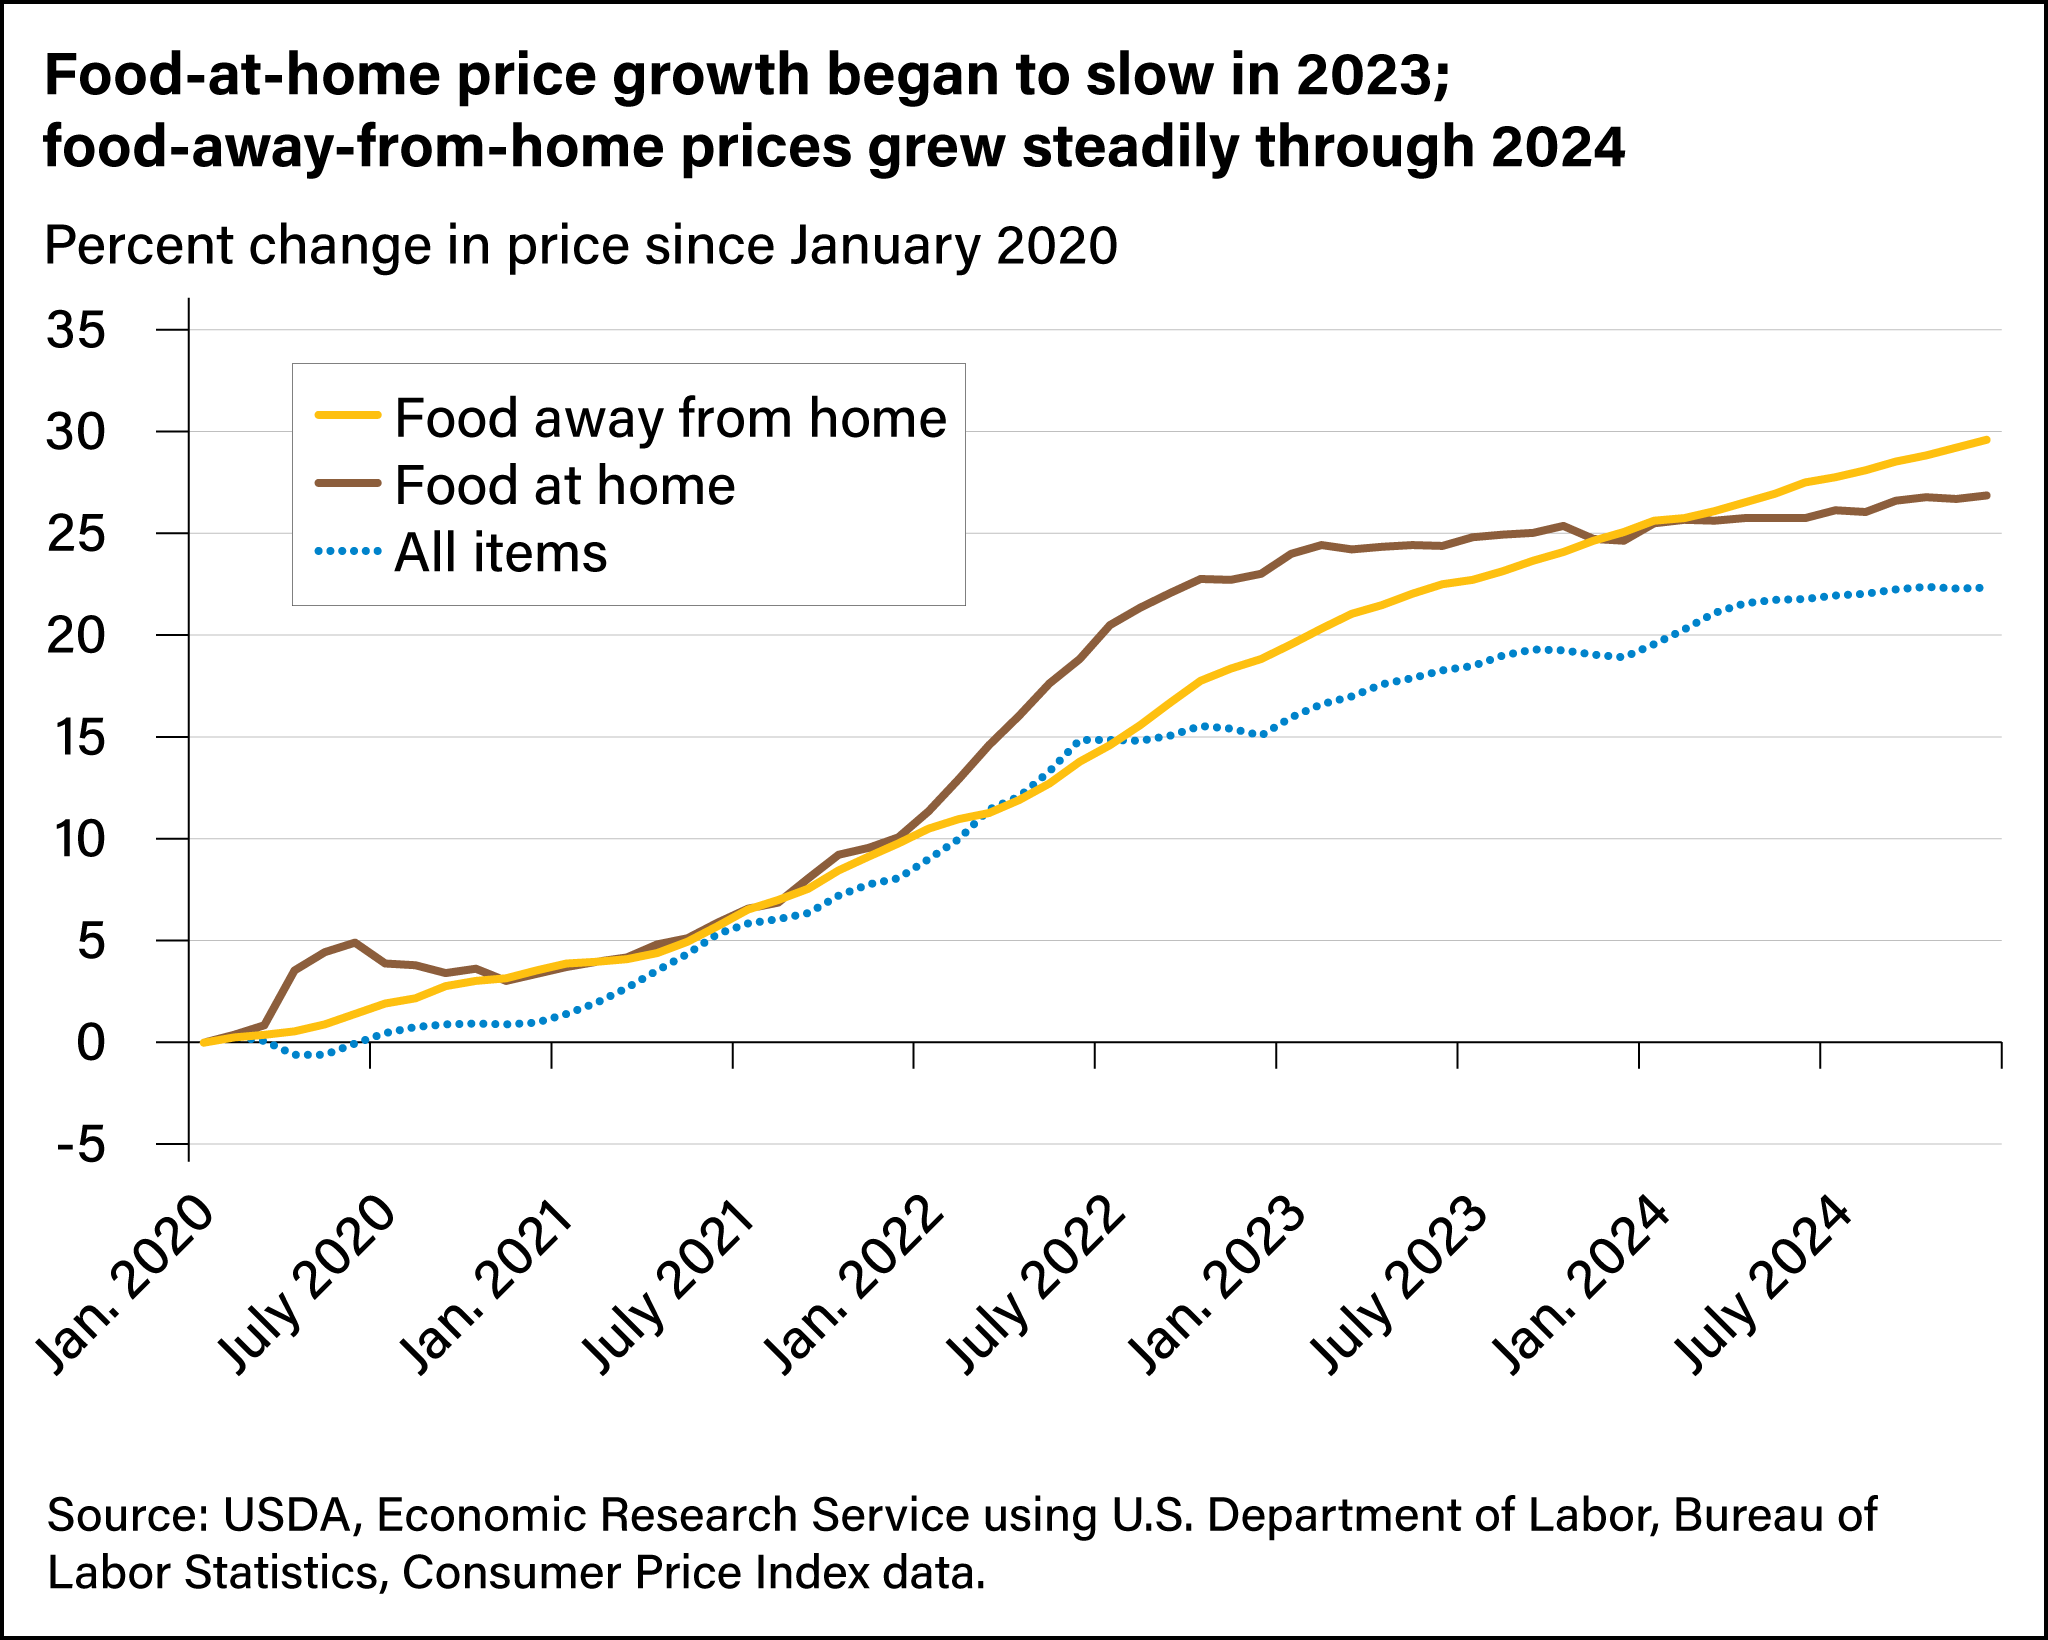
The USDA, Economic Research Service’s (ERS) Food Price Outlook tracks and forecasts U.S. food price changes. In recent years, food prices have been particularly volatile as economic shocks ushered in steep price increases from mid-2021 through 2022. Notably, the Coronavirus (COVID-19) pandemic shifted household food consumption patterns from 2020 to 2022, while also contributing to challenges across the food supply chain that includes producers, processors, retailers, and the transportation industry. In 2022, an outbreak of highly pathogenic avian influenza (HPAI) led to losses of poultry flocks, fueling higher prices for eggs and poultry. Also, the Russia-Ukraine war increased costs for several agricultural commodities, fertilizer, and energy, which is an input cost at many stages of the food supply chain. A strong labor market and competition for workers also pushed wages higher across the food supply chain. As a result, U.S. food-at-home prices increased 24.0 percent between January 2020 and January 2023. Overall inflation in the United States peaked in 2022, as did food prices at a 9.9-percent increase from the previous year. Since then, U.S. food price increases have tapered off, growing 5.8 percent in 2023 and 2.3 percent in 2024.
Price Patterns Differ for Food at Home and Food Away From Home
Trends for food at home, or groceries, were different than for food away from home, which captures restaurants and other dining out activities. In early 2023, food-at-home prices began to cool as economic challenges, supply chain issues, and wholesale food prices eased. In 2023 and 2024, food-at-home price growth flattened and was lower than increases for the Consumer Price Index (CPI) for all items. However, food-away-from-home prices continued to grow at above-average rates throughout 2023 and 2024, outpacing food at home and the all-items CPI.
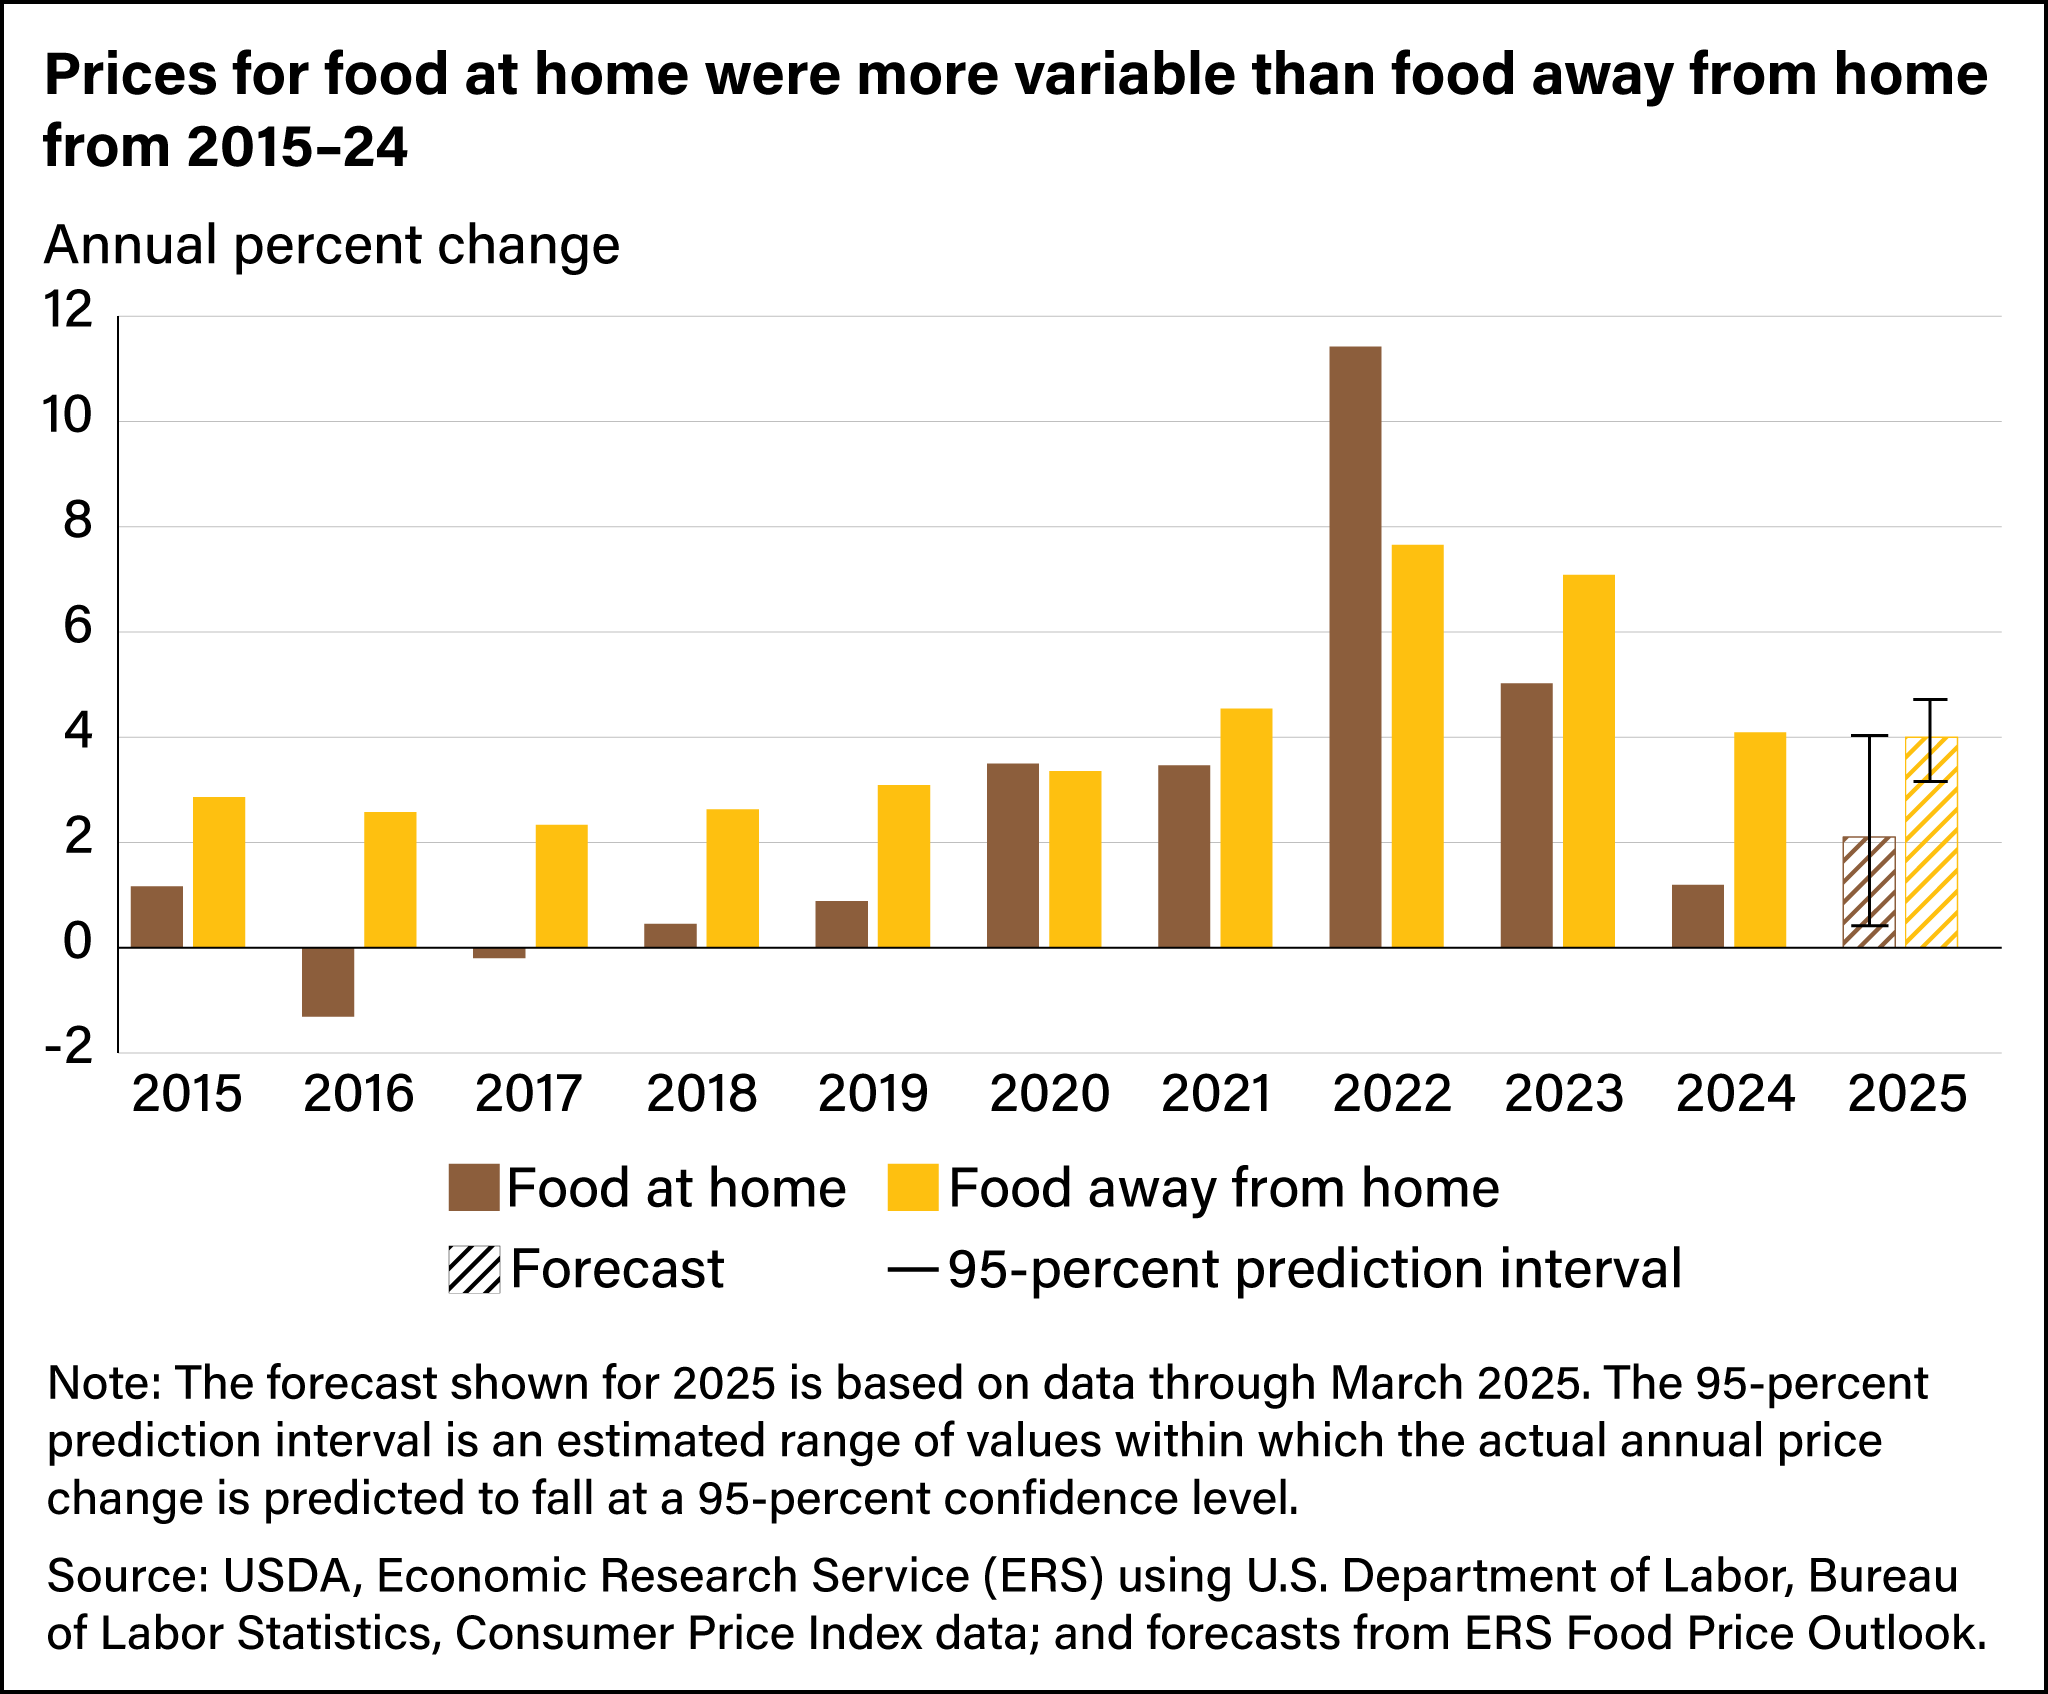
Over the past decade, food-at-home prices have varied more than food-away-from-home prices. For example, food-at-home prices decreased by 1.3 percent in 2016, peaked at 11.4 percent in 2022, and have since decelerated, growing by 1.2 percent in 2024. In contrast, prices for food away from home showed consistent growth across the past decade, rising by more than 7.0 percent in 2022 and 2023 and moderating to a 4.1-percent increase in 2024. One reason for the divergence in food-at-home and food-away-from-home price trends is differences in the costs to sell food at retail stores compared with preparing food in restaurants. In 2025, the ERS Food Price Outlook forecasts show that food-at-home prices are expected to rise faster than in 2024 but slower than the 2005–24 average rate of growth (2.6 percent), while food-away-from-home prices are predicted to grow at rates above average (3.5 percent) but slightly slower than in 2024. See the Food Price Outlook data product for the latest forecasts.
Price Changes Also Vary by Food Category
Price dynamics among food categories can differ because of factors such as consumer demand, seasonality, domestic availability of goods, levels of processing and packaging, plant and animal disease, and weather that affects crops or animal feed. In 2024, prices grew the most for eggs (8.5 percent) as flocks continued to be affected by the HPAI outbreak. Beef and veal prices rose 5.4 percent as drought and a cyclical reduction in cattle herds tempered beef supplies. Prices declined by 1.9 percent for fish and seafood because of weaker demand and fell slightly (0.2 percent) for dairy products in 2024.
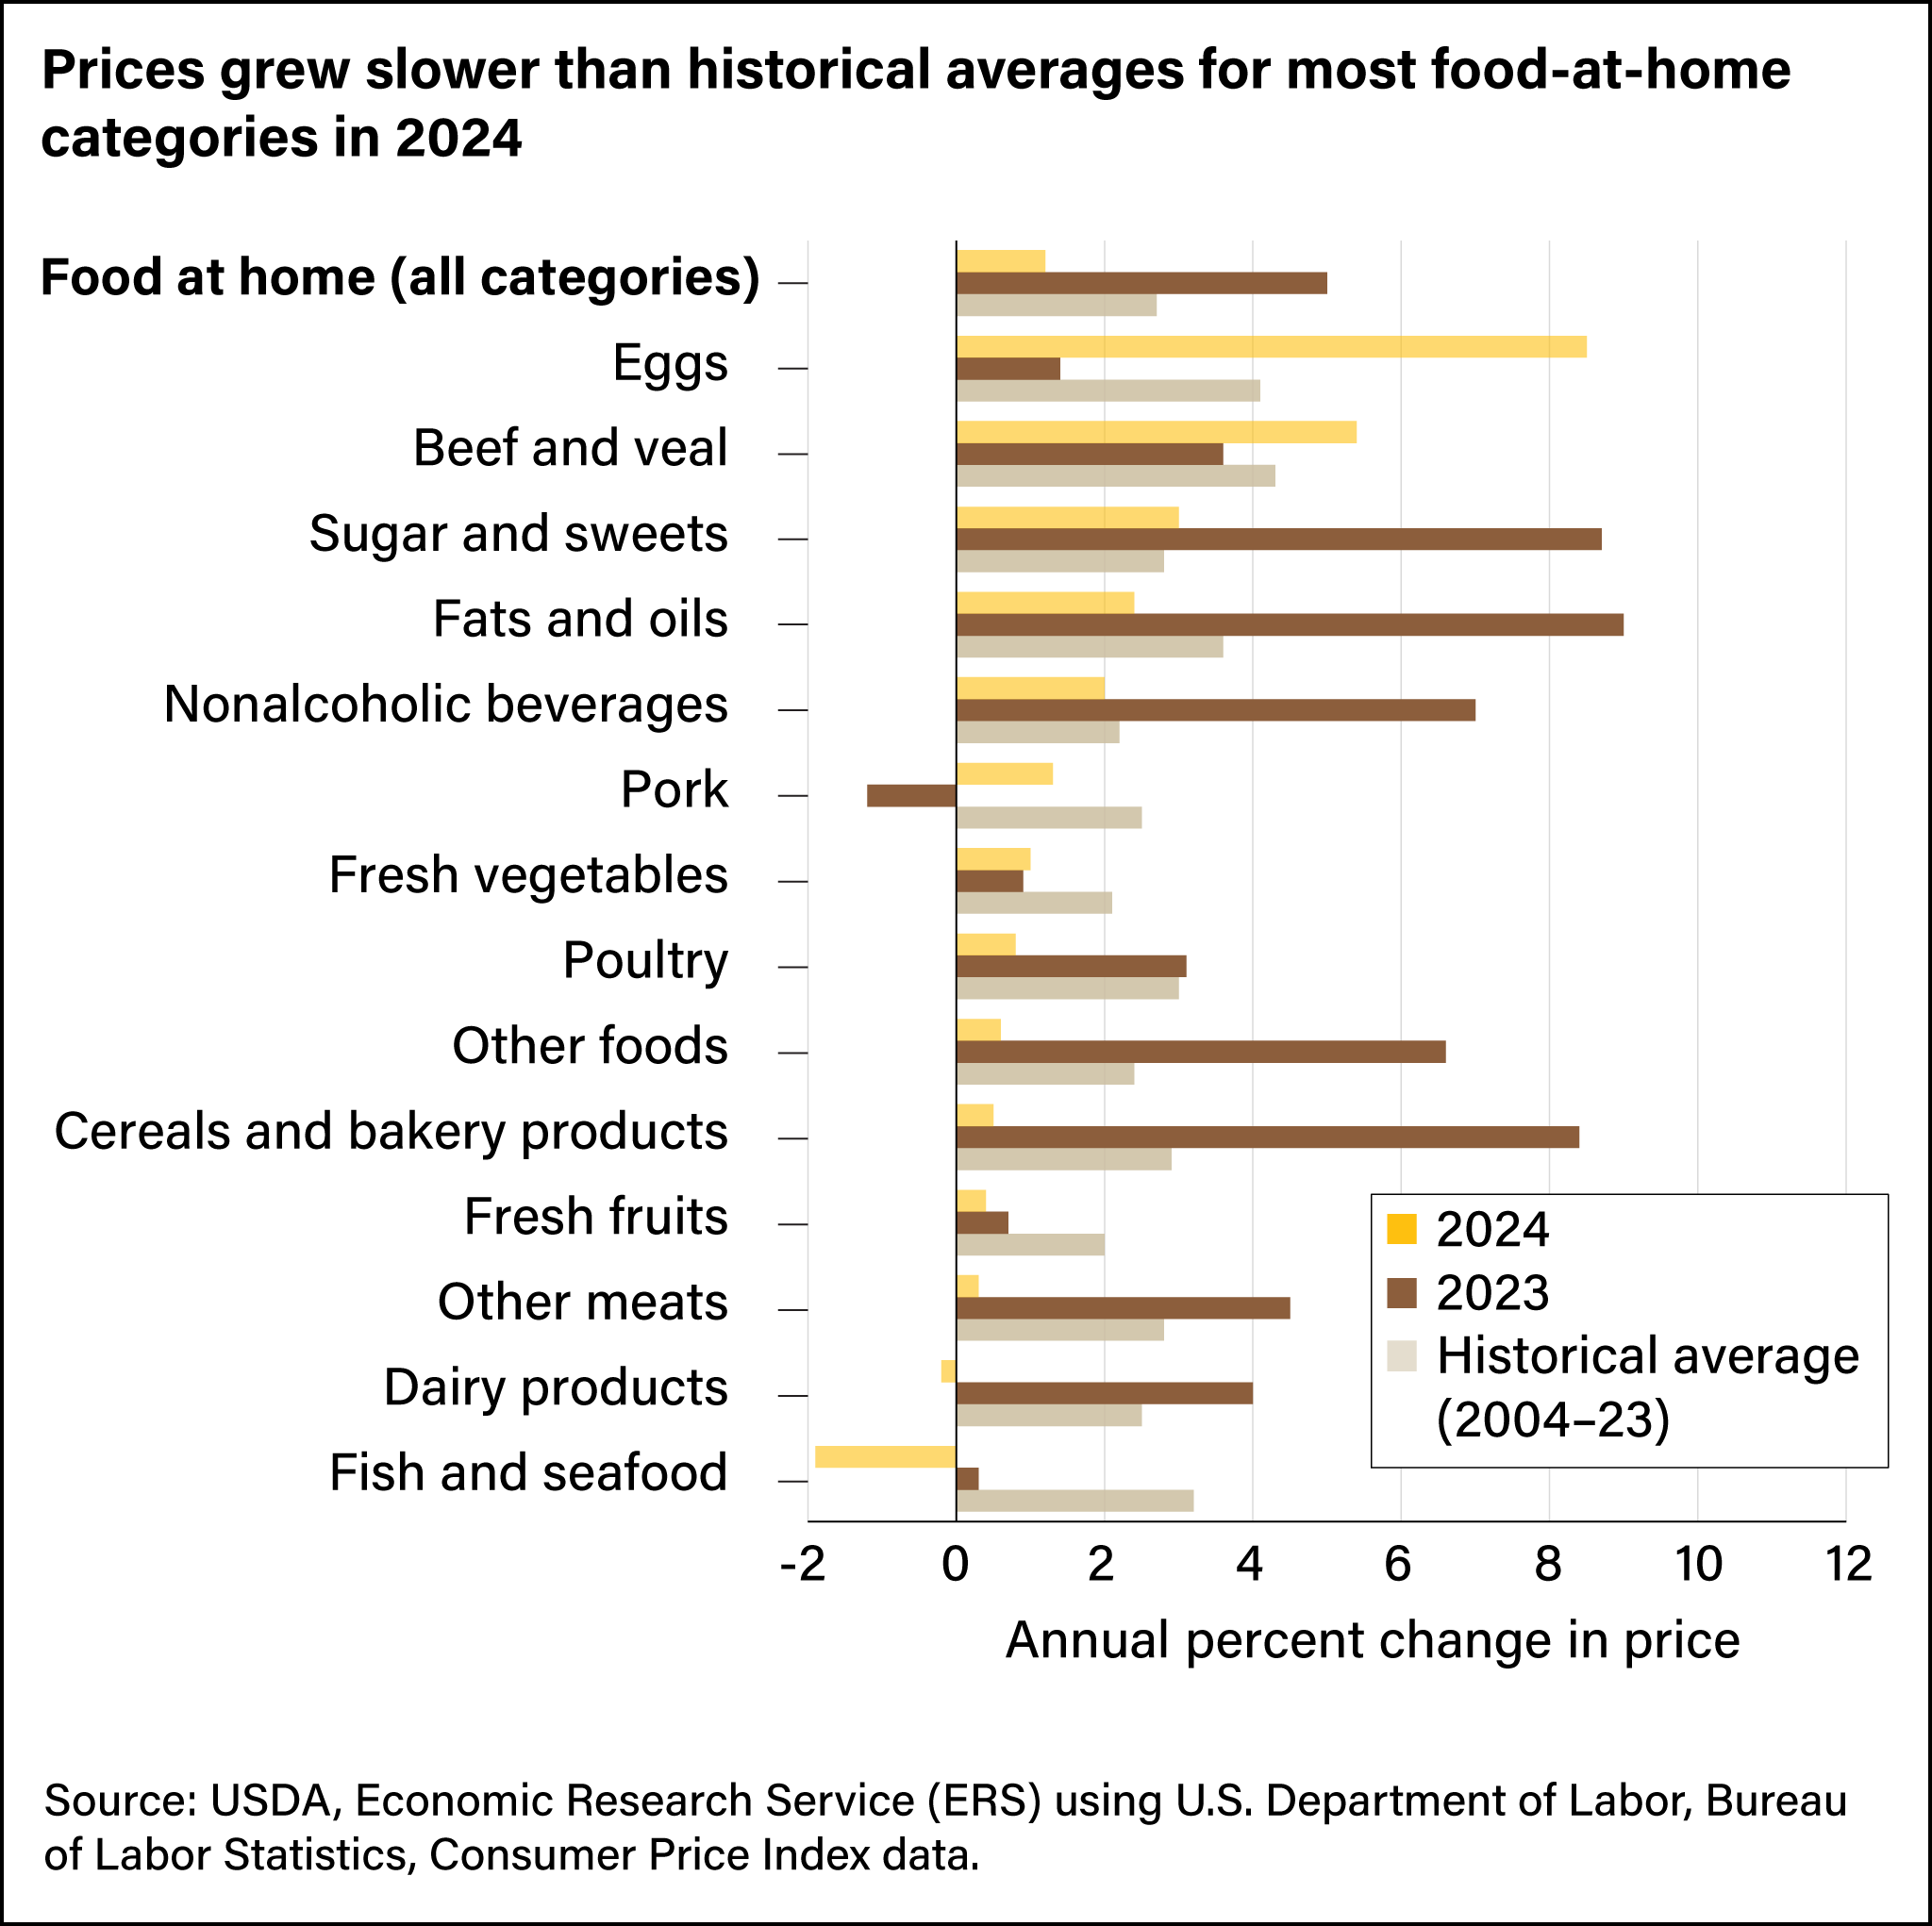
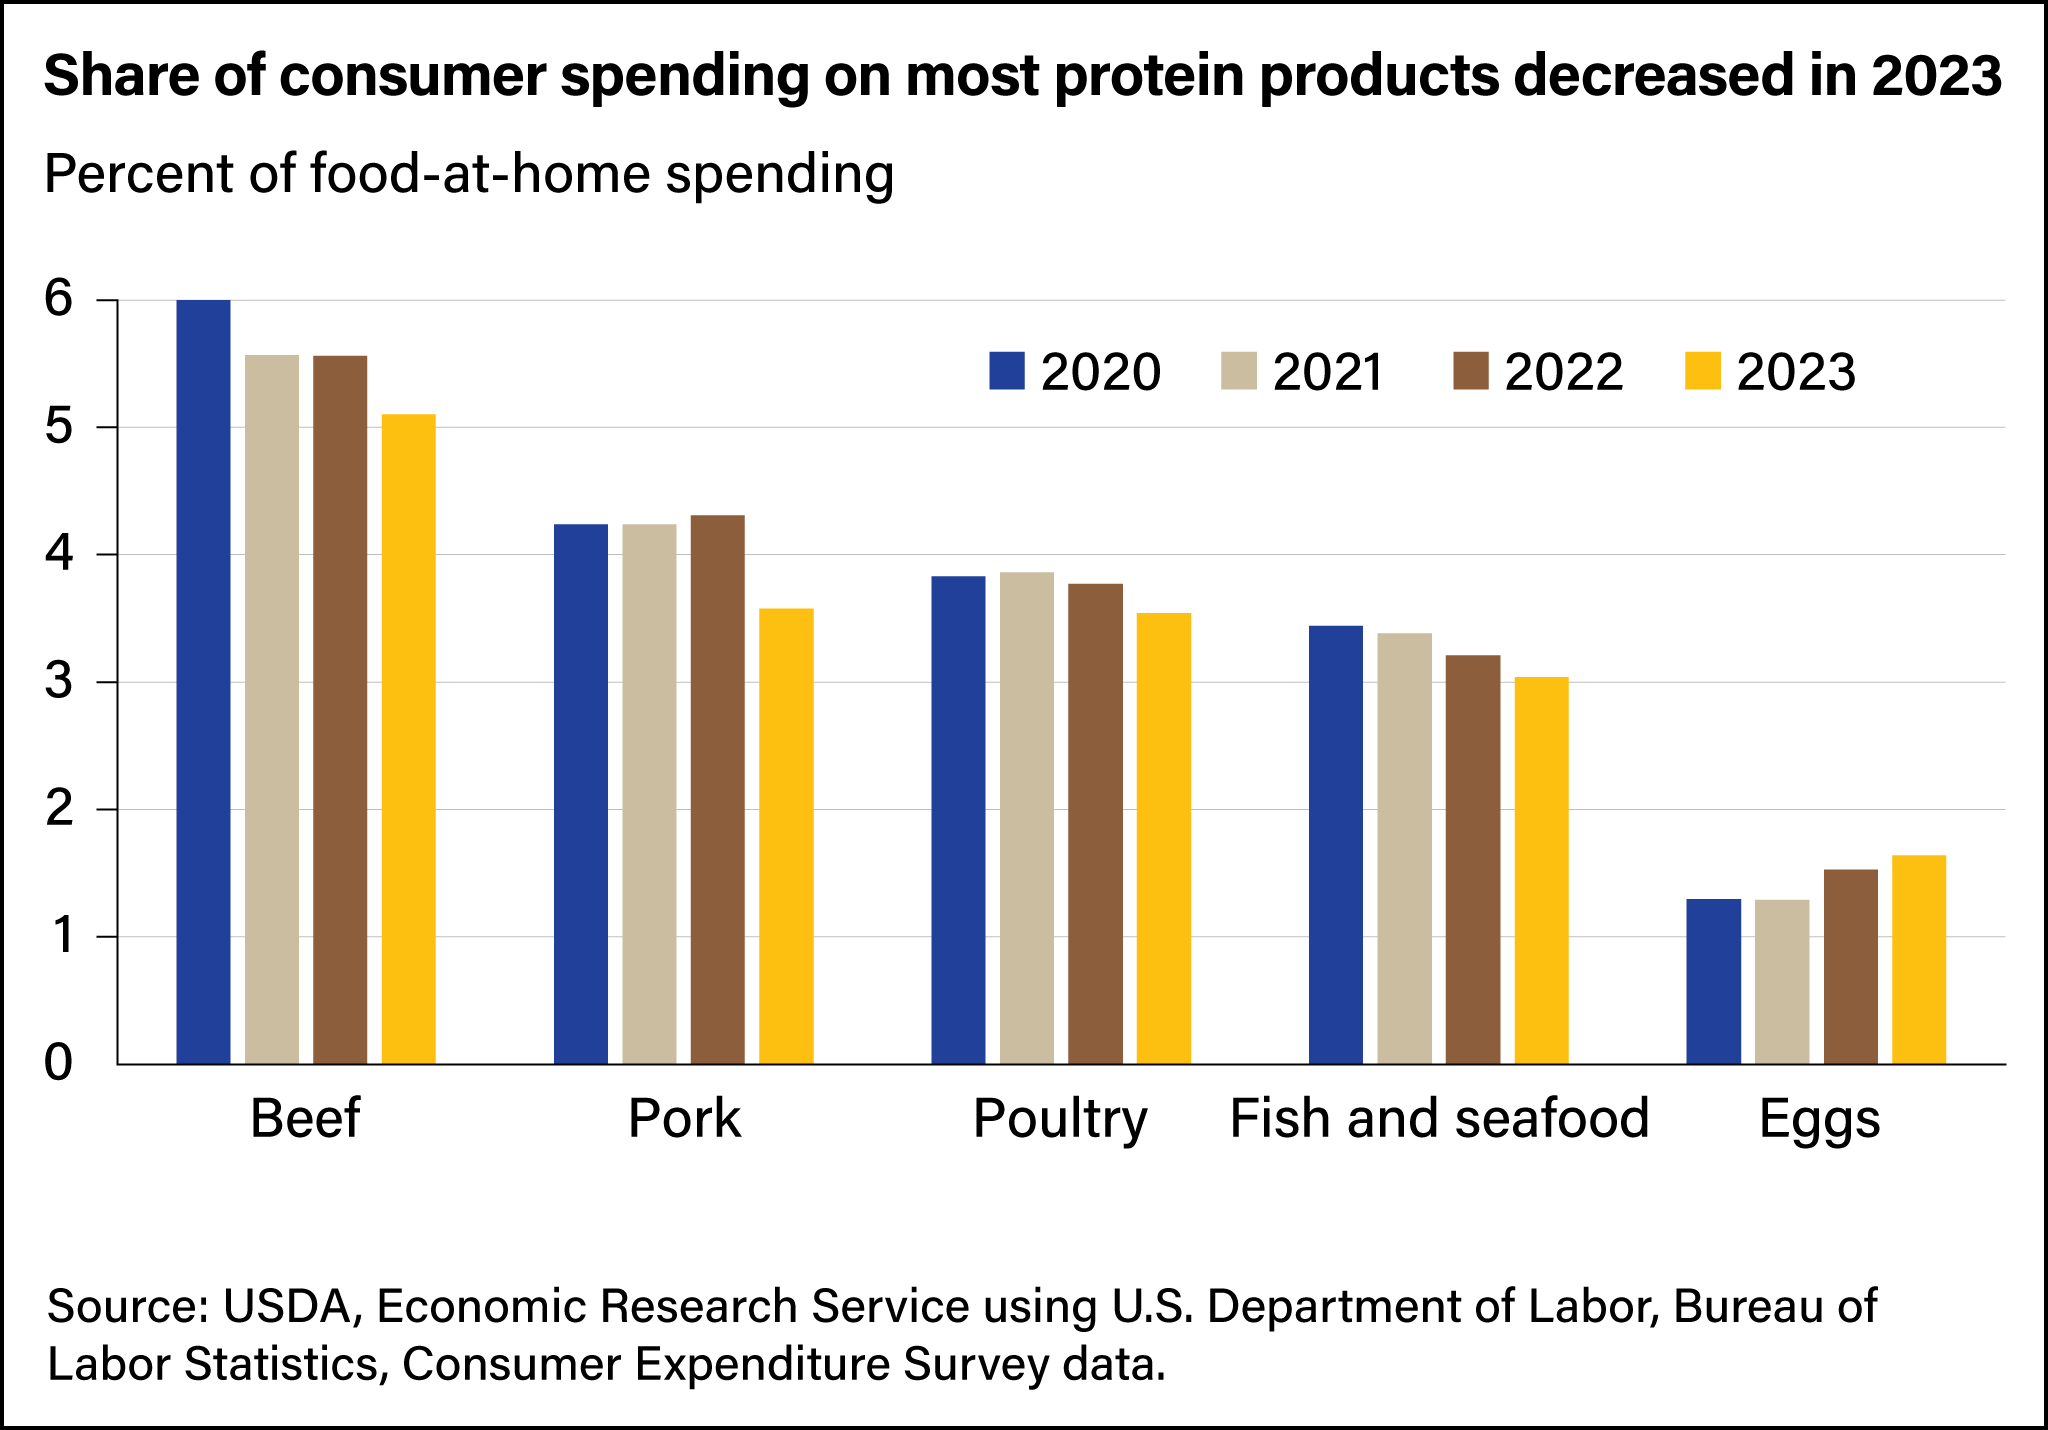
In 2024, prices for most food-at-home categories grew slower than in 2023 and below their historical average pace of growth. These cross-category trends illustrate the interconnected behaviors between price movements and macroeconomic market conditions across food categories. However, the price variability that exists among categories potentially affects consumer choices and spending. In the year following 2022’s large price increases, consumers reduced their share of food-at-home spending on most animal-based protein products except for eggs. Per gram, these products typically are among the more expensive foods, so consumers may choose less expensive substitutes in response to price increases. In contrast, consumers increased spending on cereals and bakery products and on the “other foods” category, which includes processed and prepared meals.
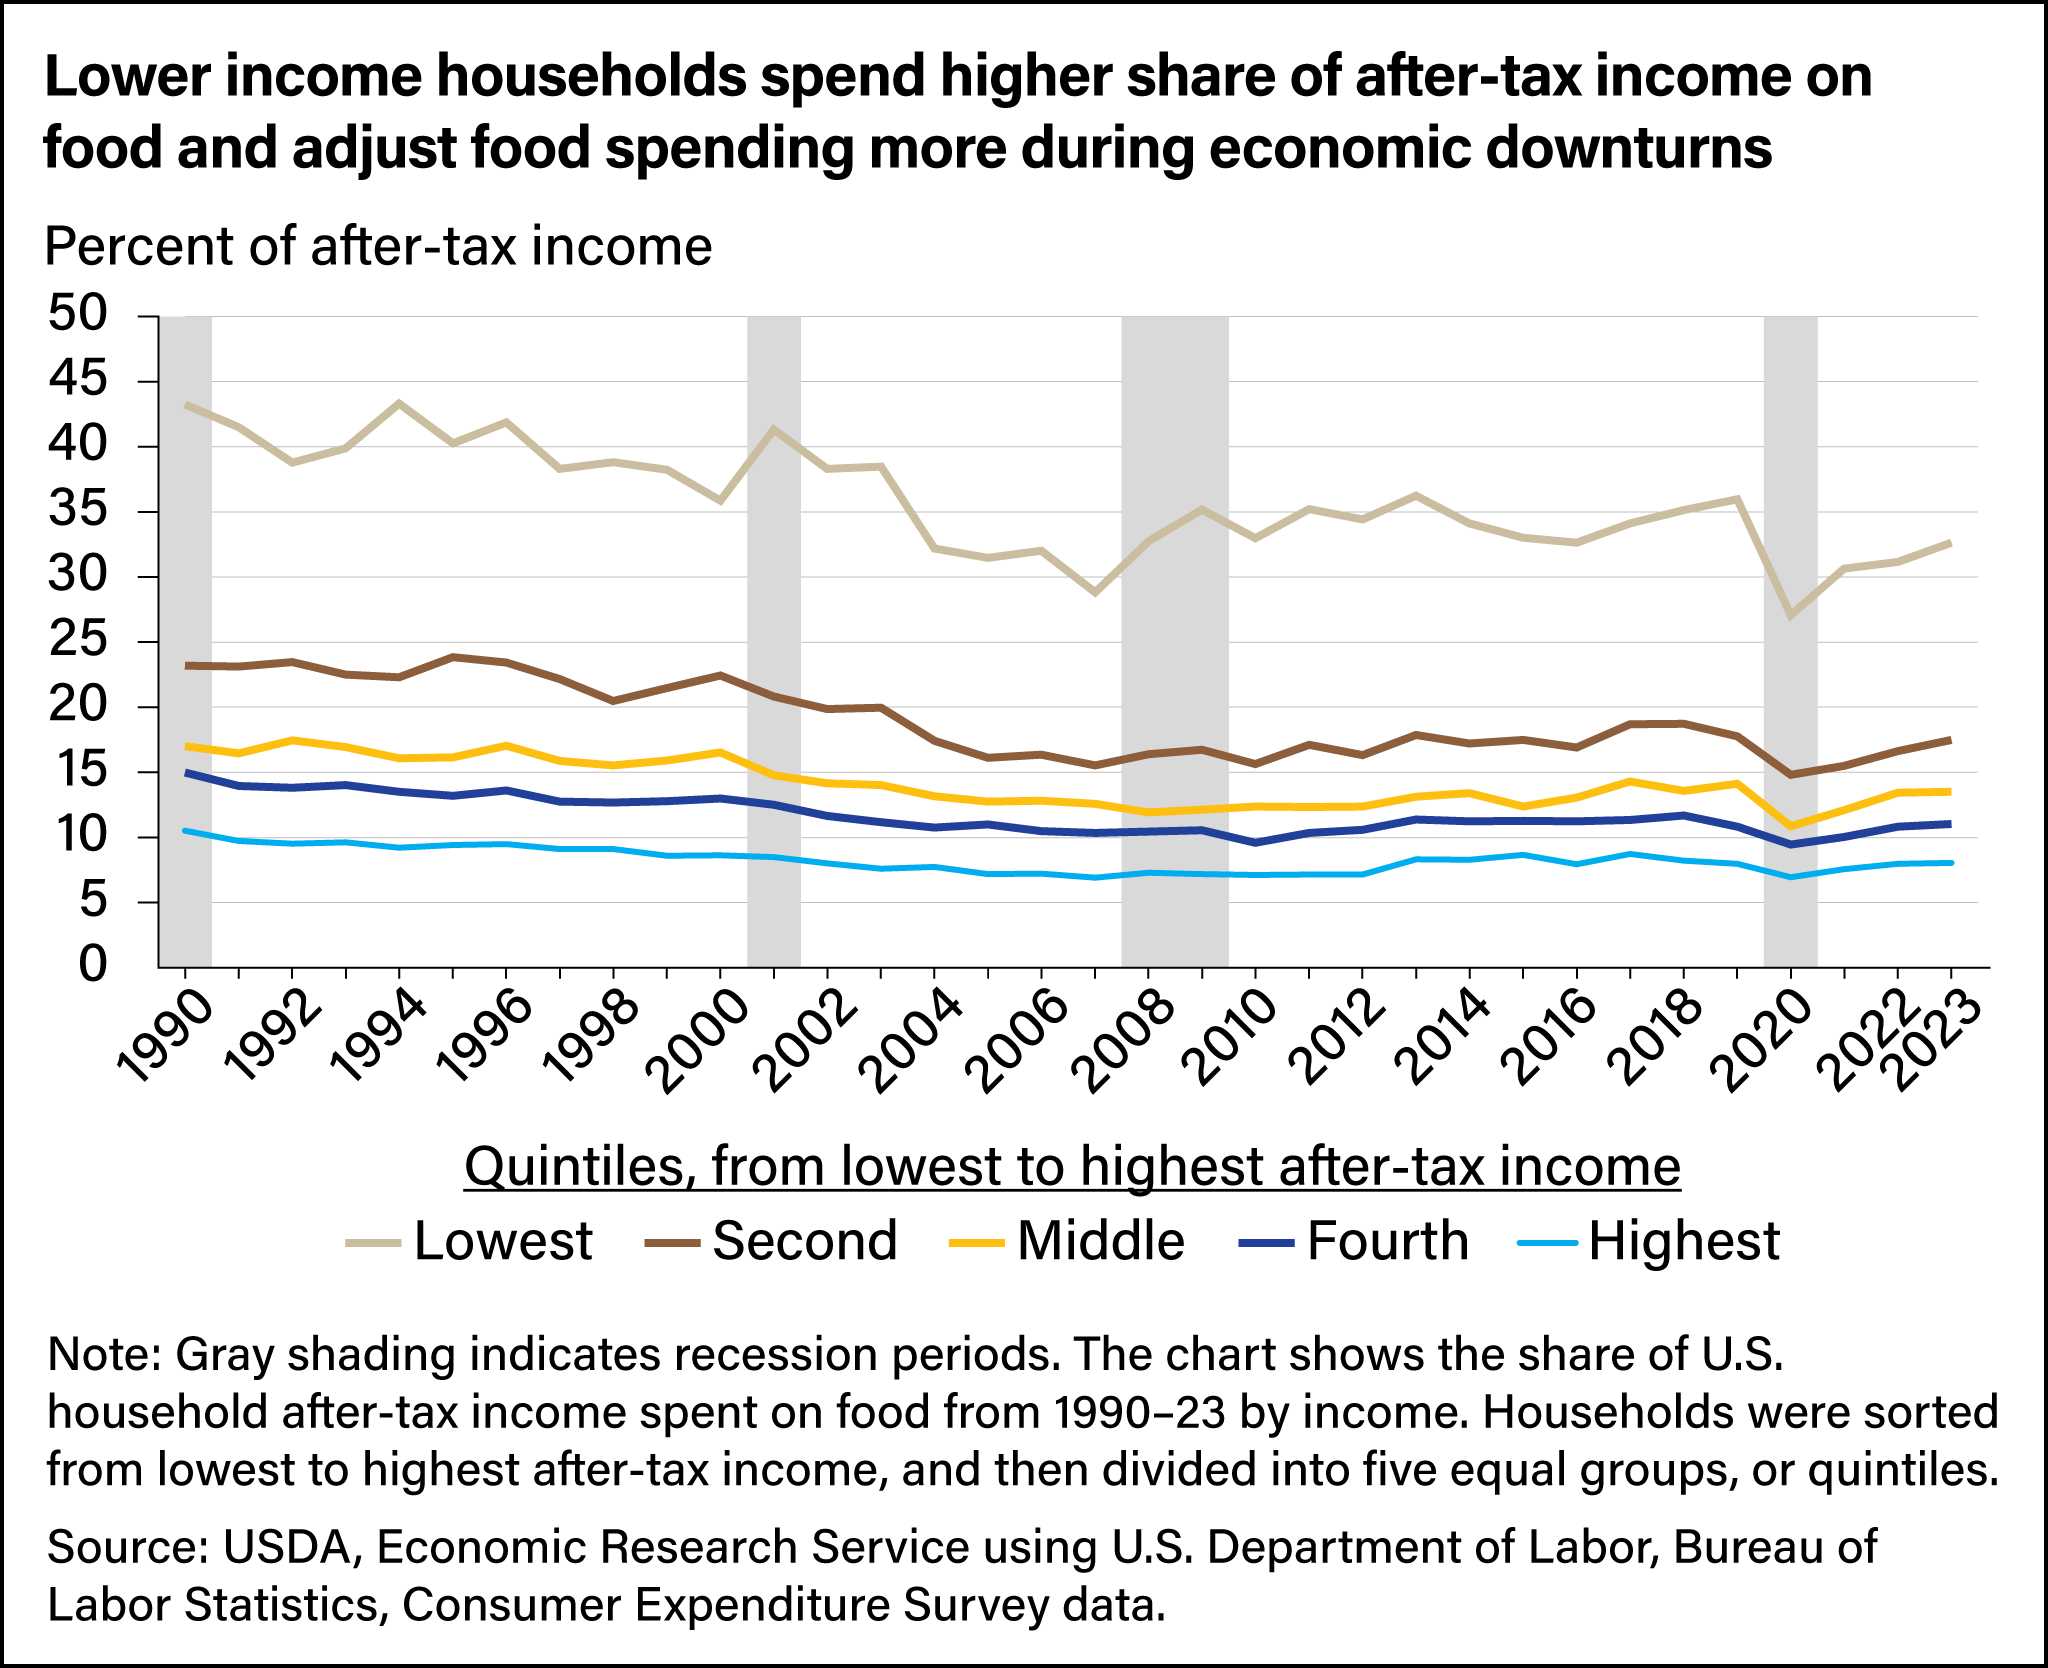
Food Is the Third Largest Component of Household Spending
In 2023, households allocated 12.9 percent of their total spending on food purchases. Food was the third highest household expenditure category behind housing (32.9 percent) and transportation (17.0 percent). Price changes for essential spending categories such as food and housing may affect some households more than others. For example, households with lower incomes spend a higher share of their total expenditures on food. In 2023, food costs ranged from 32.6 percent of after-tax income for households in the lowest income quintile (less than $16,171 a year) to 8.1 percent for the highest income quintile (greater than $211,042 a year). Therefore, price increases could affect lower income households more acutely. This was evident during economic downturns such as the 2008 financial crisis and the COVID-19 pandemic, when the share of spending on food by the highest income quintile of households experienced less disruption than by those in the lowest income quintile.
This article is drawn from:
- Food Price Outlook. (n.d.). U.S. Department of Agriculture, Economic Research Service.
You may also like:
- Zeballos , E., Rivera-Cintron, D. & Sinclair, W. (2024, October 8). U.S. Consumers Increased Spending on Food Away From Home in 2023, Driving Overall Food Spending Growth. Amber Waves, U.S. Department of Agriculture, Economic Research Service.
- Sweitzer, M. & Byrne, A.T. (2024, September 11). Using Food-at-Home Monthly Area Prices Data To Track Food Prices Over Time and Across Areas . Amber Waves, U.S. Department of Agriculture, Economic Research Service.
- Sweitzer, M., MacLachlan, M., Sinclair, W., Stevens, A., Stewart, H., Zachary, J.C. & Zeballos , E. (2023, July 10). ERS Data Products Show Food-At-Home Price Inflation From Producers to Consumers. Amber Waves, U.S. Department of Agriculture, Economic Research Service.
- Chelius, C. & MacLachlan, M. (2021, March 1). Retail Food Price Inflation in 2020 Outpaced Historical Average by 75 Percent. Amber Waves, U.S. Department of Agriculture, Economic Research Service.