
SNAP households spend less on food than eligible nonparticipants, after adjusting for household size and composition
- by Laura Tiehen
- 8/17/2017
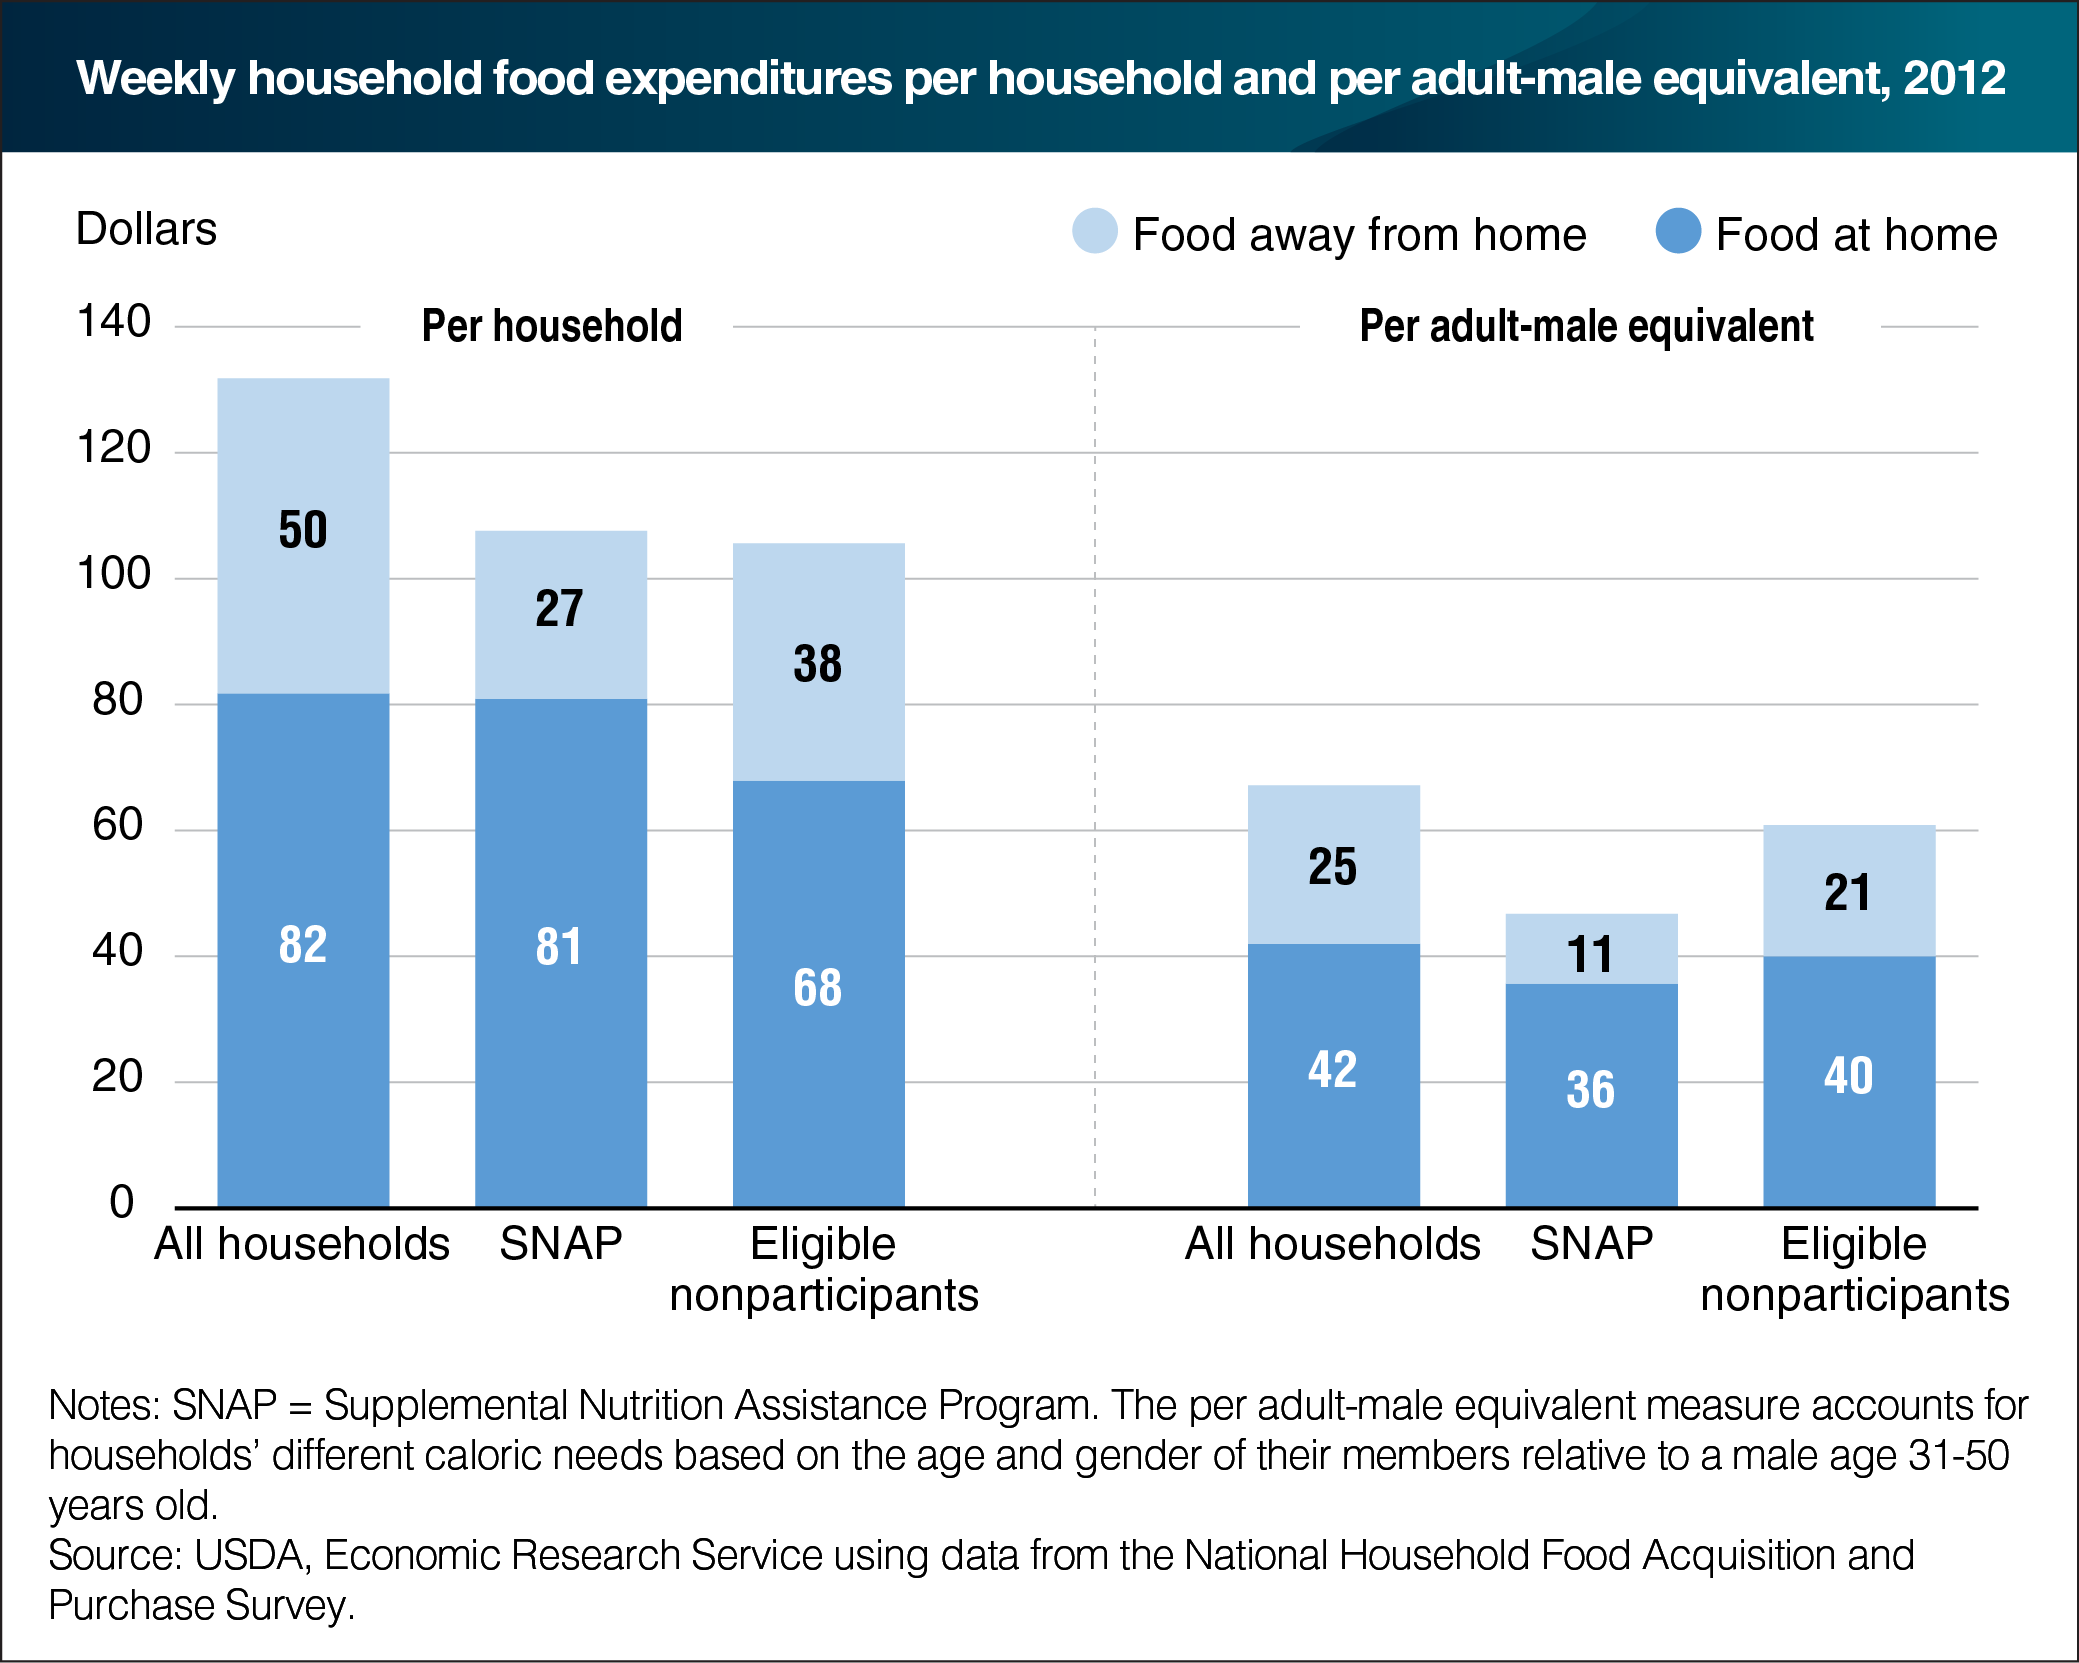
USDA’s Supplemental Nutrition Assistance Program (SNAP) is designed to increase the food purchasing power of low-income households. In fiscal 2016, the program provided participating households with monthly benefits averaging $255—about $59 a week—to purchase food at authorized foodstores. Analysis of USDA’s National Household Food Acquisition and Purchase Survey (FoodAPS) data revealed that the average SNAP household spent $108 per week on food in 2012, below the $132 average U.S. weekly food spending and similar to the $106 spent on food by eligible nonparticipants. SNAP households, however, are larger and contain more children and fewer elderly members than eligible nonparticipating households. ERS researchers adjusted for household size and composition by converting household weekly food spending into adult-male equivalents—essentially a per person measure that accounts for differing caloric needs based on age and gender. On an adult-male equivalent basis, weekly food spending by SNAP households was $47 compared with the $61 spent by those who are eligible for SNAP but chose not to participate. SNAP households spent less on both food from grocery stores and from eating out places than all U.S. households and eligible nonparticipants. The data for this chart come from the ERS report, Food Spending Patterns of Households Participating in the Supplemental Nutrition Assistance Program: Findings from USDA’s FoodAPS, released on August 16, 2017.
We’d welcome your feedback!
Would you be willing to answer a few quick questions about your experience?