
Editor's Pick 2016: Three post-farm industry groups account for about 61 cents of the U.S. food dollar
- by Patrick Canning
- 12/23/2016
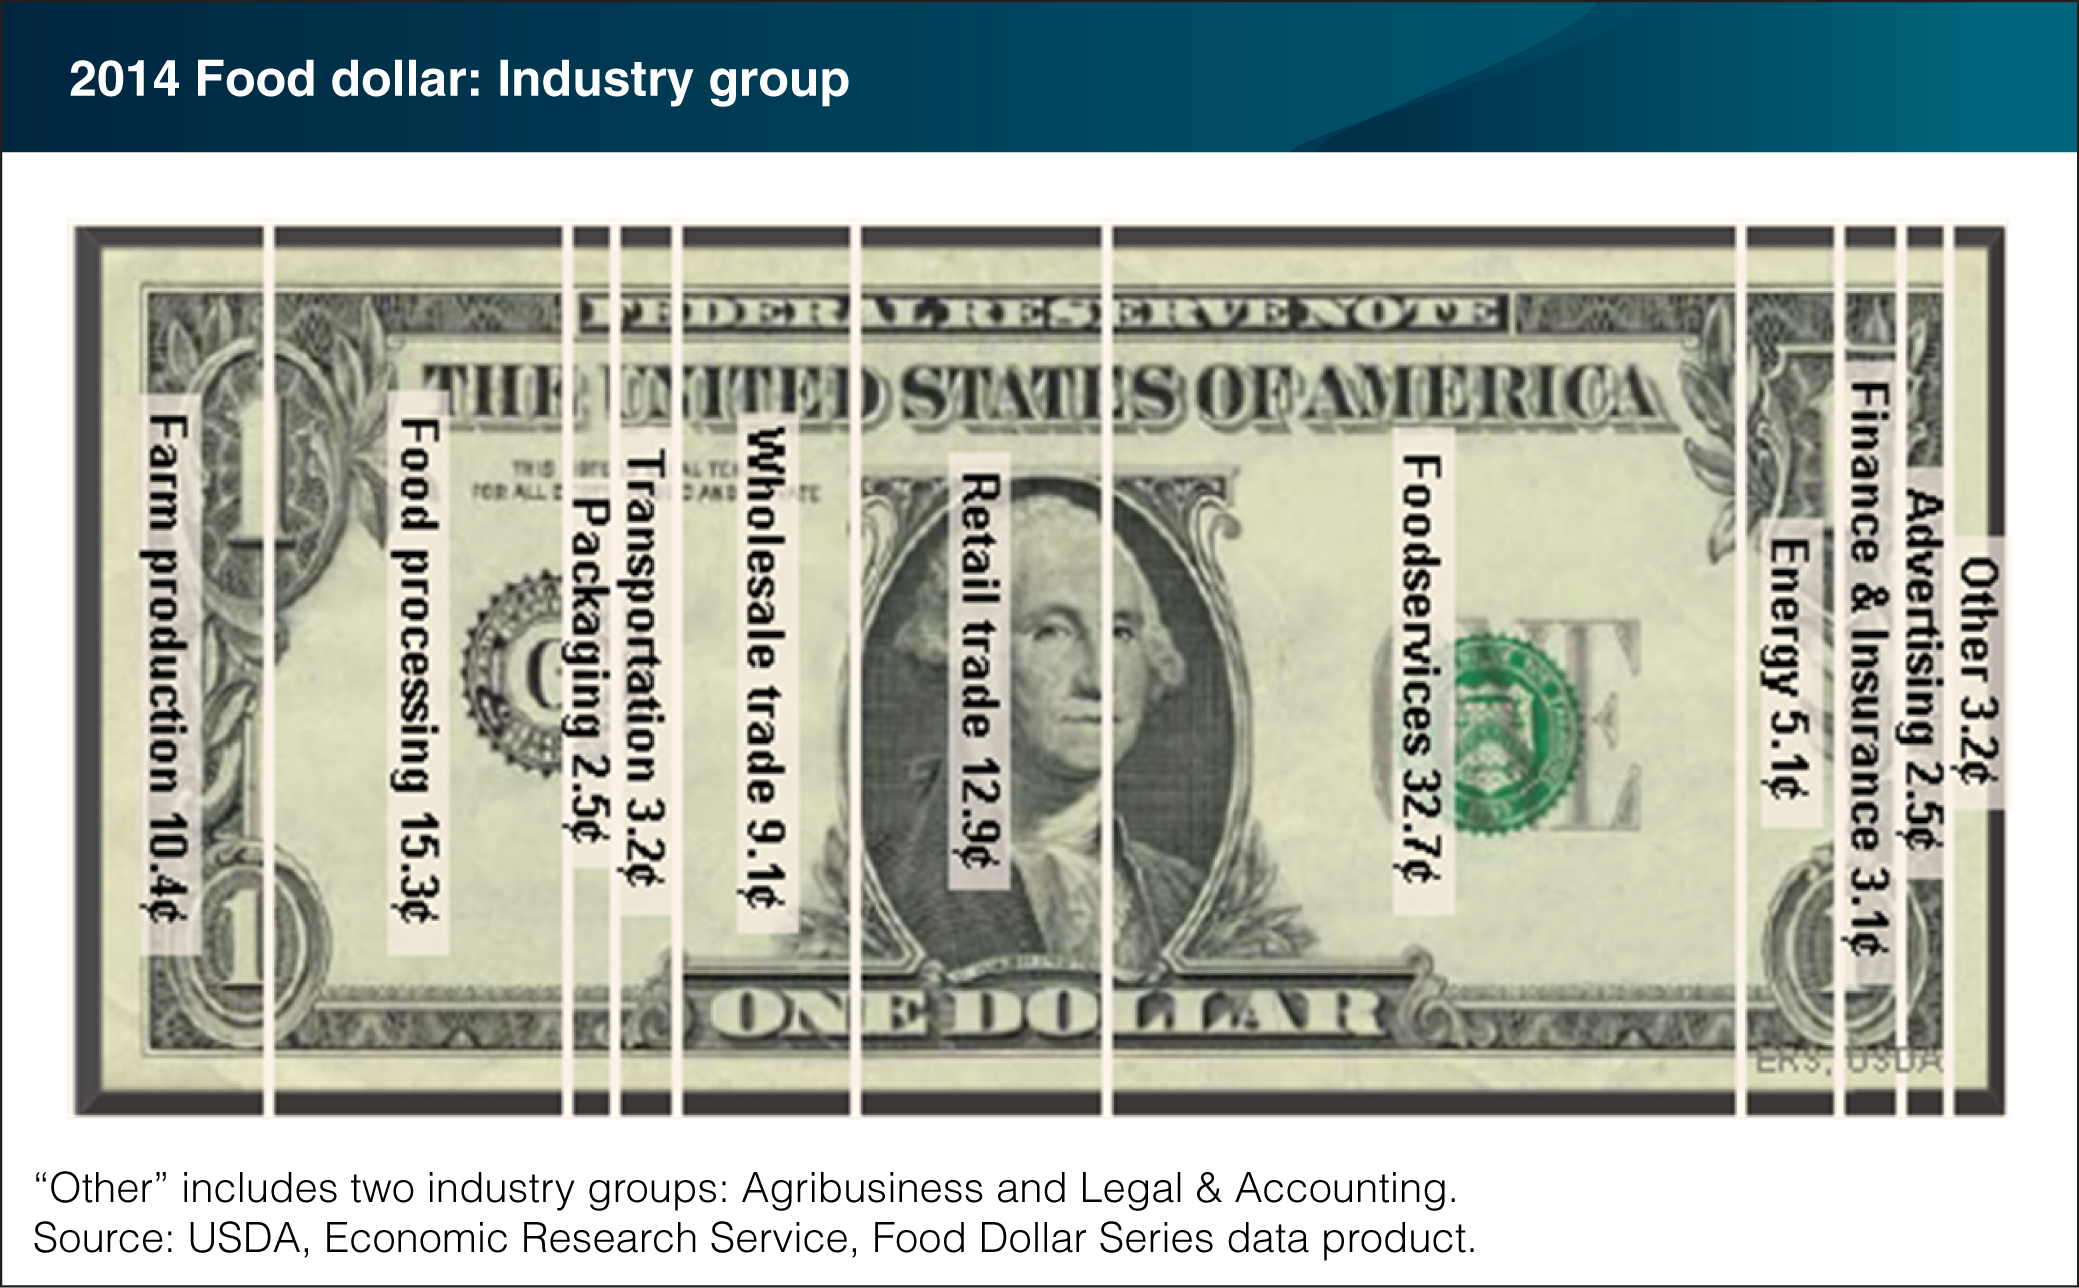
In 2014, total food-away-from-home expenditures of U.S. consumers, businesses, and government entities surpassed at-home food sales for the first time. This outcome is reflected in the 32.7-cent foodservices share of the U.S. food dollar claimed by restaurants and other eating-out places—its highest level during 1993 to 2014. It is also reflected in the 12.9-cent retail-trade share claimed by grocery stores and other food retailers, which is at its lowest level since 2002. ERS uses input-output analysis to calculate the value added, or cost contributions, from 12 industry groups in the food supply chain. Annual shifts in food dollar shares between industry groups occur for a variety of reasons, ranging from the mix of foods that consumers purchase to relative input costs. A growing share of the food dollar has gone to farm producers, up 1.7 cents since 2009 to 10.4 cents in 2014, while food processing’s share is down 2.1 cents since 2009. This chart is available for years 1993 to 2014 and can be found in ERS’s Food Dollar Series data product, updated on March 30, 2016.