
Average quarterly prices of specific limited-service meals and entrees in the census regions, 1998-2012
- by Aylin Kumcu and Abigail Okrent
- 5/21/2014
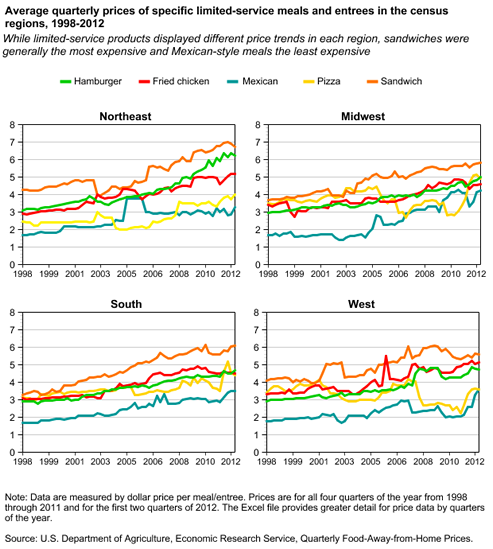
Line chart showing average quarterly prices of specific limited-service meals in the census regions, 1998-2012