
Average quarterly prices of limited-service meals by census region, 1998-2012
- by Aylin Kumcu and Abigail Okrent
- 5/21/2014
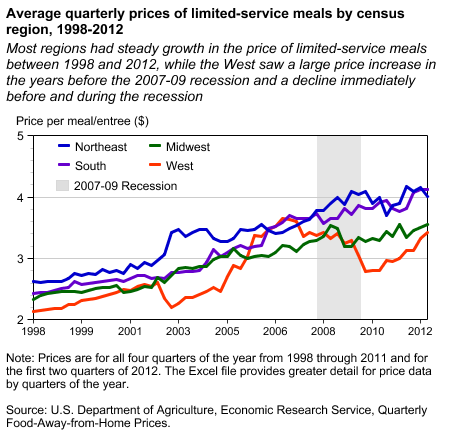
Line chart showing average quarterly prices of full-service meals by census region, 1998-2012
Official websites use .gov
A .gov website belongs to an official government organization in the United States.
Secure .gov websites use HTTPS
A lock (
) or https:// means you’ve safely connected to the .gov website. Share sensitive information only on official, secure websites.
Line chart showing average quarterly prices of full-service meals by census region, 1998-2012