
Percentage of the U.S. population age 15 and older who engaged in primary eating and drinking and secondary eating, by time of day, on an average day in 2023
- by Brandon J. Restrepo and Eliana Zeballos
- 10/31/2024
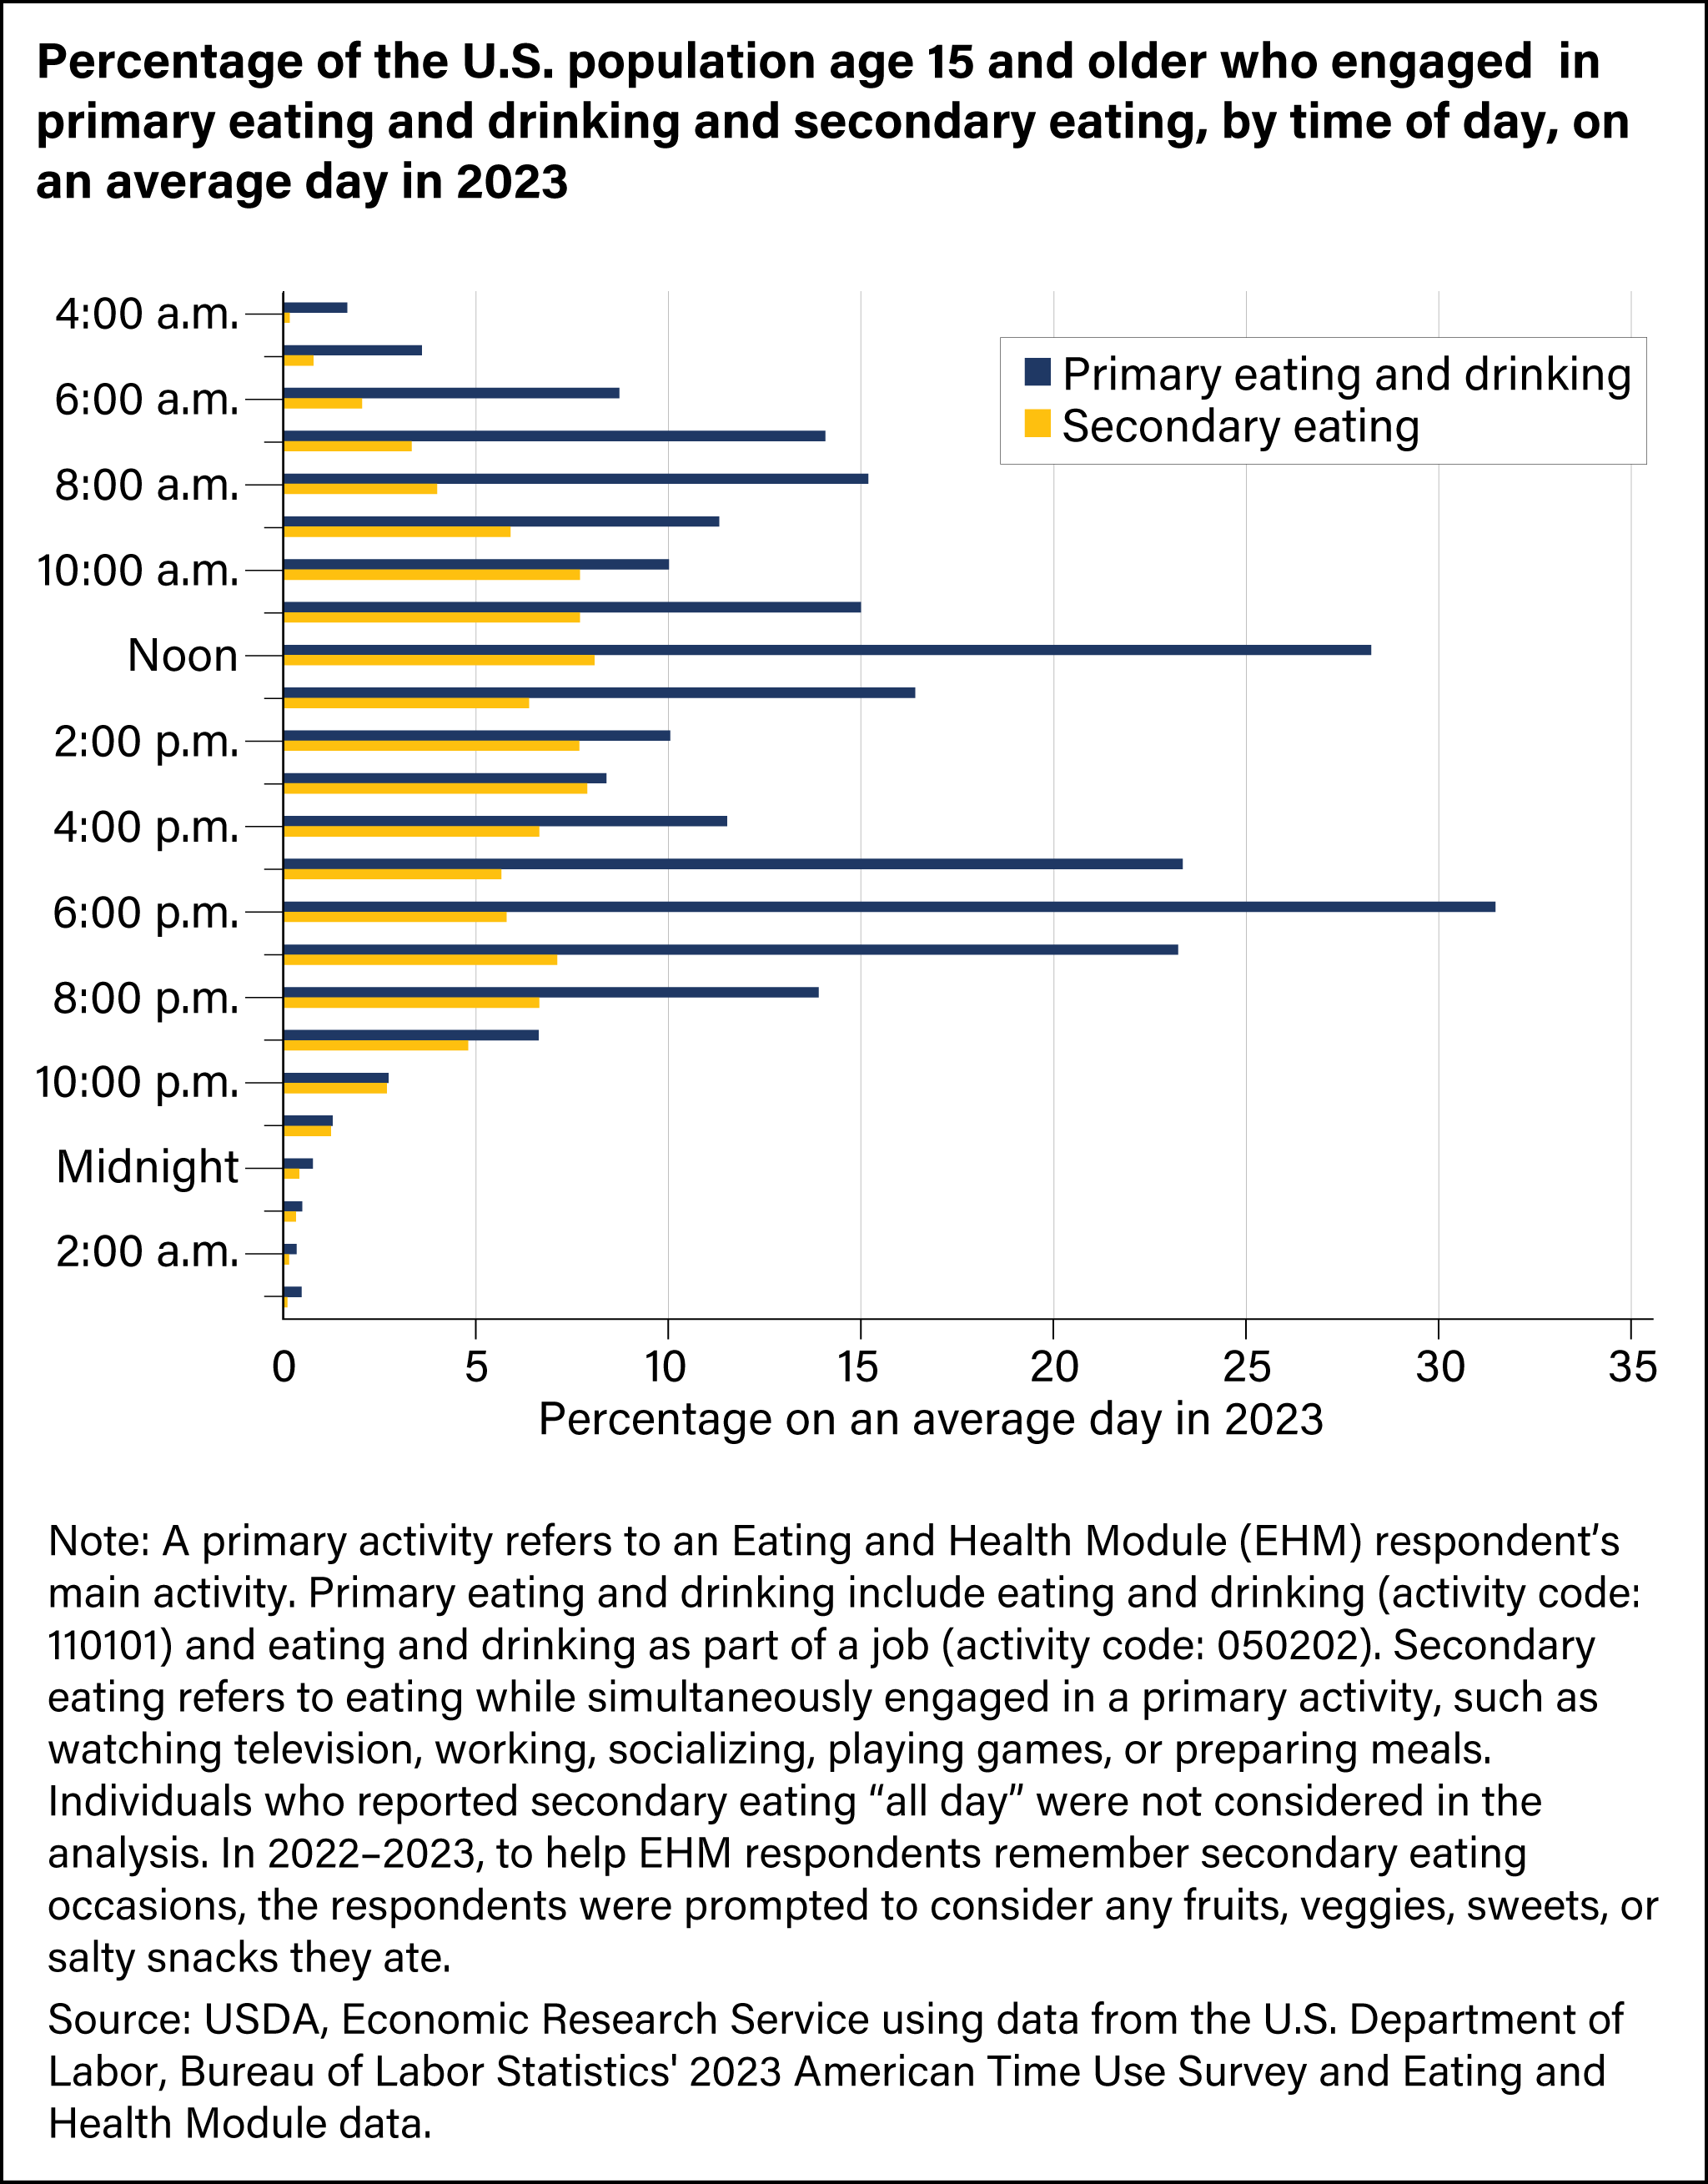
Percentage of the U.S. population age 15 and older who engaged in primary eating and drinking and secondary eating, by time of day, on an average day in 2023