
Child food insufficiency continues to vary widely across racial and ethnic groups
- by Laura J. Hales and Matthew P. Rabbitt
- 4/6/2023
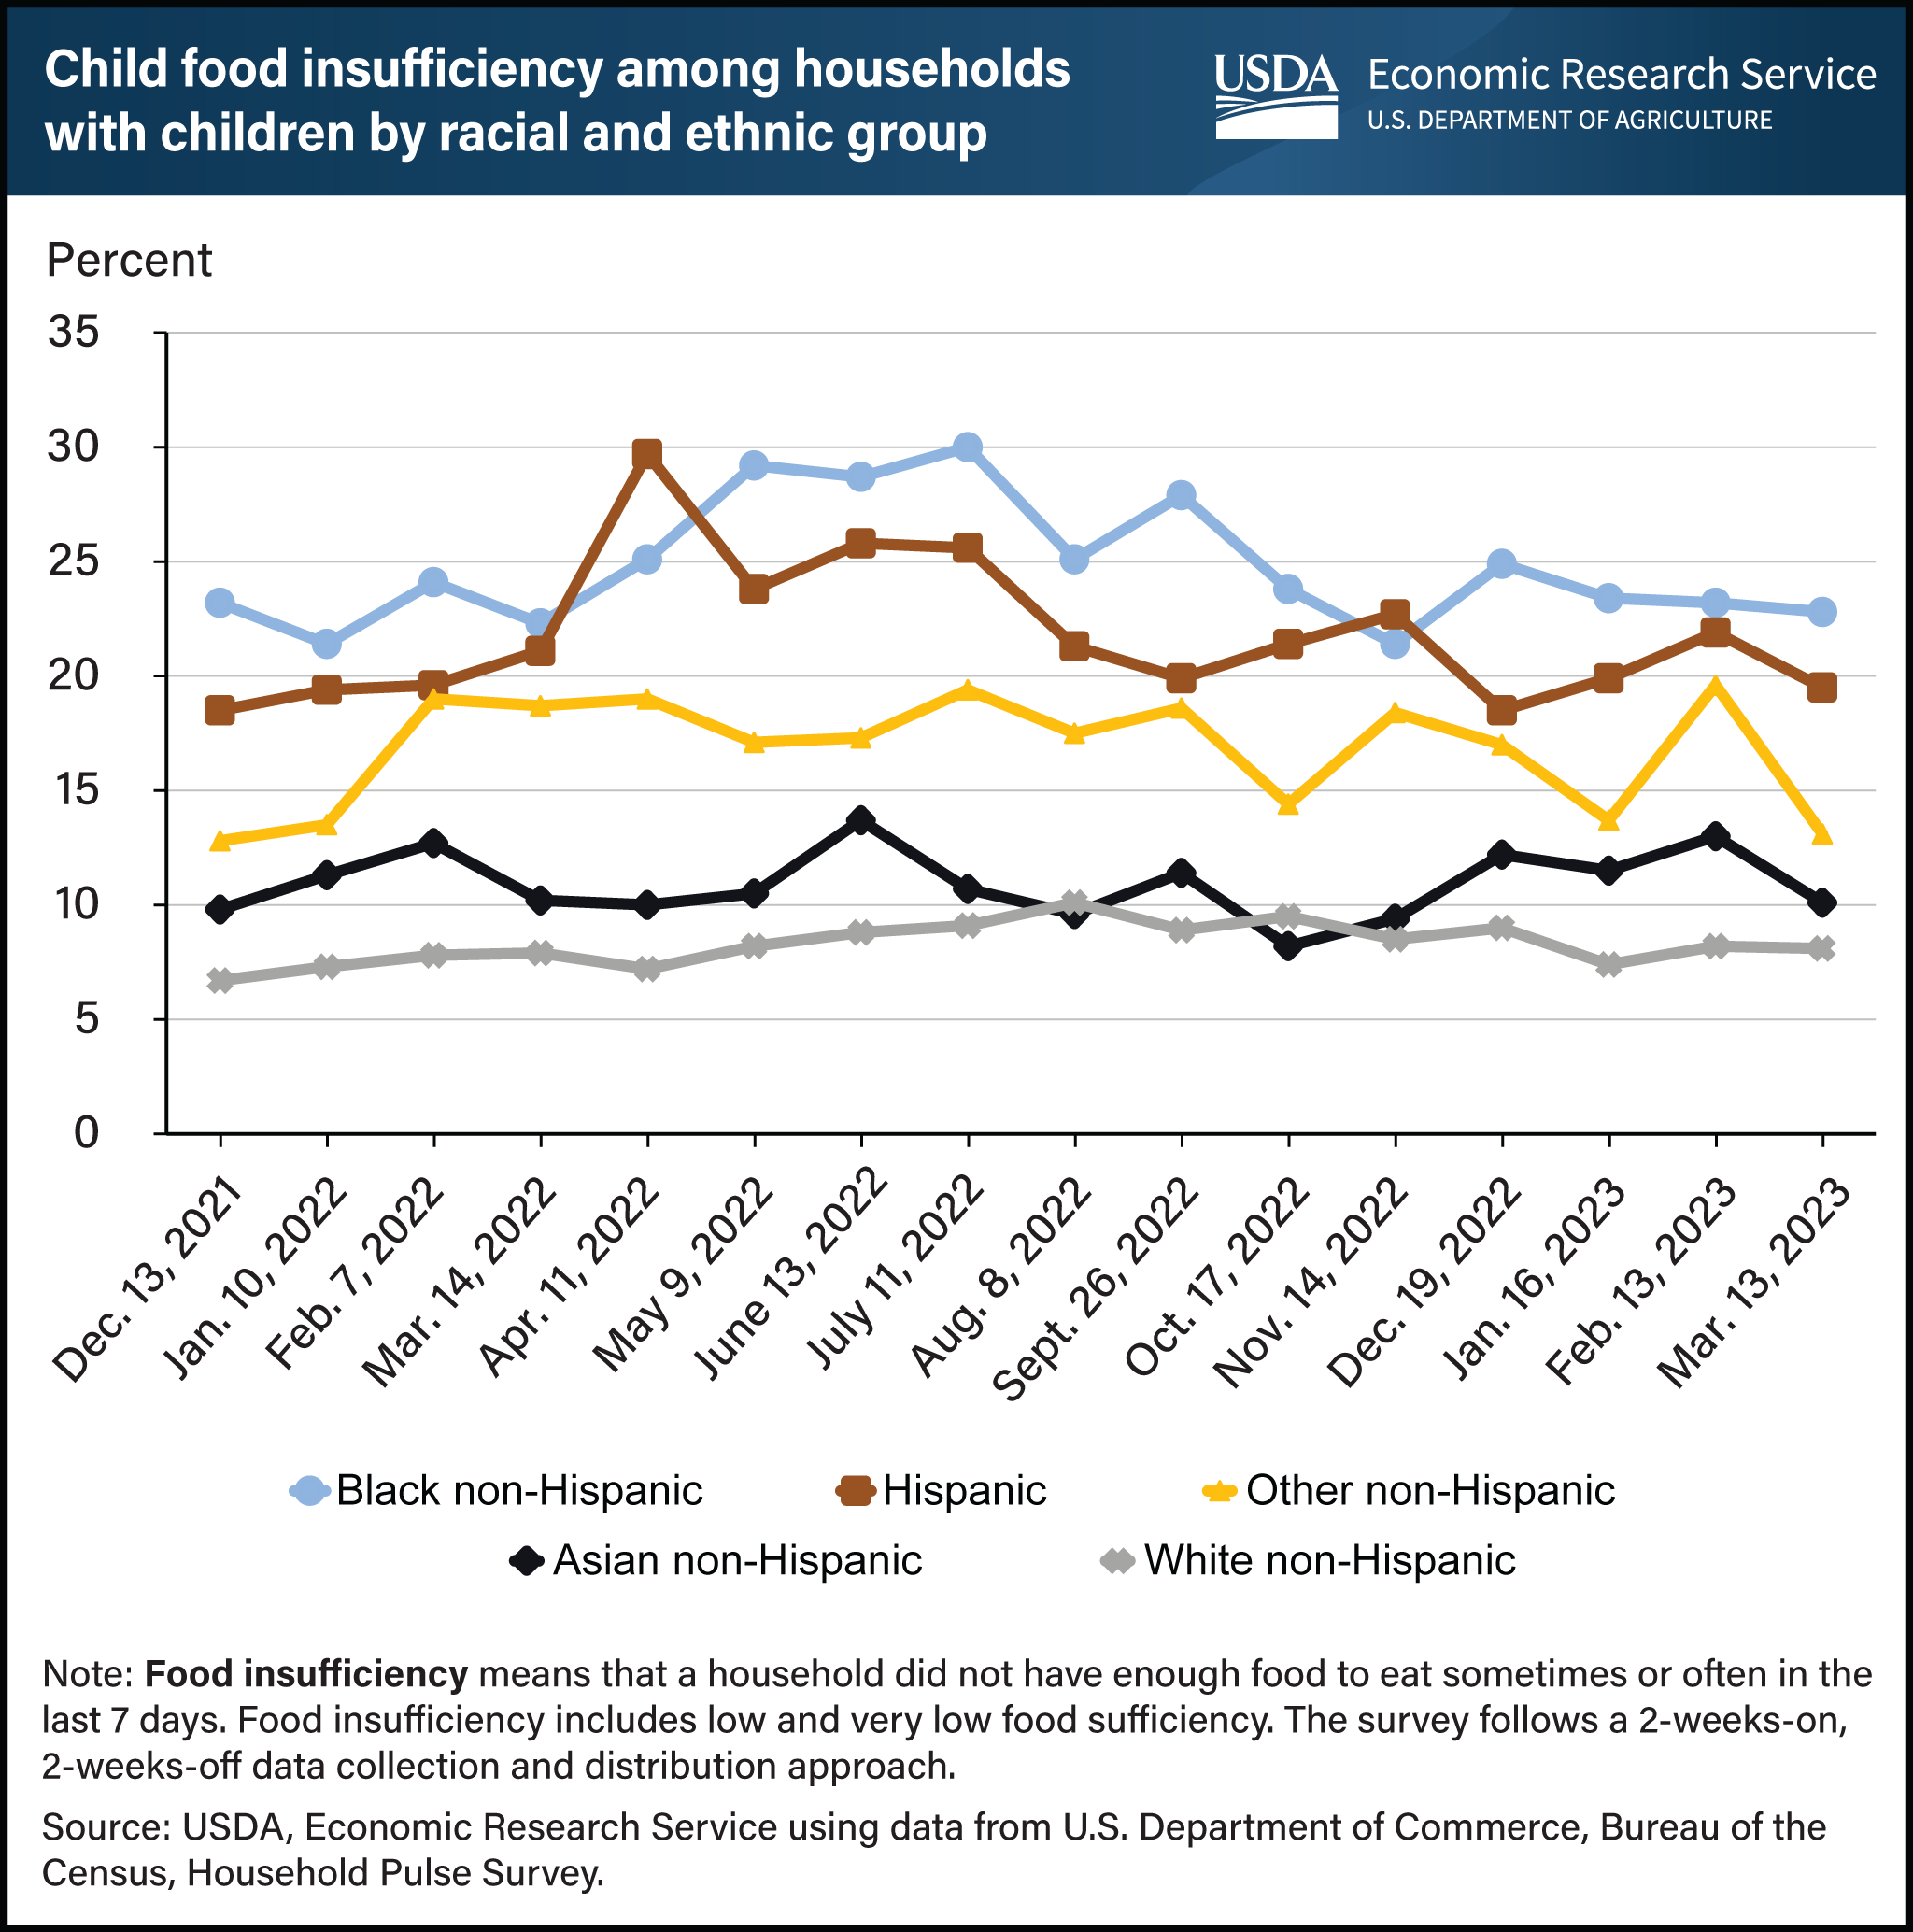
In March 2023, 22.8 percent of Black non-Hispanic households reported that their children sometimes or often did not have enough to eat during the past week. Additionally, 19.5 percent of Hispanic households, 13.1 percent of Other non-Hispanic, 10.1 percent of Asian non-Hispanic, and 8.1 percent of White non-Hispanic households reported child food insufficiency. The Household Pulse Survey, which provides these food insufficiency estimates, was developed through a partnership with the U.S. Census Bureau to produce timely information on the economic and social effects of the Coronavirus (COVID-19) pandemic on U.S. households. Households were classified as having child food insufficiency if the adult survey respondent said children in the household were not eating enough “sometimes” or “often” in the last 7 days because the household could not afford enough food. The prevalence of child food insufficiency for Hispanic households with children peaked in April 2022 at 29.7 percent, while Black non-Hispanic households with children experienced similarly high rates in May (29.2 percent), June (28.7 percent), and July (30.0 percent) of 2022. In contrast, White non-Hispanic households with children experienced a high of just more than 10 percent in August 2022, and Asian households with children reached a high of 13.7 percent in June 2022. The prevalence of child food insufficiency for Other non-Hispanic households with children has fluctuated between these two groups during the same time period. While the prevalence of child food insufficiency for some groups declined from peak levels by March 2023, it continues to affect certain groups more than others. For more information on the USDA, Economic Research Service’s food security research and comparisons of food insecurity and food insufficiency measurements, see the Food Security in the U.S. topic page on the website. This chart appears on the Food Sufficiency During the Pandemic trending topics page.