
Crops production grew faster than livestock and animal products production from 1948 to 2019
- by Sun Ling Wang
- 3/7/2023
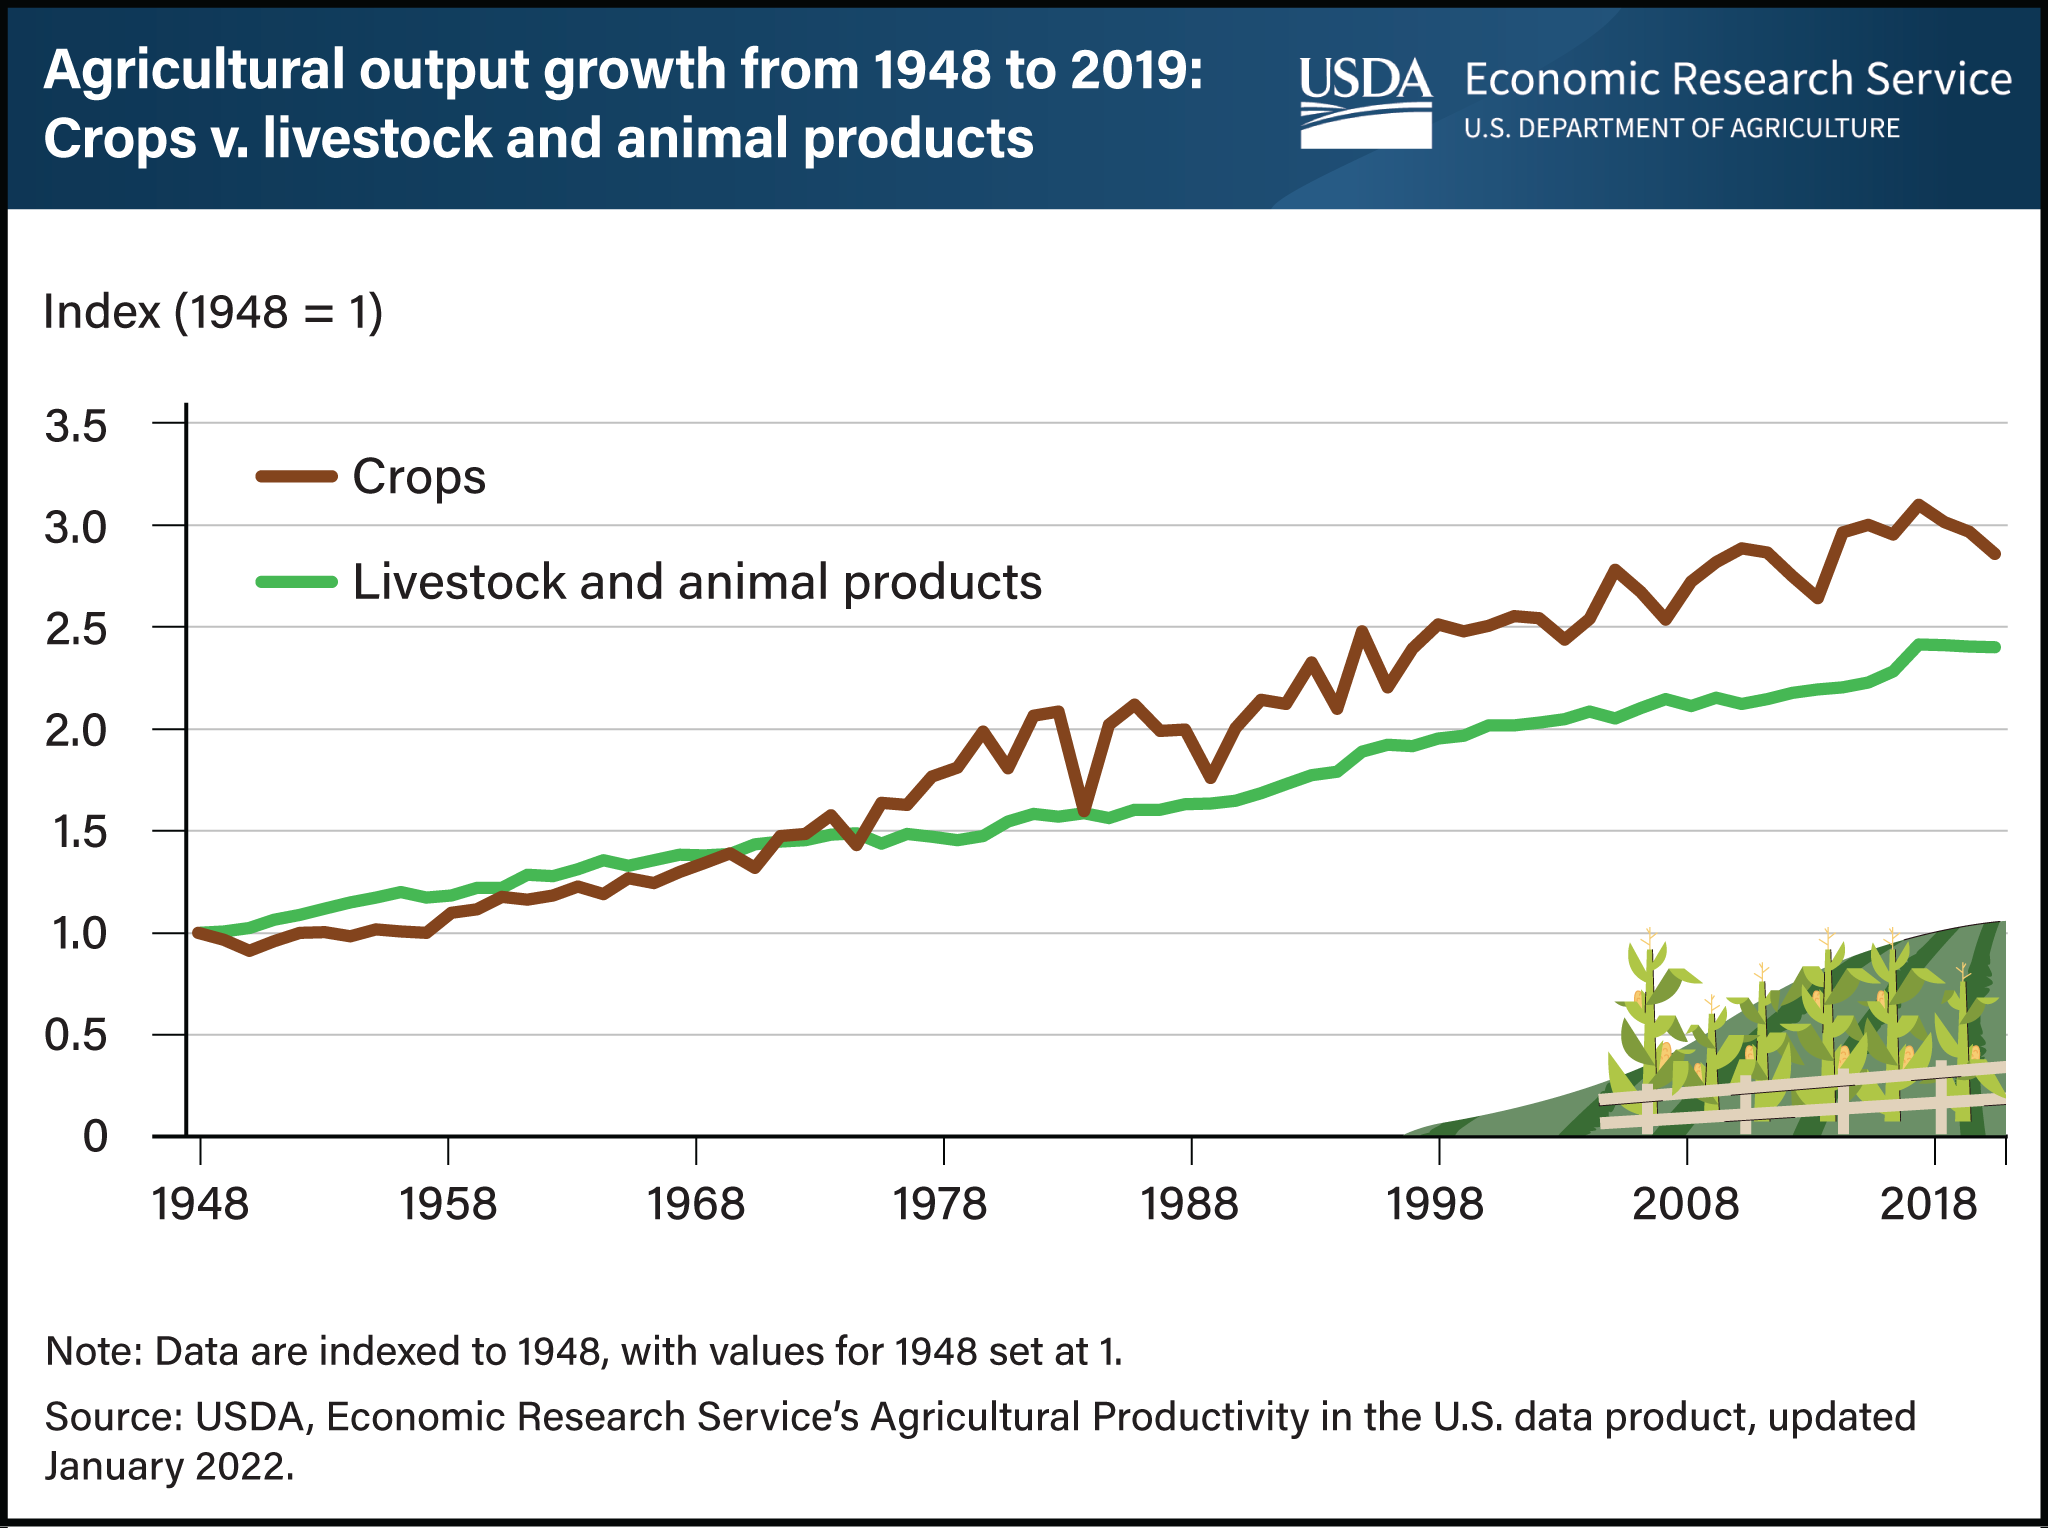
Between 1948 and 2019, the volume of crops produced in the U.S. grew 186 percent, and livestock production grew 140 percent. USDA, Economic Research Service researchers classify crop output into six subcategories: food grains, feed crops, oil crops, vegetables and melons, fruits and nuts, and other crops. Of those, production of oil crops increased the most, by more than seven times. Growth in fruits and nuts ranked second, with production more than doubling. Food grains grew the least, at 78 percent. Among three categories of livestock and products, poultry and egg production increased the most, by more than seven times. Dairy products grew 132 percent, and meat animal production grew 92 percent. The varying growth rates reflect changes over the past 70 years in consumer demand and preferences, international market demand, and technological advancements among products. Overall, crop production is more volatile than livestock production because of weather changes. This chart appears in the Amber Waves article U.S. Agricultural Output Has Grown Slower in Response to Stagnant Productivity Growth, published in October 2022.