
U.S. Agricultural Output Has Grown Slower in Response to Stagnant Productivity Growth
- by Sun Ling Wang, Roberto Mosheim, Eric Njuki and Richard Nehring
- 10/27/2022
Technology advancement has allowed U.S. farmers to produce more crops and livestock while using less labor and land. From 1948 to 2019, the quantity of farm labor used in the production of U.S. agricultural commodities fell by three-fourths and land use declined by a fourth. During the same time, U.S. agricultural production rose to about 2.7 times its 1948 level. The mix of input use on farms over the past 70 years has shifted away from labor and land and toward capital inputs such as machinery, farm structures (chicken houses and greenhouses, for example), and intermediate inputs such as fertilizer, pesticides, and purchased services.
Sustainable growth in agricultural productivity is critical to meeting the food and fiber demand of a world population that the United Nations expects to reach 9.8 billion by 2050. If agricultural productivity growth falters, then increased demand for farm products can outpace output growth. When demand exceeds supply, prices tend to rise. Elevated food prices have the potential to encourage farmers to increase their use of agricultural chemicals and marginal land that could result in environmental problems such as impaired water and soil quality through nutrient and chemical runoff or erosion.
There are two ways to measure productivity: a single factor productivity measure and a total factor productivity measure. Single factor productivity is the ratio of output to one factor such as land or labor. For example, corn production could be measured per acre (land productivity) or per unit of labor (labor productivity). However, because single factor productivity estimates do not account for the contributions of all inputs used in production, they can be limiting. USDA, Economic Research Service researchers measure total factor productivity (TFP), which considers the use of all inputs under farmers' control in the production of all commodities. As such, TFP measures changes in the efficiency with which all inputs are transformed into outputs.
ERS researchers monitor U.S. agricultural productivity trends and routinely publish total factor productivity statistics for the U.S. farm sector, along with the estimates of 10 outputs and 12 inputs. According to recent data, U.S. agricultural output grew 175 percent between 1948 and 2019, an average rate of 1.42 percent a year. Total input use increased 4 percent during the same period, with average growth of 0.06 percent a year. Total factor productivity growth—measured as the difference between total output growth and total input growth—grew at an annual rate of 1.36 percent, accounting for most of the farm output growth over the years.

While total input use grew little over the years, the composition of inputs has changed. Between 1948 and 2019, labor use declined by 74 percent, and land use fell by 28 percent. On the other hand, the use of intermediate inputs grew 126 percent, and the use of capital inputs (excluding land) grew 79 percent. Over the years, technological changes have made inputs such as machinery and agricultural chemicals more affordable for farmers and have partially replaced labor and land inputs in the production process. Productivity growth also helped release land and labor from the farm sector to other sectors. Therefore, labor productivity (measured as total output per unit of labor input) and land productivity (measured as total output per unit of land input) were about 10 times and 4 times their 1948 levels in 2019, respectively.

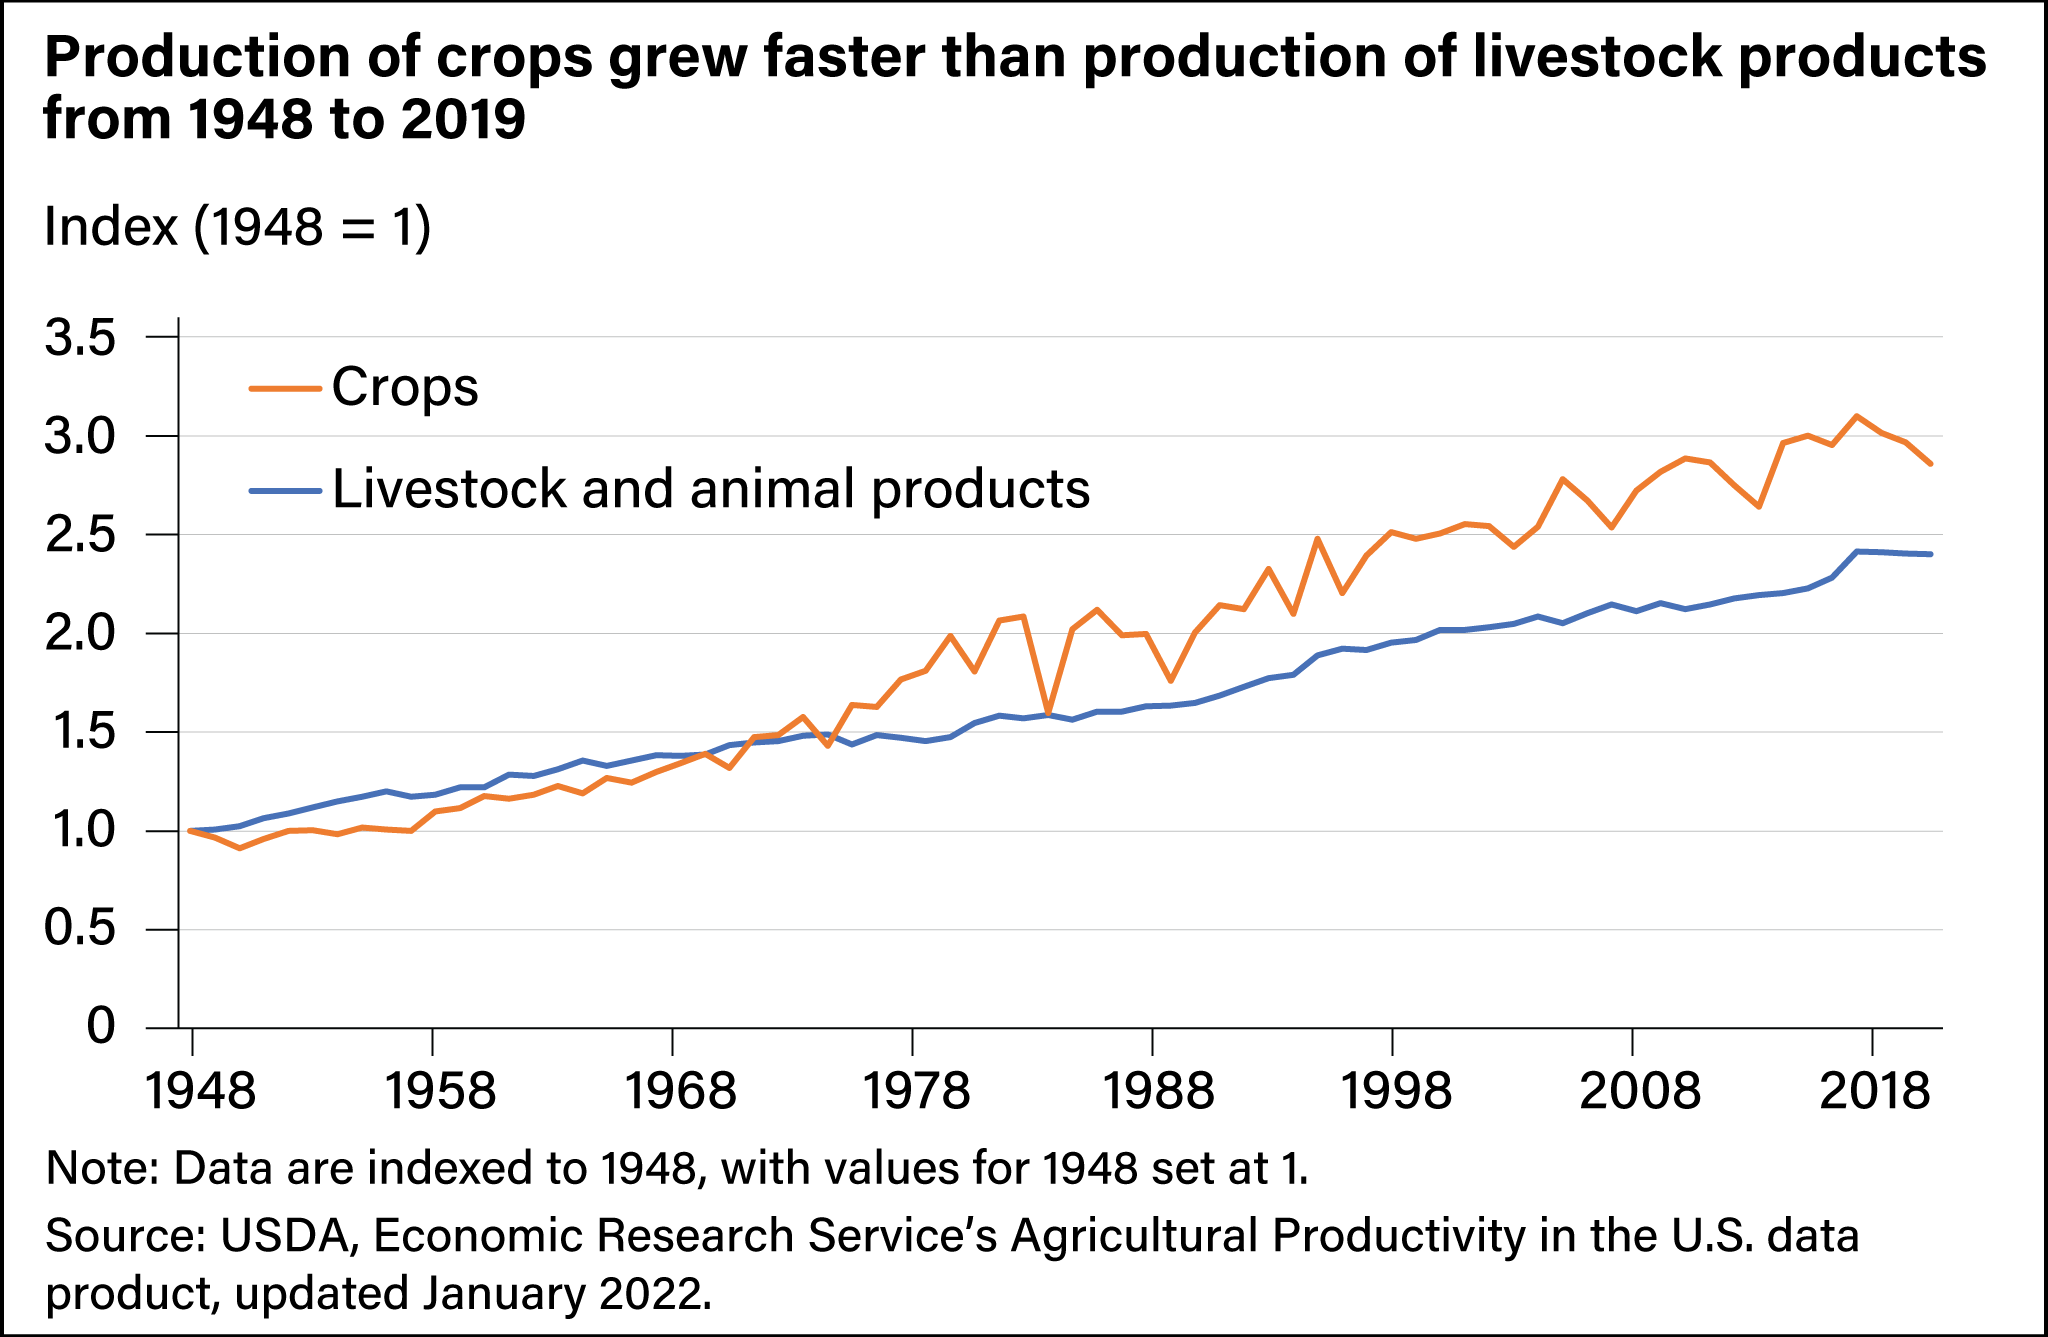
Over the seven-decade period, the volume of crop production grew 186 percent and livestock production grew 140 percent. In 2019, crops accounted for 54 percent of the total value of agricultural output in the United States while livestock and related products accounted for 39 percent. About 7 percent of the total value of production is categorized as other farm-related output. That category includes the output of goods and services from certain nonagricultural or secondary activities that are closely related to agricultural production and for which information on output and input use cannot be separately measured. ERS researchers classify crop output into six subcategories: food grains, feed crops, oil crops, vegetables and melons, fruits and nuts, and other crops. Of those, production of oil crops increased the most, by more than seven times. Growth in fruits and nuts ranked second, with production more than doubling. Food grains grew the least at 78 percent. Among three categories of livestock and products, poultry and egg production increased the most, by more than seven times. Dairy products grew 132 percent, and meat animal production grew 92 percent. The varying growth rates reflected changes over the past 70 years in consumer demand, international market demand, and technological advancements among some farm products. Overall, crop production is more volatile from year to year than livestock production as weather changes become more frequent.
Growth in the farm sector can vary between periods of expansion and contraction of the economy, defined as business cycles, that reflect changes in the total demand for and supply of the final goods and services in the macroeconomy. Examining a longer time series helps explain overall changes in the farm economy. Concurrently observing shorter periods of business cycles accentuates the nuances of growth. ERS researchers grouped the years between 1948 and 2019 into 12 periods based on business cycles determined by the National Bureau of Economic Research (measured from cyclical peak to peak in U.S. aggregate economic activity). In more recent years, TFP growth has been stagnant, resulting in a slowdown in the average annual growth rate of farm output. Nevertheless, TFP growth is still the major driver of output growth with a minor decrease in input growth rate. TFP grew at a rate of 0.67 percent annually during the business cycle from 2007 to 2019, slightly above the 0.64 percent annual growth in the 2000–07 period. Agricultural productivity growth rates in the last two business cycles, on average, were lower than in most earlier periods. From 2007–19, output grew at an average annual rate of 0.61 percent, down from 0.77 percent in the 2000–2007 cycle. Slower output growth in the more recent period also reflects decreases in crop production attributed to adverse weather.

Total factor productivity growth in the long-term is an outcome of technical changes that are primarily driven by research and development (R&D) in the public and private sectors. As more farms adopt new and updated technology, such as the use of precision agriculture, drought tolerant crops, and farm practices, productivity can grow over time. However, in the short-term, factors such as adverse weather events, animal disease, or pest infestations can affect agricultural output and, thus, productivity estimates. Those changes have resulted in wide variations in annual agricultural output and productivity growth rates in more recent years. R&D investment and adoption of technology that helps mitigate the impact of extreme weather are important to maintaining stable and sustainable agricultural growth in the long run.
This article is drawn from:
- Agricultural Productivity in the United States. (n.d.). U.S. Department of Agriculture, Economic Research Service.
You may also like:
- Nelson, K.P. & Fuglie, K. (2022, June 6). Investment in U.S. Public Agricultural Research and Development Has Fallen by a Third Over Past Two Decades, Lags Major Trade Competitors. Amber Waves, U.S. Department of Agriculture, Economic Research Service.
- Wang, S.L., Heisey, P., Schimmelpfennig, D. & Ball, E. (2015). Agricultural Productivity Growth in the United States: Measurement, Trends, and Drivers. U.S. Department of Agriculture, Economic Research Service. ERR-189.
- Wang, S.L., Hoppe, R.A. & Hertz, T. (2022). Farm Labor, Human Capital, and Agricultural Productivity in the United States. U.S. Department of Agriculture, Economic Research Service. ERR-302.
- Njuki, E. (2022). Sources, Trends, and Drivers of U.S. Dairy Productivity and Efficiency. U.S. Department of Agriculture, Economic Research Service. ERR-305.