
Participation by children in USDA’s Special Supplemental Nutrition Program for Women, Infants, and Children (WIC) increased during FY 2020
- by Leslie Hodges
- 11/8/2021
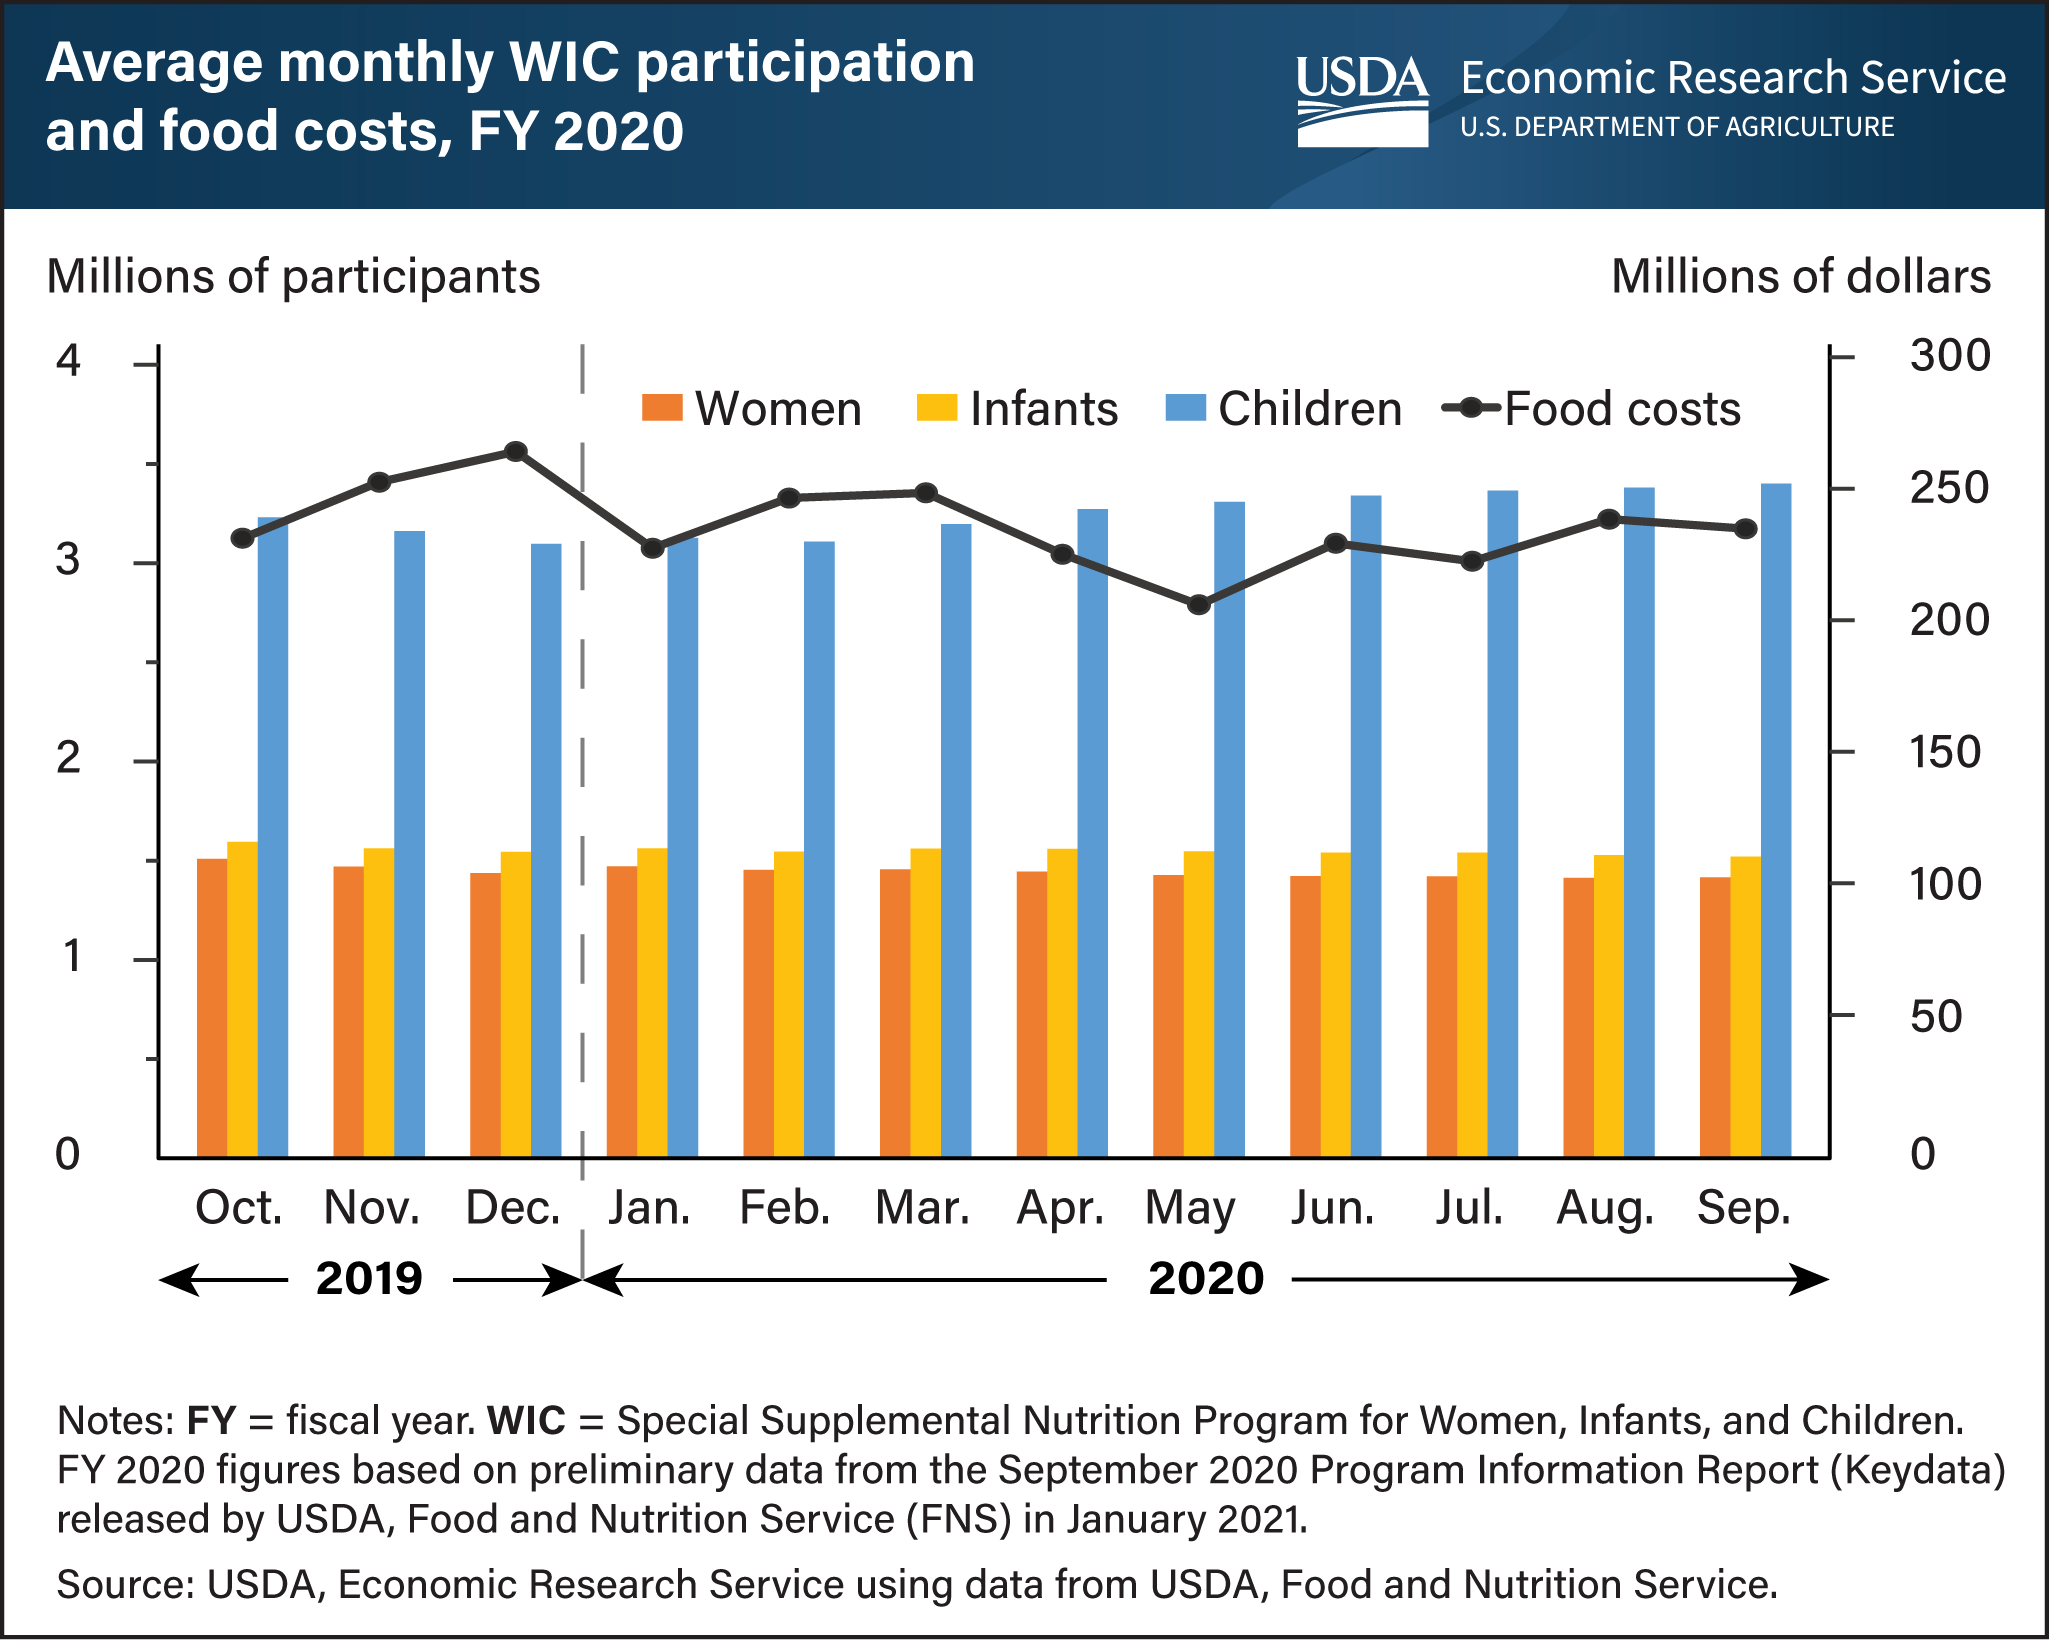
The Special Supplemental Nutrition Program for Women, Infants, and Children (WIC) provides supplemental food packages, nutrition education, breastfeeding support, and health care referrals at no cost to pregnant and postpartum women, infants, and children up to 5 years of age who are at nutritional risk. Before the Coronavirus (COVID-19) pandemic, most WIC services, including certification, recertification, and supplemental food package issuance, were provided in-person at WIC clinics. During the pandemic, USDA issued waivers that enabled WIC State agencies to provide various WIC services remotely to protect the health and safety of staff and participants through social distancing. For example, most WIC State agencies applied for and received USDA waivers to allow for remote certification and recertification of WIC recipients, which may have influenced WIC participation. During the second half of fiscal year (FY) 2020 (April through September 2020), average monthly participation rates for women and infants declined by about 42,000 women and 22,000 infants per month, while average monthly participation rates for children 1 to 4 years of age increased by about 200,000 children per month. Further, many State WIC agencies received waivers to allow for substitutions to items included in participants’ food packages to address pandemic-induced food shortages. Despite these allowances, USDA spending on WIC food package redemptions, referred to as WIC food costs, fell in the months following the onset of the pandemic. On average, monthly food costs in the second half of FY 2020 were about $20 million lower than food costs in the first half of FY 2020. This chart is based on data available as of January 2021 that is subject to revision and appears in the October 2021 Amber Waves article, “Coronavirus (COVID-19) Pandemic Transformed the U.S. Federal Food and Nutrition Assistance Landscape”.