
Foods sold through intermediate markets and institutions accounted for the largest share of local food sales in 2015
- by Stephen Martinez
- 10/4/2021
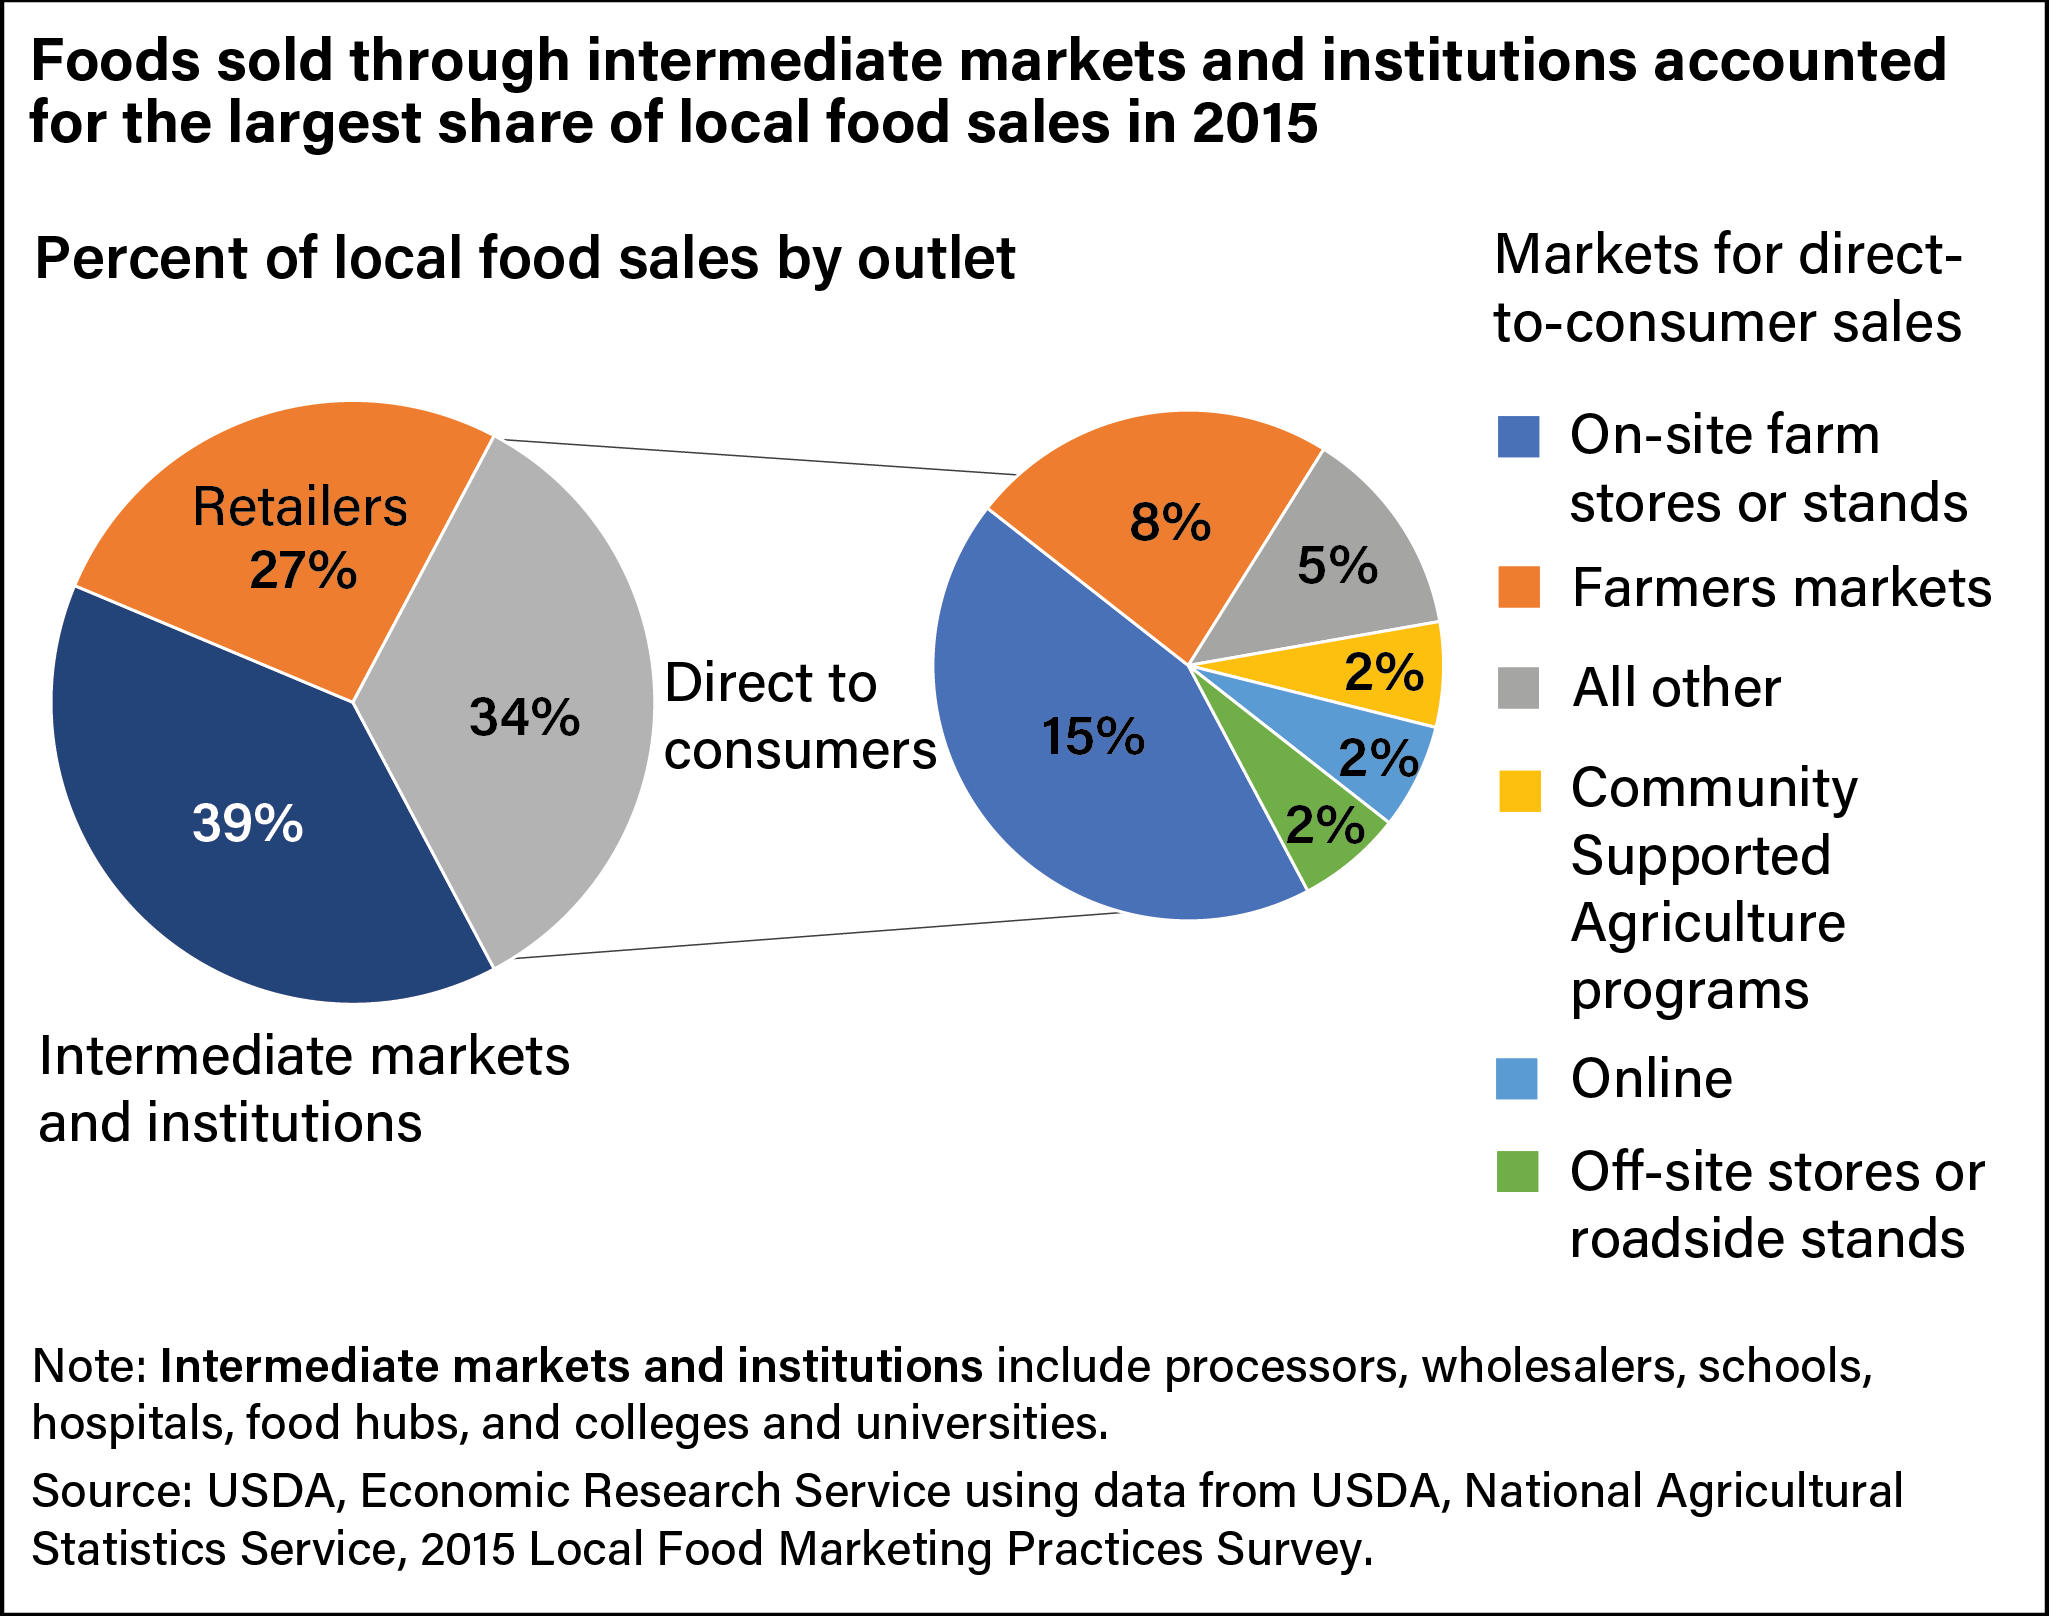
Two pie charts, one showing the percent of local food sales by type of outlet, and another showing share of local foods sold through six direct-to-consumer outlets.