
The supply of skim solids grew from 2000 to 2019, with the amount going to cheese production climbing
- by Angel Terán and Jerry Cessna
- 8/9/2021
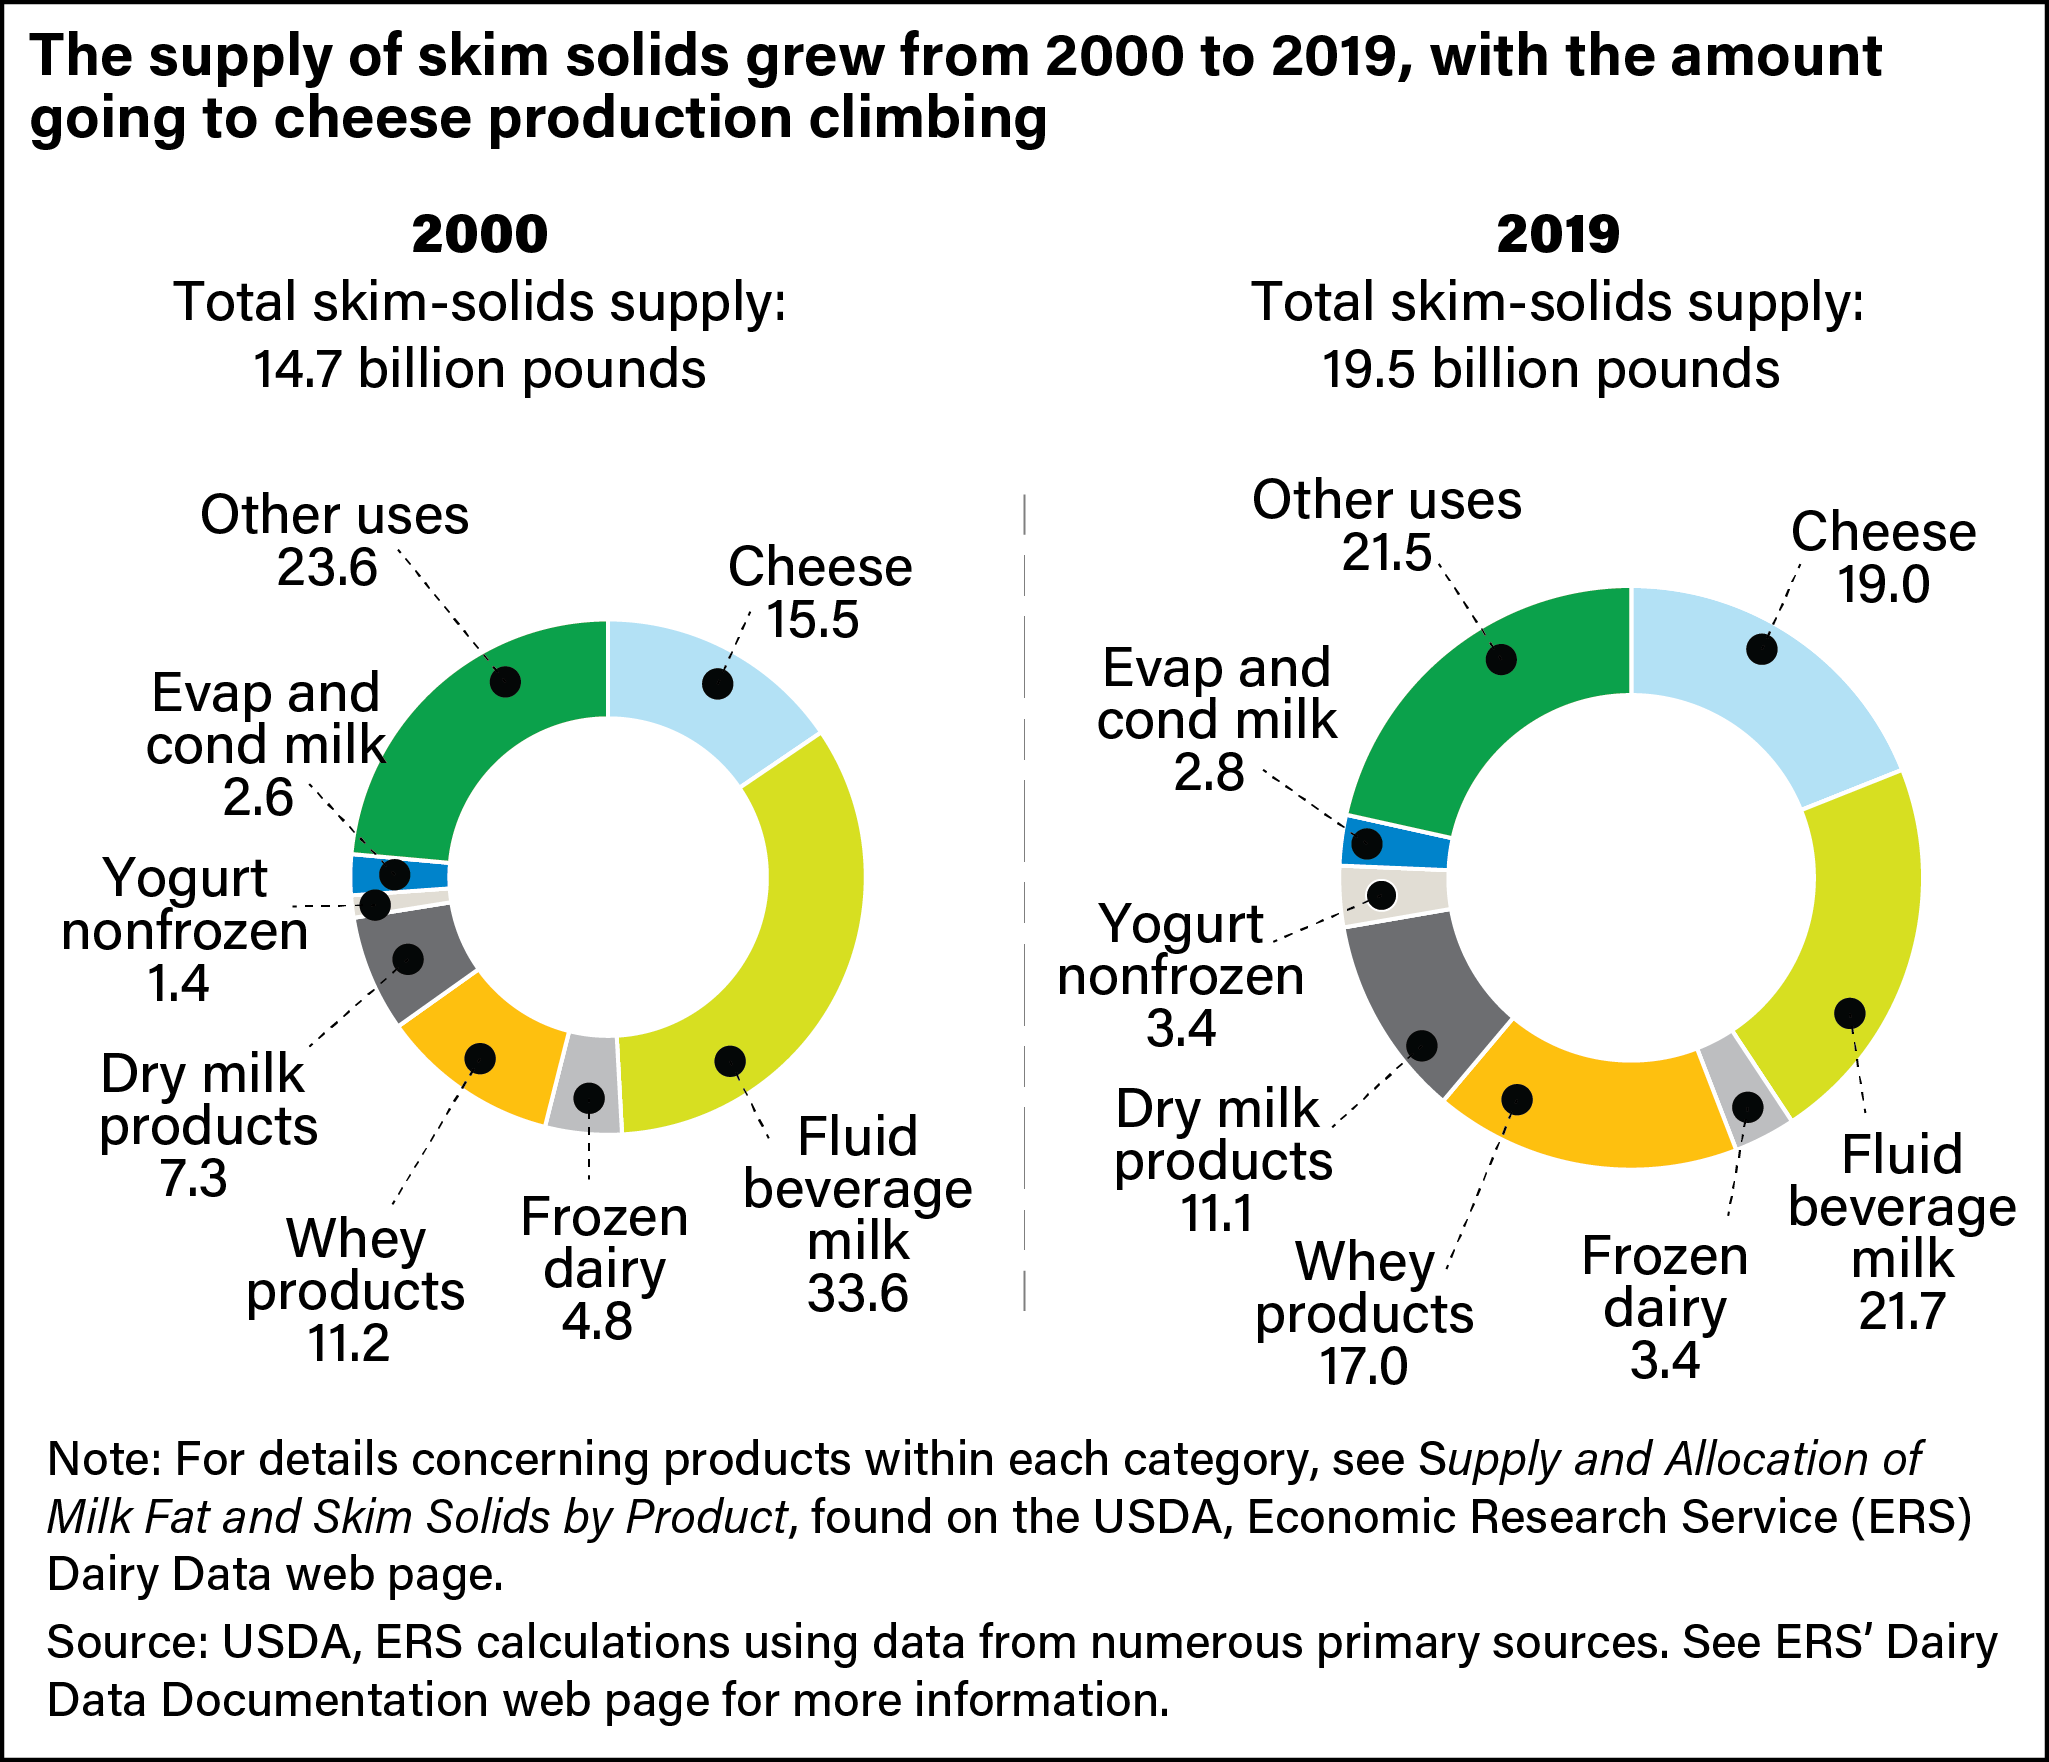
Two pie charts comparing total U.S. skim-solids supply from 2000 to 2019, illustrating that skim-solids supply increased in that time as did the use of skim solids in cheese production.