
There are slight differences between the vintage 2010 and vintage 2020 versions of the USDA, Economic Research Service’s Area and Road Ruggedness Scales data product. The methods used to create the data product and the geographic scope of coverage are the same for both vintages, but the data inputs were updated. We first address how the data inputs have changed. We then discuss how those changes affected the overall distribution of census tracts by mean Terrain Ruggedness Index (TRI). Finally, we discuss how the Area Ruggedness Scale (ARS) and Road Ruggedness Scale (RRS) classification of specific locations was affected by the updated data inputs.
Data Inputs
Topographic variation throughout much of the United States has changed very little in the last decade. The 2010 and 2020 vintages of the Area and Road Ruggedness Scales data product use the same digital elevation model as an input, the Global Multi-resolution Terrain Elevation Data (GMTED2010). GMTED 2010 is still the elevation dataset of choice for applications with a large geographic scope.
However, from 2010 to 2020, the number of census tracts in the United States (excluding territories) increased from 73,057 to 84,414. This increase was primarily due to splitting existing census tracts into multiple new census tracts. Census tracts can also be combined into a single entity or may be created from parts of multiple existing census tracts. Regardless of the type of change, alterations to a census tract’s land area may impact the location’s mean TRI and, subsequently, its ARS and RRS classification.
The input road network has also changed substantially. Three main factors contribute to this change. The first factor is changes to the footprint of the road network due to growth or loss of roads available for public use. The second factor is an overall increase in data quality due to technological advancements. The final factor is that we are using a new data source. There is natural variation in the data provided by different sources, due to variation in collection methods and classification of roads.
The specific data inputs used are detailed in the Data Sources section of the Documentation page.
Data Distribution
As discussed in the Methods section of the Documentation page, the distribution of the average Terrain Ruggedness Index (TRI) values across census tracts affects the number of categories in the ARS and RRS, as well as the range of values included in each category. Despite an increase of more than 10,000 census tracts from 2010 to 2020, the largest mean Area and Road TRI values included in each category is very similar between years (see table below). There is generally less than half a meter difference. However, the vintage 2020 data product’s maximums are higher. The largest mean Area TRI value in 2020 is 7 meters higher than in 2010, while the largest mean Road TRI value is 50 meters higher.
| Category | ARS 2010 | ARS 2020 | RRS 2010 | RRS 2020 |
| 1-Level | 18.519 | 18.531 | 13.650 | 13.893 |
| 2-Nearly level | 41.469 | 41.249 | 26.209 | 26.500 |
| 3-Slightly rugged | 71.699 | 71.564 | 40.553 | 40.842 |
| 4-Moderately rugged | 103.864 | 104.126 | 54.949 | 55.273 |
| 5-Highly rugged | 134.430 | 135.110 | 134.656 | 184.491 |
| 6-Extremely rugged | 242.804 | 249.867 | - | - |
| ARS = Area Ruggedness Scale, RRS = Road Ruggedness Scale. Note: Category thresholds were calculated using the head/tail breaks classification method, introduced by Jiang (2013). They are the highest possible mean Area TRI or Road TRI value within a census tract that is included in each ruggedness scale category. Source: USDA, Economic Research Service, 2010 and 2020 Area and Road Ruggedness Scales data products. |
||||
There is also very little difference in the distribution of census tracts across ARS and RRS categories between 2010 and 2020, as is illustrated in the table below. Any changes in the share of census tracts in each category are two-tenths of a percentage point or smaller. In both 2010 and 2020, the ARS classifies most census tracts (71 percent) as level, while less than 10 percent are either slightly, moderately, highly, or extremely rugged. Similarly, in both years, the RRS classifies nearly 66 percent of census tracts as level, while only 12 percent are either slightly, moderately, or highly rugged.
| Category | ARS 2010 | ARS 2020 | RRS 2010 | RRS 2020 | ||||
| Number | Percent | Number | Percent | Number | Percent | Number | Percent | |
| 1 | 51,639 | 71.0 | 59,567 | 70.8 | 47,740 | 65.6 | 55,085 | 65.5 |
| 2 | 14,125 | 19.4 | 16,475 | 19.6 | 16,297 | 22.4 | 18,921 | 22.5 |
| 3 | 4,478 | 6.2 | 5,166 | 6.1 | 5,518 | 7.6 | 6,365 | 7.6 |
| 4 | 1,572 | 2.2 | 1,806 | 2.1 | 1,956 | 2.7 | 2,269 | 2.7 |
| 5 | 559 | 0.8 | 647 | 0.8 | 1,254 | 1.7 | 1,476 | 1.8 |
| 6 | 392 | 0.5 | 455 | 0.5 | - | - | - | - |
|
Note: The Area Ruggedness Scale (ARS) is an ordinal scale of topographic variation within census tracts in the United States, ranging from category 1–level to category 6–extremely rugged. The Road Ruggedness Scale (RRS) is an ordinal scale of topographic variation along roads in the United States, ranging from category 1–level to category 5–highly rugged. Source: USDA, Economic Research Service, 2010 and 2020 Area and Road Ruggedness Scales data products. |
||||||||
Explaining Categorical Changes
Although there is great similarity between the vintage 2010 and vintage 2020 versions of the Area and Road Ruggedness Scales, more variation becomes apparent when analyzing the categorical changes at the individual census-tract level. To determine the relationship between the 2010 and 2020 census tracts, we matched the center of each 2020 census tract with the 2010 census tract in which it was located. We then calculated the change in classification by subtracting each tract’s 2010 Area Ruggedness Scale (ARS) and Road Ruggedness Scale (RRS) classification from its 2020 classification.
The table below shows the classification changes in ARS and RRS for census tracts between 2010 and 2020. Approximately 96 percent of census tracts experienced no change in their ARS classification between 2010 and 2020, while the remaining 4 percent were evenly split between increases and decreases. For the RRS, about 94 percent of census tracts experienced no change in their classification. However, slightly more census tracts experienced an increase (3.5 percent) than a decrease (2.8 percent). Most of the census tracts that experienced a change in classification between 2010 and 2020 only moved one category up or down the scale. Large changes in ARS or RRS category were rare.
| ARS Change, 2010 to 2020 | |||||||||
| -5 | -4 | -3 | -2 | -1 | 0 | 1 | 2 | 3 | |
| Tracts | 4 | 17 | 35 | 149 | 1,348 | 81,061 | 1,447 | 40 | 4 |
| Percent | 0.00 | 0.02 | 0.04 | 0.18 | 1.60 | 96.38 | 1.72 | 0.05 | 0.00 |
| RRS Change, 2010 to 2020 | |||||||||
| -5 | -4 | -3 | -2 | -1 | 0 | 1 | 2 | 3 | |
| Tracts | - | 4 | 17 | 105 | 2,233 | 78,843 | 2,834 | 63 | 6 |
| Percent | - | 0.00 | 0.02 | 0.12 | 2.66 | 93.74 | 3.37 | 0.07 | 0.01 |
| Note: Change was calculated by subtracting the 2010 scale value from the 2020 scale value. This means that positive changes indicate an "increase" in ruggedness from 2010 to 2020, while negative changes indicate a "decrease." A change of -5 in a census tract’s RRS classification is not possible because there are only five levels in the scale. Source: USDA, Economic Research Service, 2010 and 2020 Area and Road Ruggedness Scales data products. |
|||||||||
The most any census tract’s classification increased was three categories. However, in both the ARS and RRS, some census tracts experienced a decrease from the highest category to the lowest category, and vice versa. These changes are mainly explained by alterations to the census tracts’ area. As explained earlier, census tracts can be split, combined, or otherwise altered to create new census tracts every 10 years. The maps below present examples of how splitting a census tract area can affect the data being used to calculate the Area and Road Ruggedness Scales.
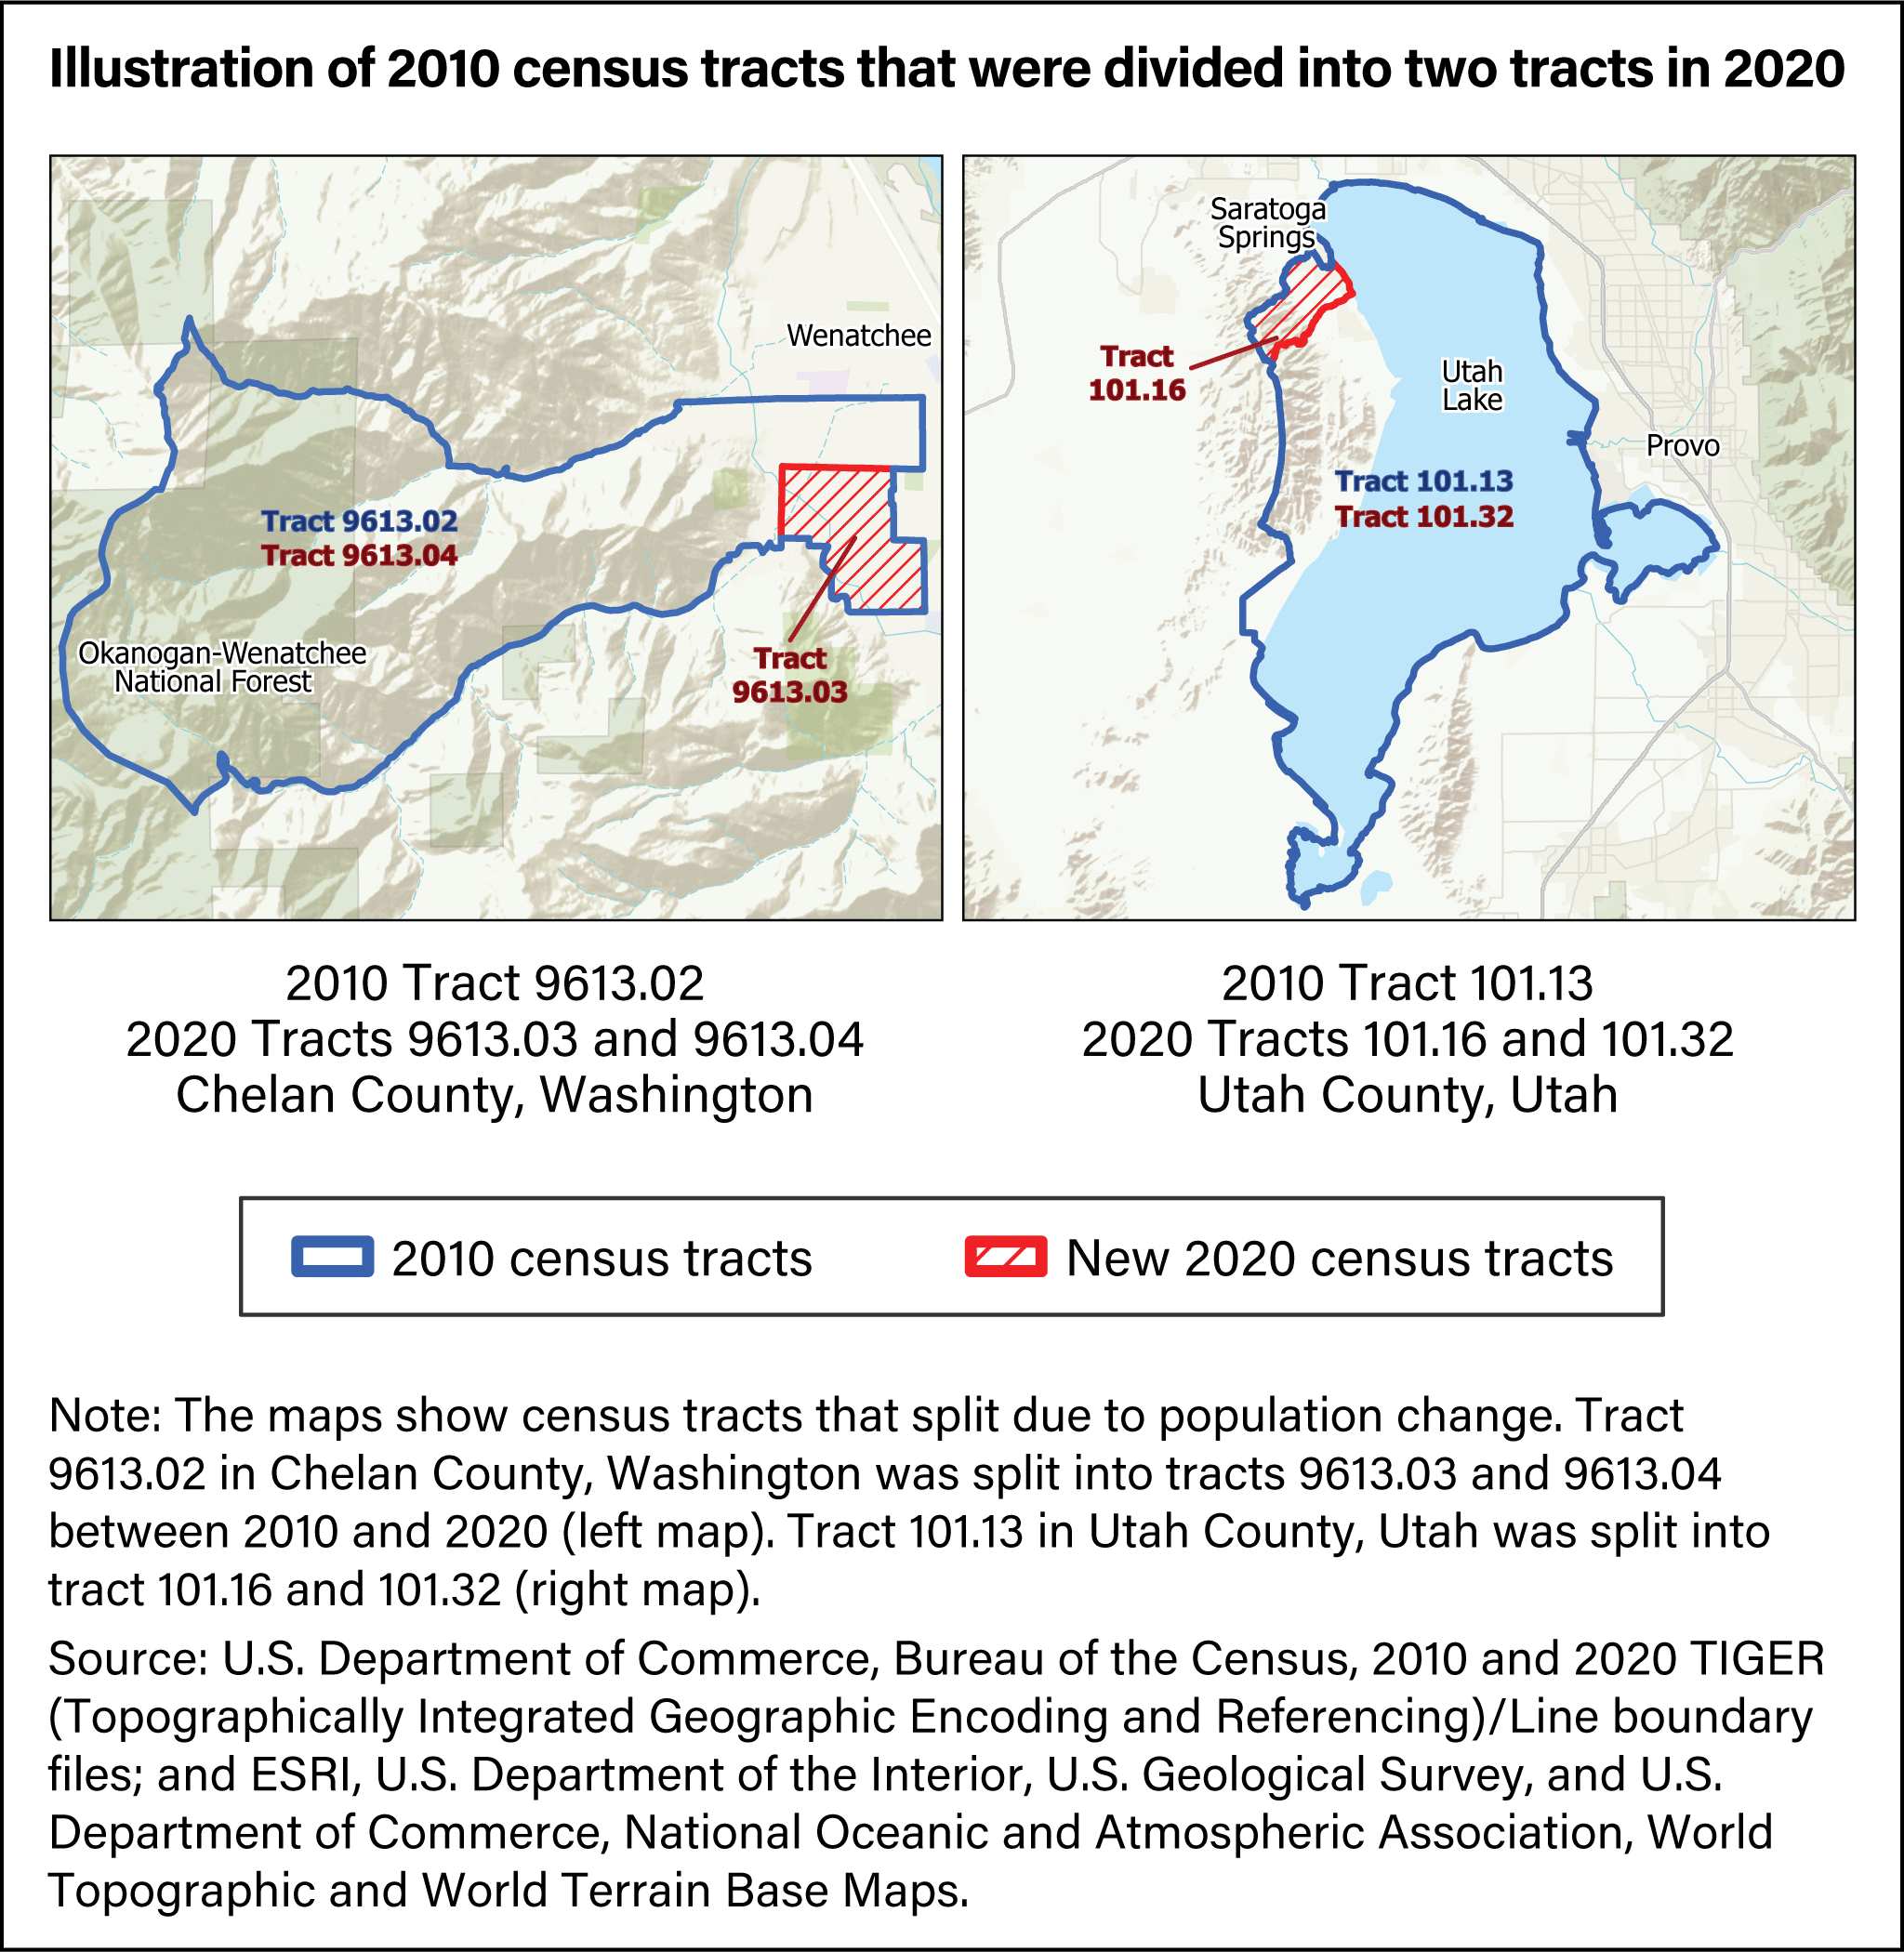
The map on the left shows a census tract west of Wenatchee, Washington where a small, more populated portion of the tract living at the base of the mountains was split off from the rest of the census tract. In 2010, tract 9613.02 was categorized as 6–extremely rugged. In 2020, the new tract at the base of the mountain, tract 9613.03, was categorized as 1–level, while the rest of the census tract, tract 9613.04, was still categorized as 6–extremely rugged. The other three census tracts that had similar decreases in their ARS categories are in Colorado, Montana, and Oregon.
The map on the right shows a census tract in Saratoga Springs, Utah where a small, more populated portion of the tract living between the Lake Mountains and Utah Lake was split off from the rest of the census tract. In 2010, tract 101.13 was categorized as 1–level. In 2020, the new tract on the western shore of the lake, tract 101.16, was categorized as 4–moderately rugged, while the rest of the census tract, tract 101.32, was still categorized as 1–level. The other three census tracts that had similar increases in the ARS categories are in Alaska, California, and Washington.
While changes in area affect both the ARS and RRS, another factor that can result in a census tract’s RRS classification changing between 2010 and 2020 is the updated road network. Roads being built in more rugged locations would increase the mean Road TRI, while more roads in flatter locations would decrease it. Additionally, better data quality may result in existing roads being added to or removed from the input data. If a census tract’s area has not changed between 2010 and 2020, these changes to the road network are the primary source of any differences. However, for most census tracts, changes to the Road TRI and RRS are the result of a combination of area and road factors.