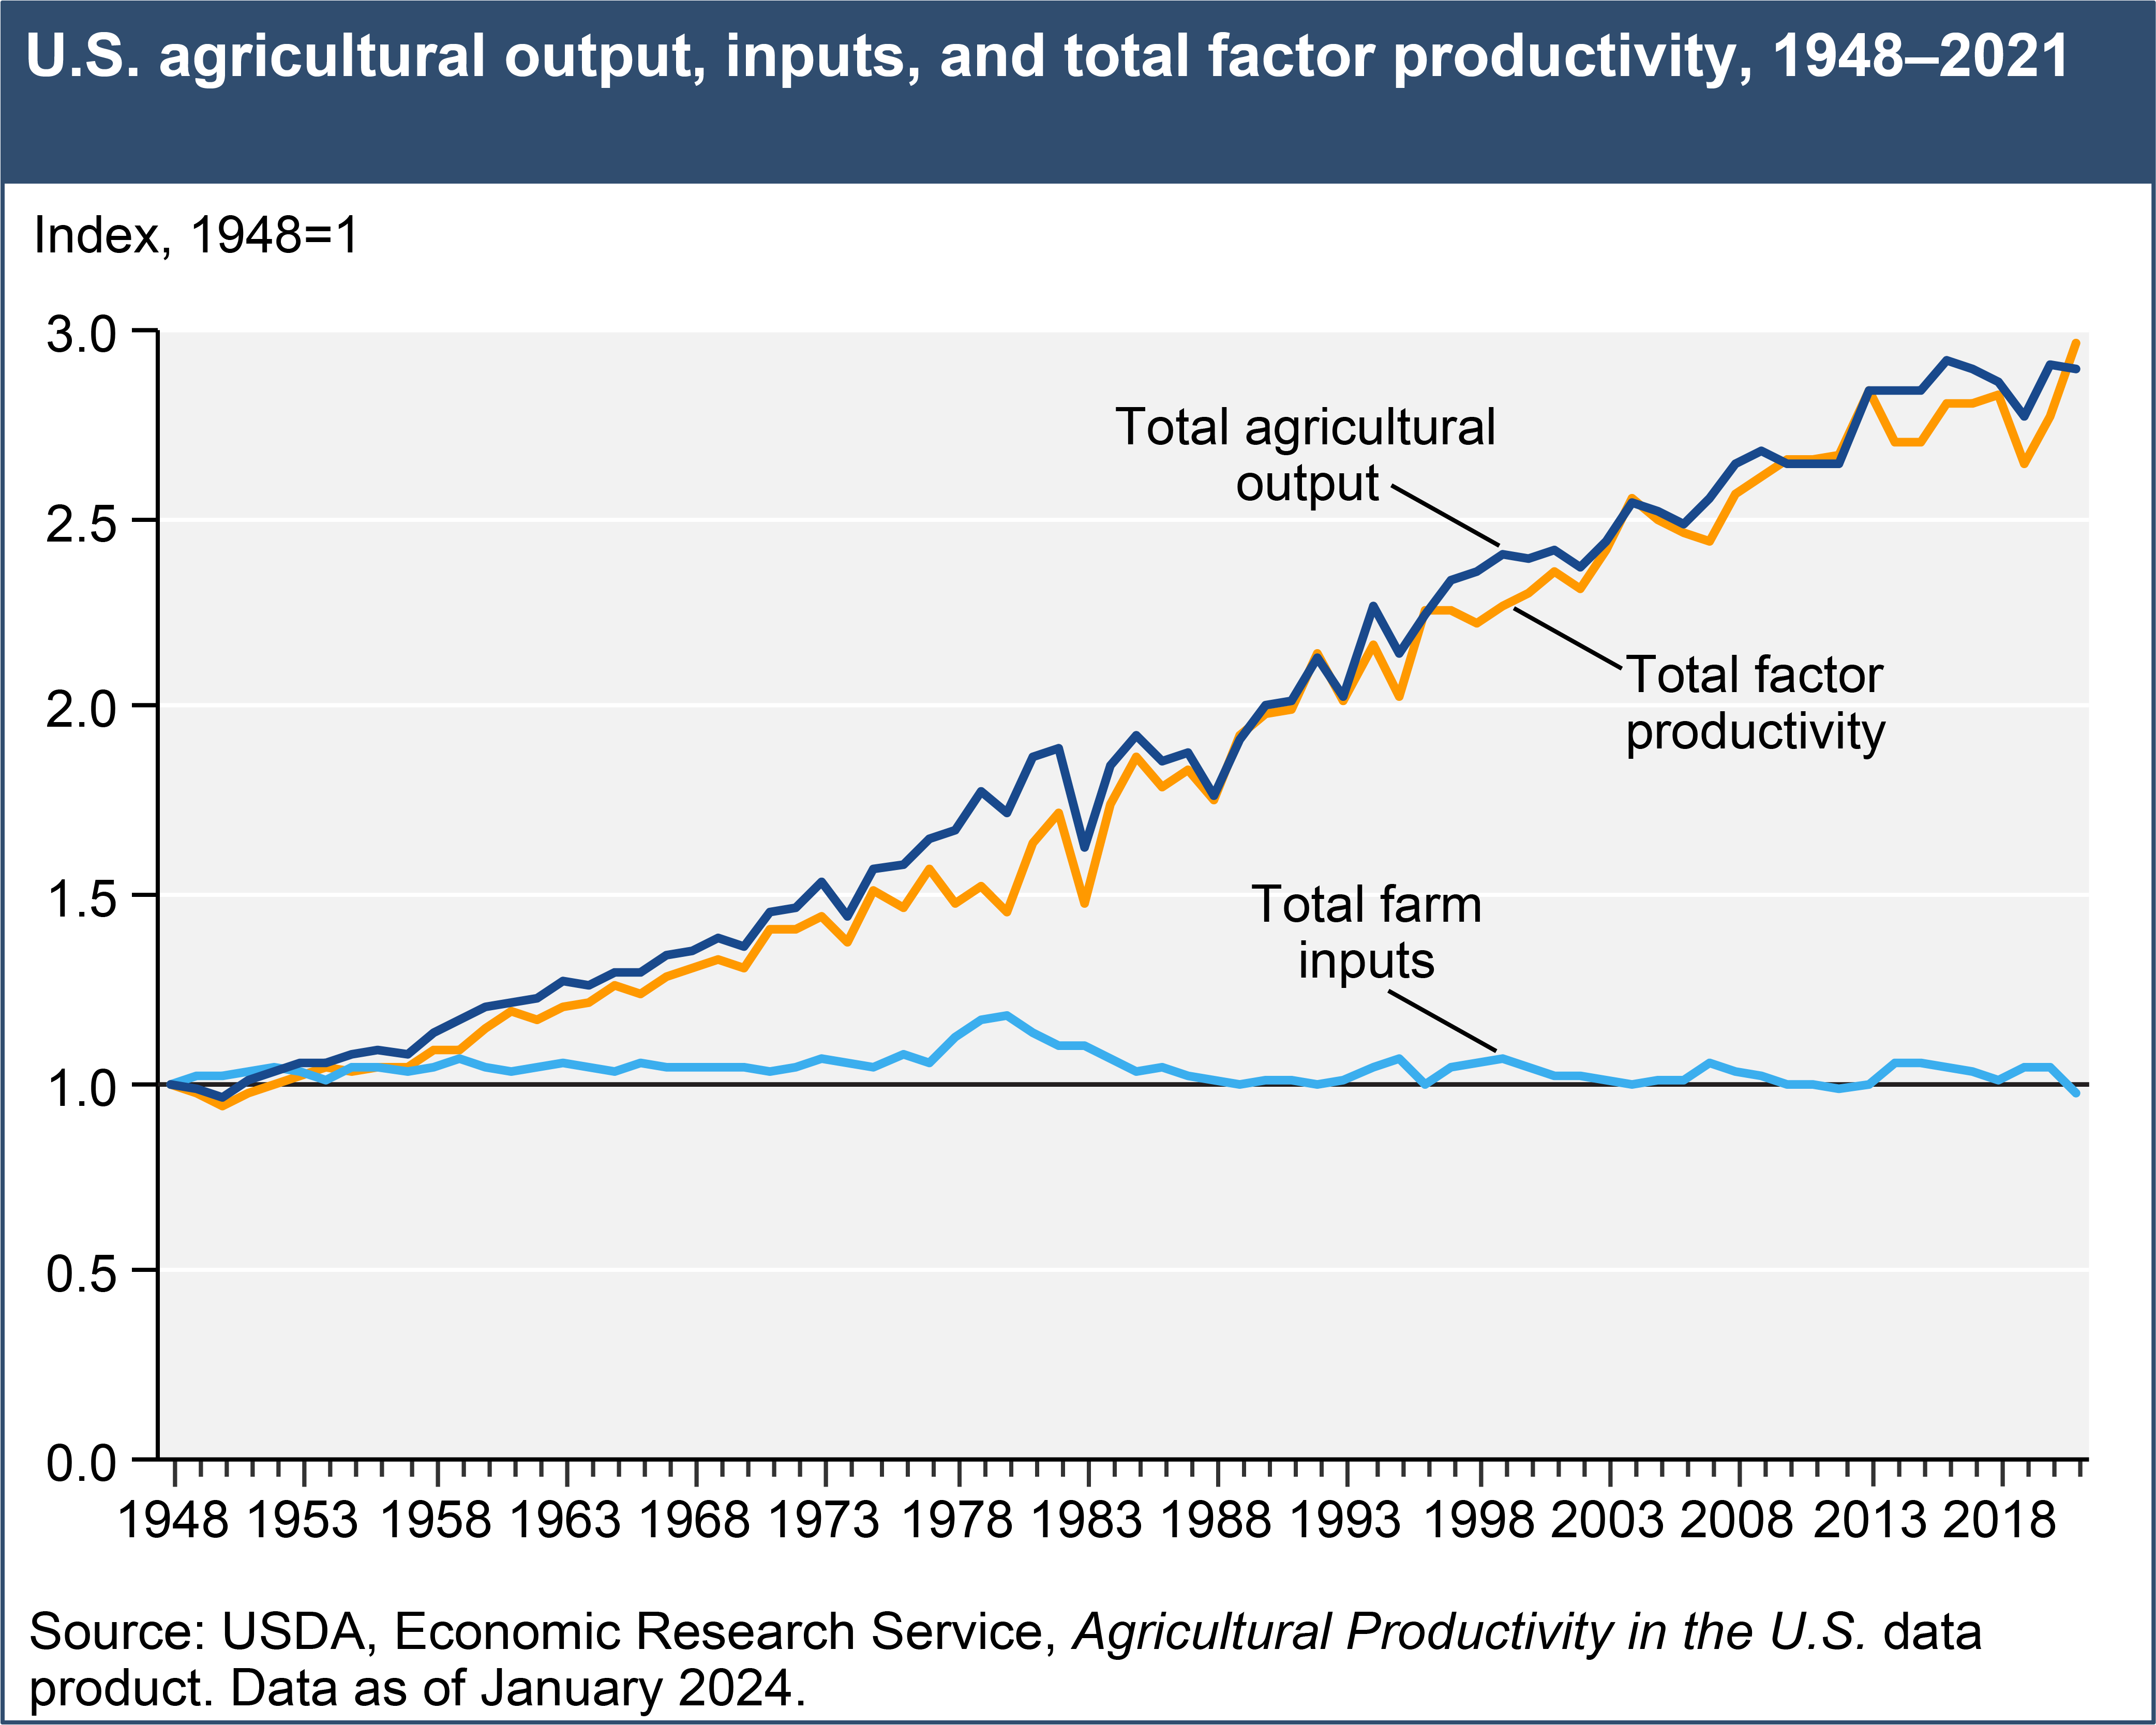
Increased productivity is the main contributor to the growth of U.S. farm output. The level of U.S. farm output was nearly three times its 1948 level in 2021, growing at an average annual rate of 1.46 percent over the period. Aggregate input use declined slightly at a rate of -0.03 percent annually. Therefore, the growth in farm sector output was primarily attributed to productivity growth, which increased at an average 1.49 percent per year over the full period.
But what exactly is productivity?
Single-factor measures of productivity—such as corn production per acre (yield or land productivity) or per hour of labor (labor productivity)—have often been used because the underlying data are readily available. While useful, such measures can also mislead. For example, yields could increase simply because farmers add more inputs (such as agricultural chemicals, labor, or machinery) to their land base. USDA produces measures of total factor productivity (TFP), which takes into account the use of all inputs to the production process.
Specifically, annual TFP growth is the difference between growth of aggregate output and growth of all inputs used. TFP, therefore, measures changes in the efficiency with which inputs are transformed into outputs. Furthermore, in USDA-ERS's U.S. productivity accounts, input measures are adjusted for changes in their quality, such as improvements in the efficacy of chemicals, or changes in the demographics of the farm workforce. As a result, longrun agricultural productivity growth is driven by innovations in onfarm tasks, changes in the organization and structure of the farm sector, and research aimed at improvements in farm production. In the short-term, measured agricultural productivity change can also be affected by random events like weather.
Download chart image | Chart data
The full detail of national-level data is available in table 1 and table 1a (see all data tables).
Summary findings include:
- According to the latest update, the level of U.S. farm output in 2021 was 190 percent more than in 1948, growing at an average annual rate of 1.46 percent. Over 1948–2021, aggregate input use decreased by -2 percent overall, at a rate of -0.03 percent annually, so the growth in farm sector output was entirely attributed to total factor productivity growth, which increased at an annual average rate of 1.49 percent over the full period.
- ERS also examines trends by subperiods (measured from cyclical peak-to-peak in U.S. aggregate economic activity). A notable reduction in inputs was seen in the 2019–2021 subperiod, at -3.35 percent per year on average, driven by declines in hired labor input. During this most recent subperiod, average annual growth in agricultural output was 2.23 percent, led by a rebound in crop production in 2020 after a decline in 2019. Output for crops increased by 4.21 on average annually in the 2019–2021 subperiod. Output for "livestock and products" growth increased from an annual average 1.14 percent in 2007–2019 to 1.29 percent in 2019–2021.
- Looking at the latest subperiods, measured average annual TFP growth increased from 0.7 percent in 2007–2019 to 5.57 percent per year during 2019–2021, which has offset the negative impacts of input reduction and allowed 2021 farm output growth to return to its 2017 level after slowing in previous years.
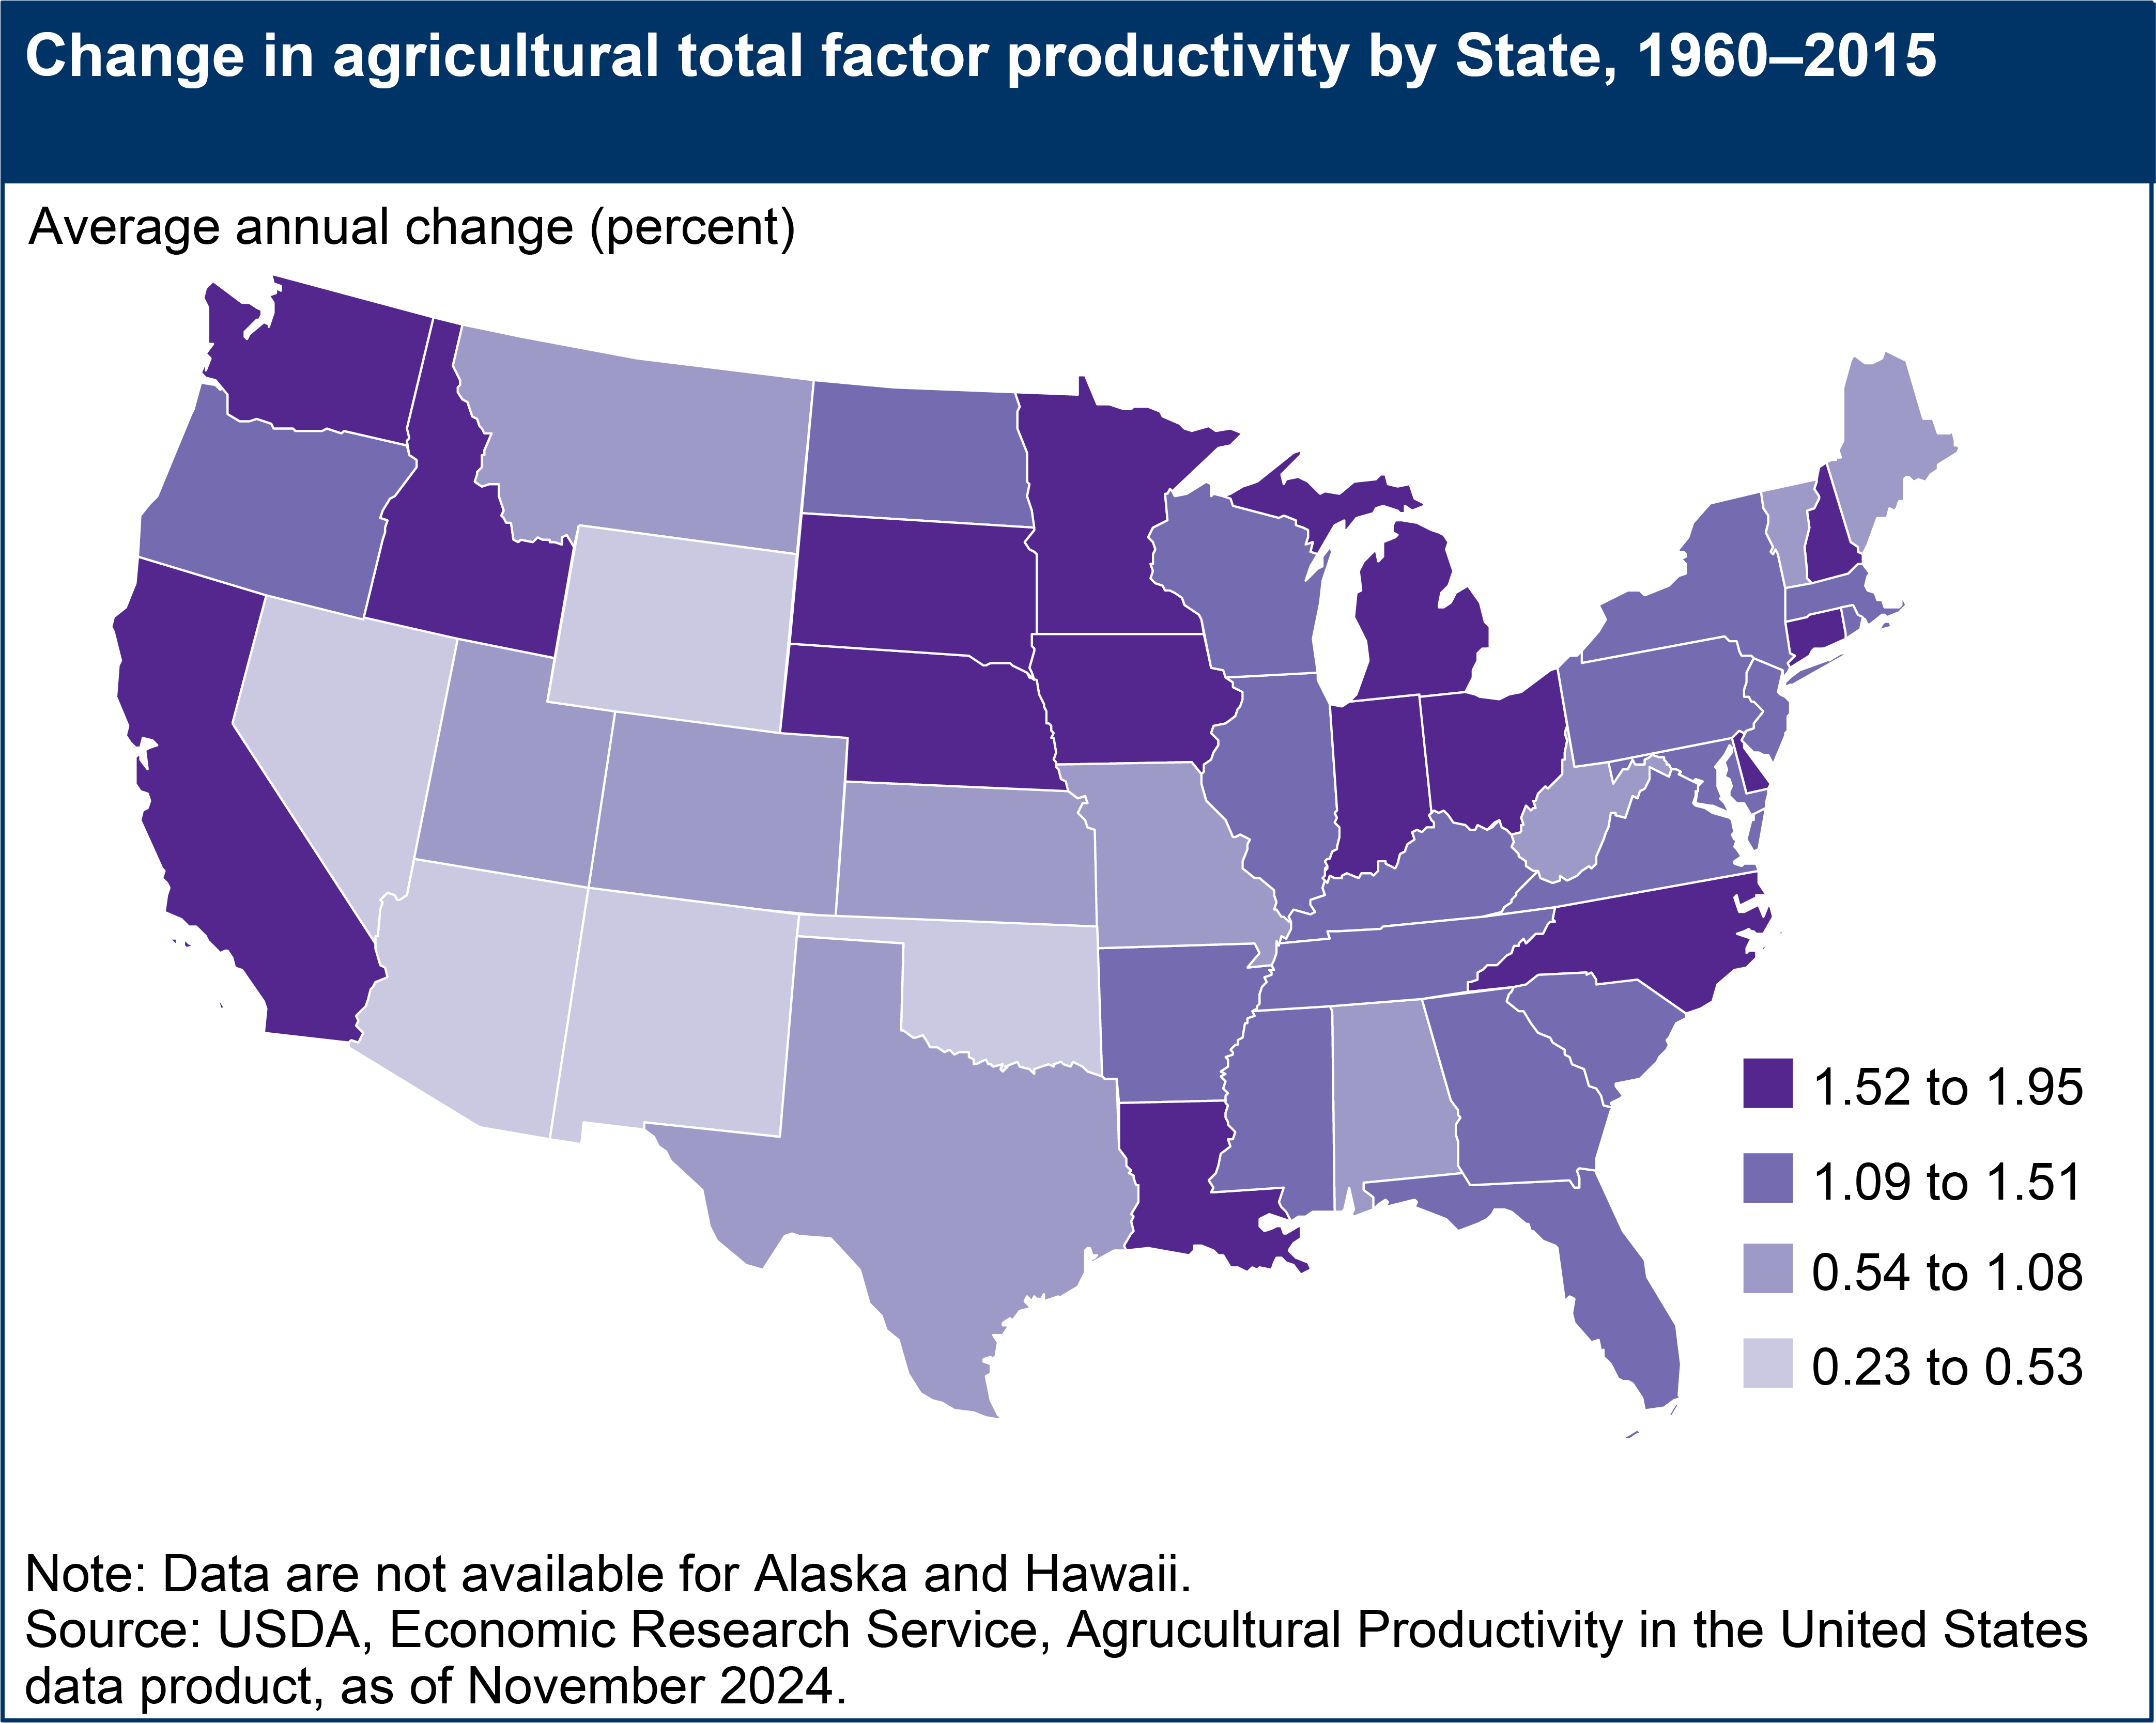
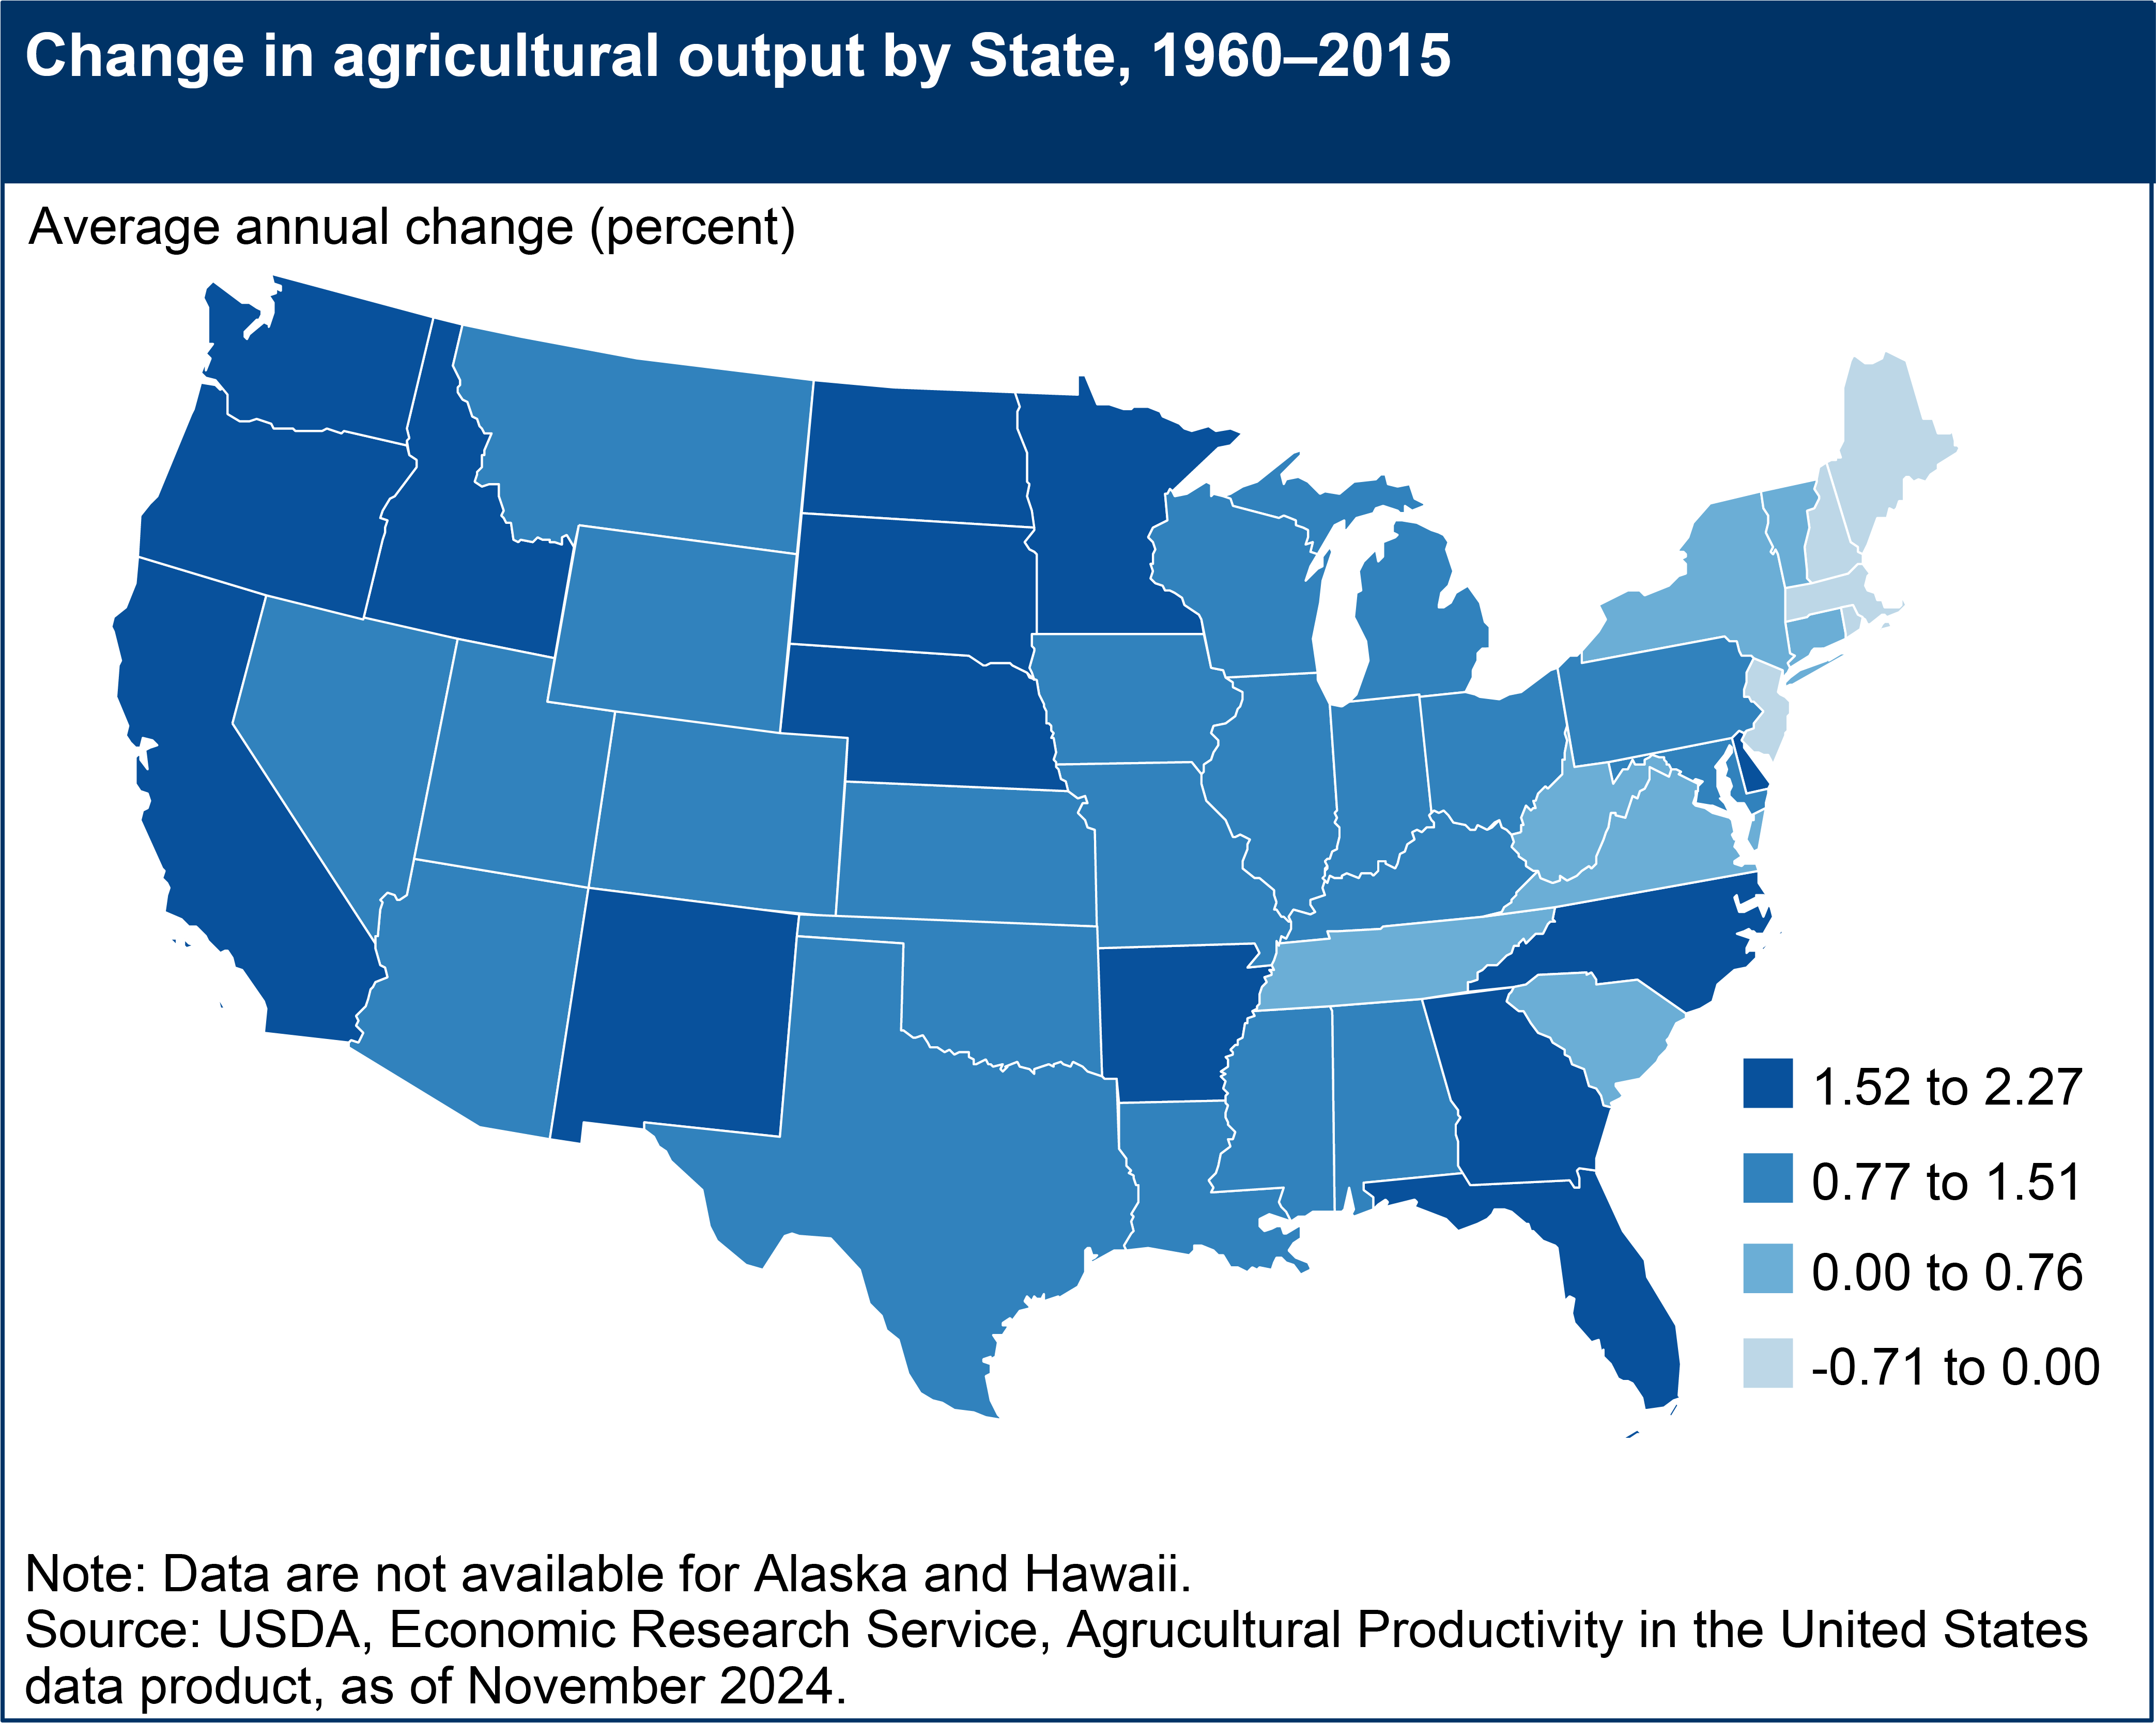
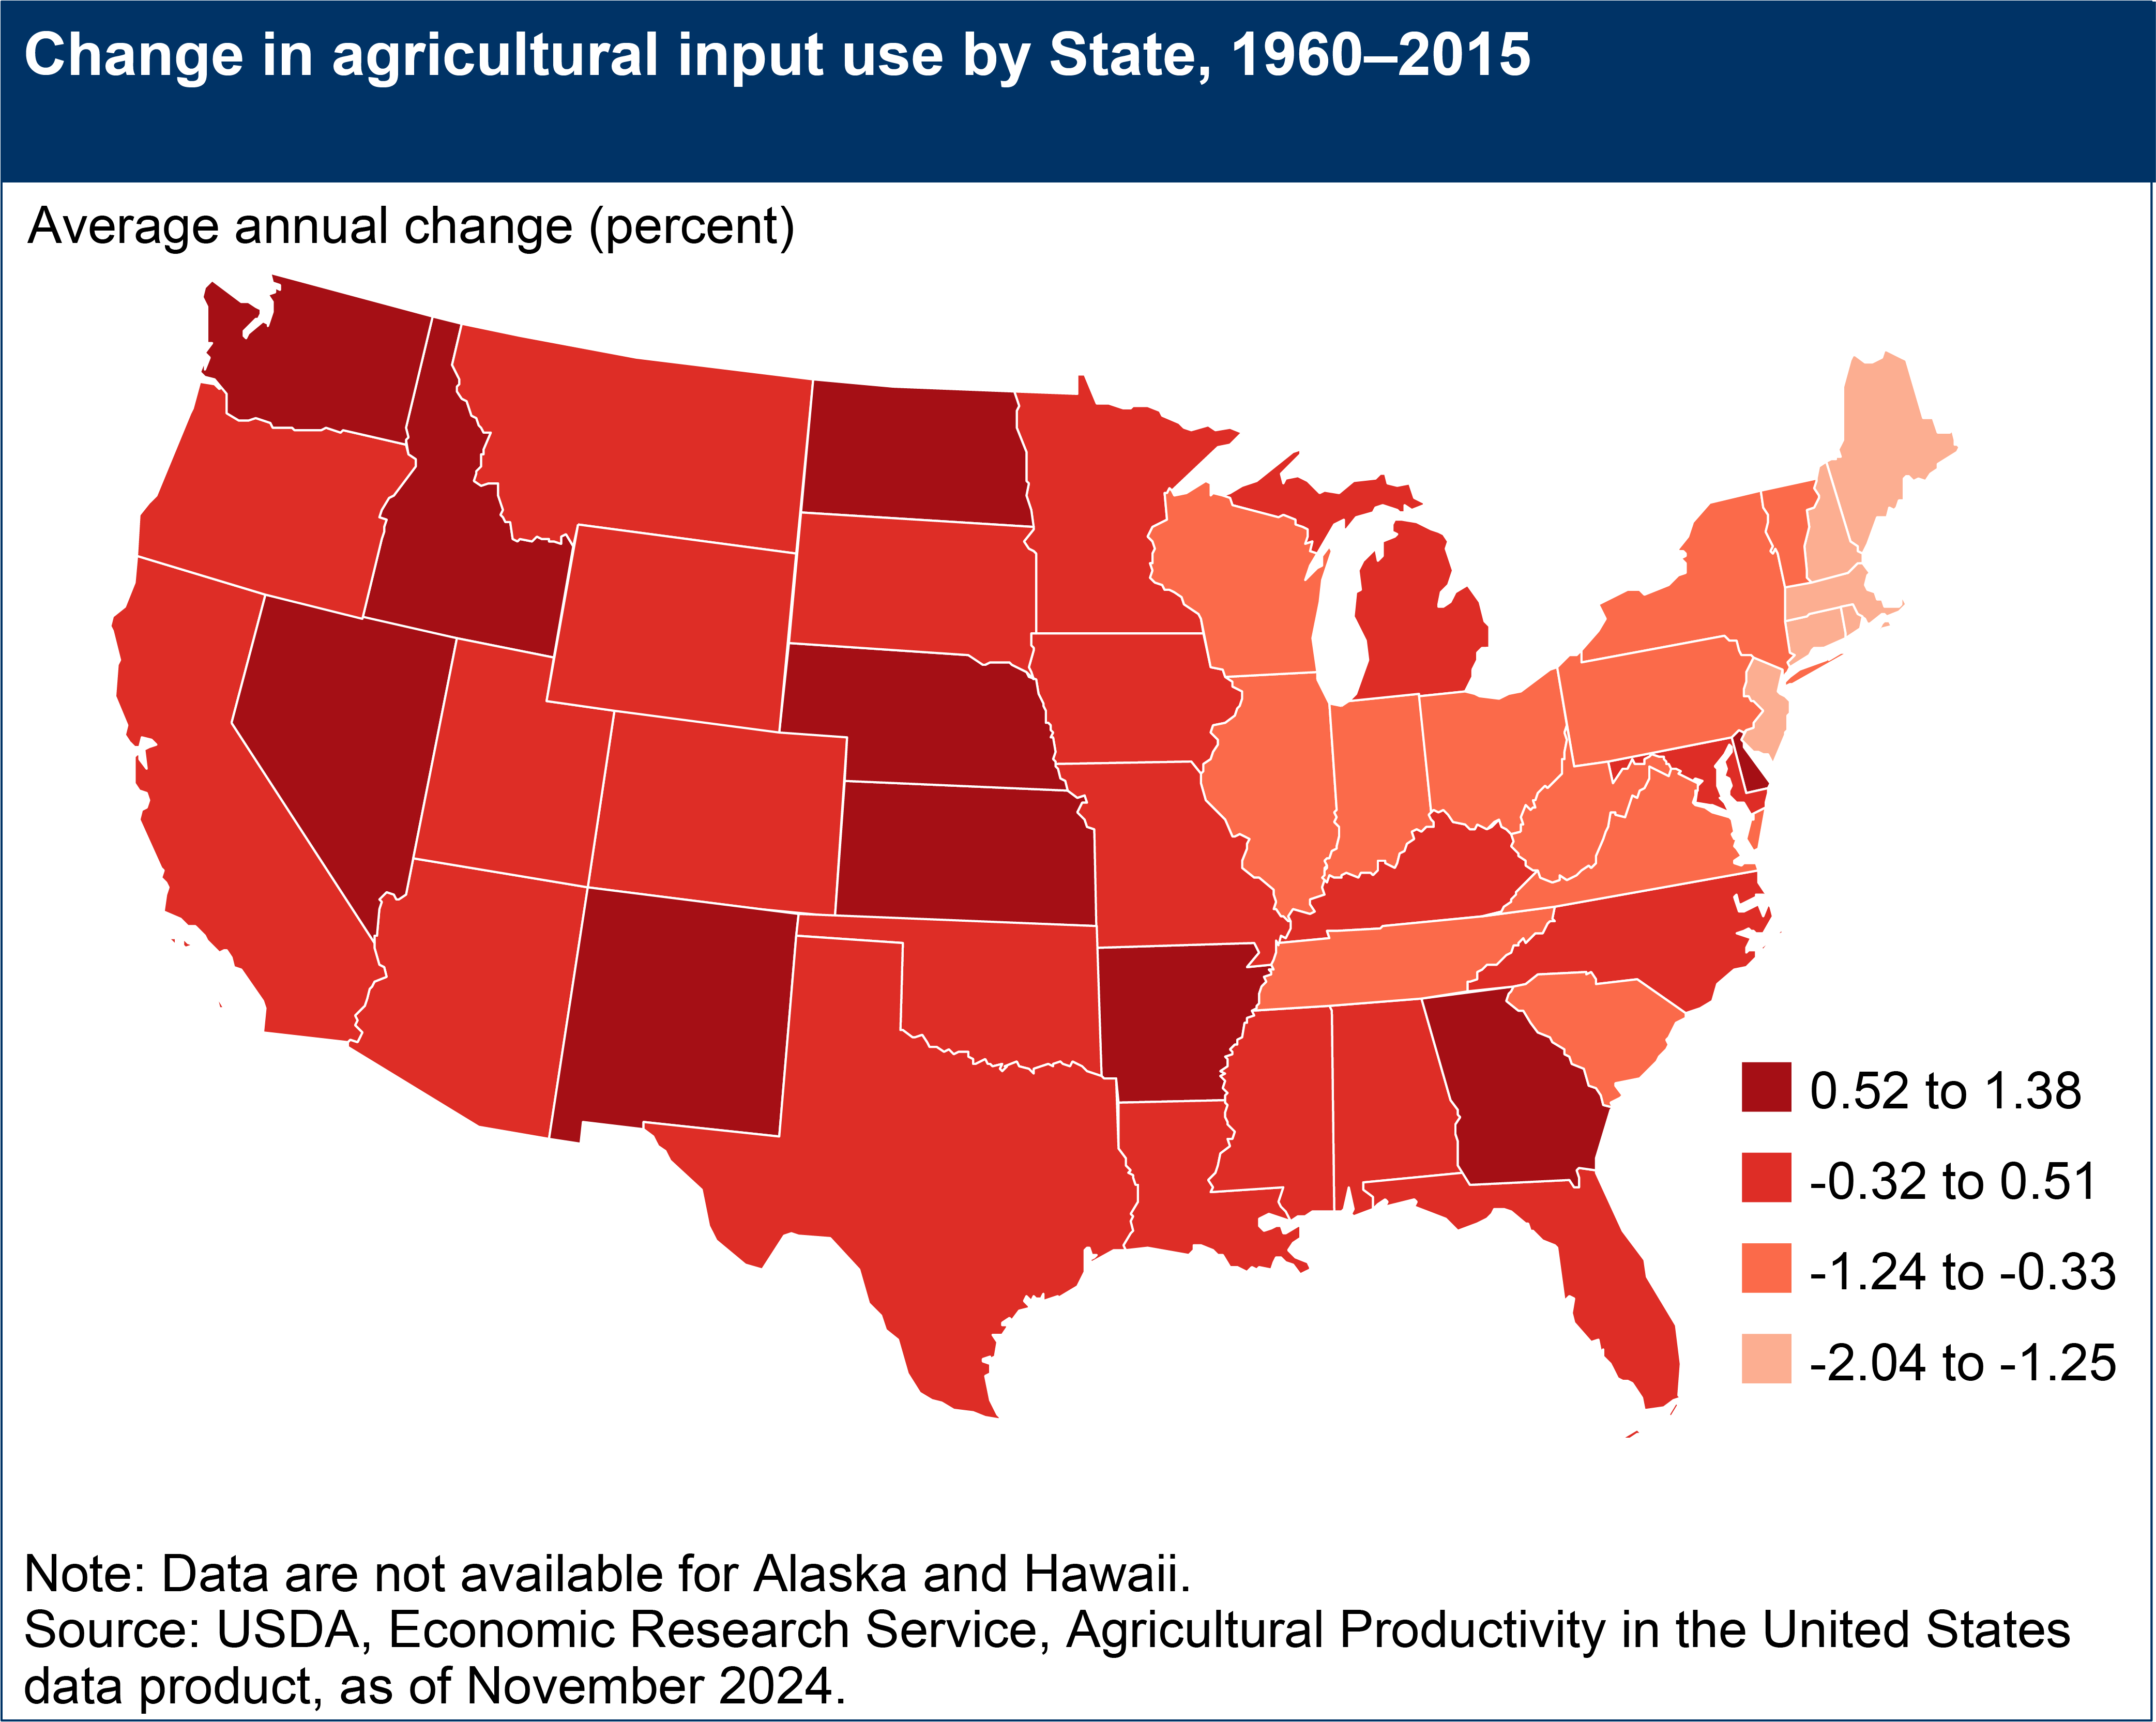
USDA also produced—for the years 1960 through 2015—State-level outputs, inputs, and total factor productivity measures (annual growth rates as well as cross-State differences in levels). The full detail of State-level data is available in table 2 (see all data tables). State estimates are not made for Alaska and Hawaii, as some major data are not available for the entire period.
- According to the estimates, every State exhibited a positive average annual productivity growth rate between 1960 and 2015, ranging from 0.23 percent for New Mexico to 1.95 percent for Ohio.
- In 2015, the top 5 States with the highest TFP levels were California, Florida, Delaware, Iowa, and North Carolina.
- TFP growth is the major source of agricultural output growth from 1960 to 2015 for all States except New Mexico, Nevada, and Oklahoma, where average annual input growth rates were higher than TFP growth rates.
Download chart image | Chart data
Download chart image | Chart data