
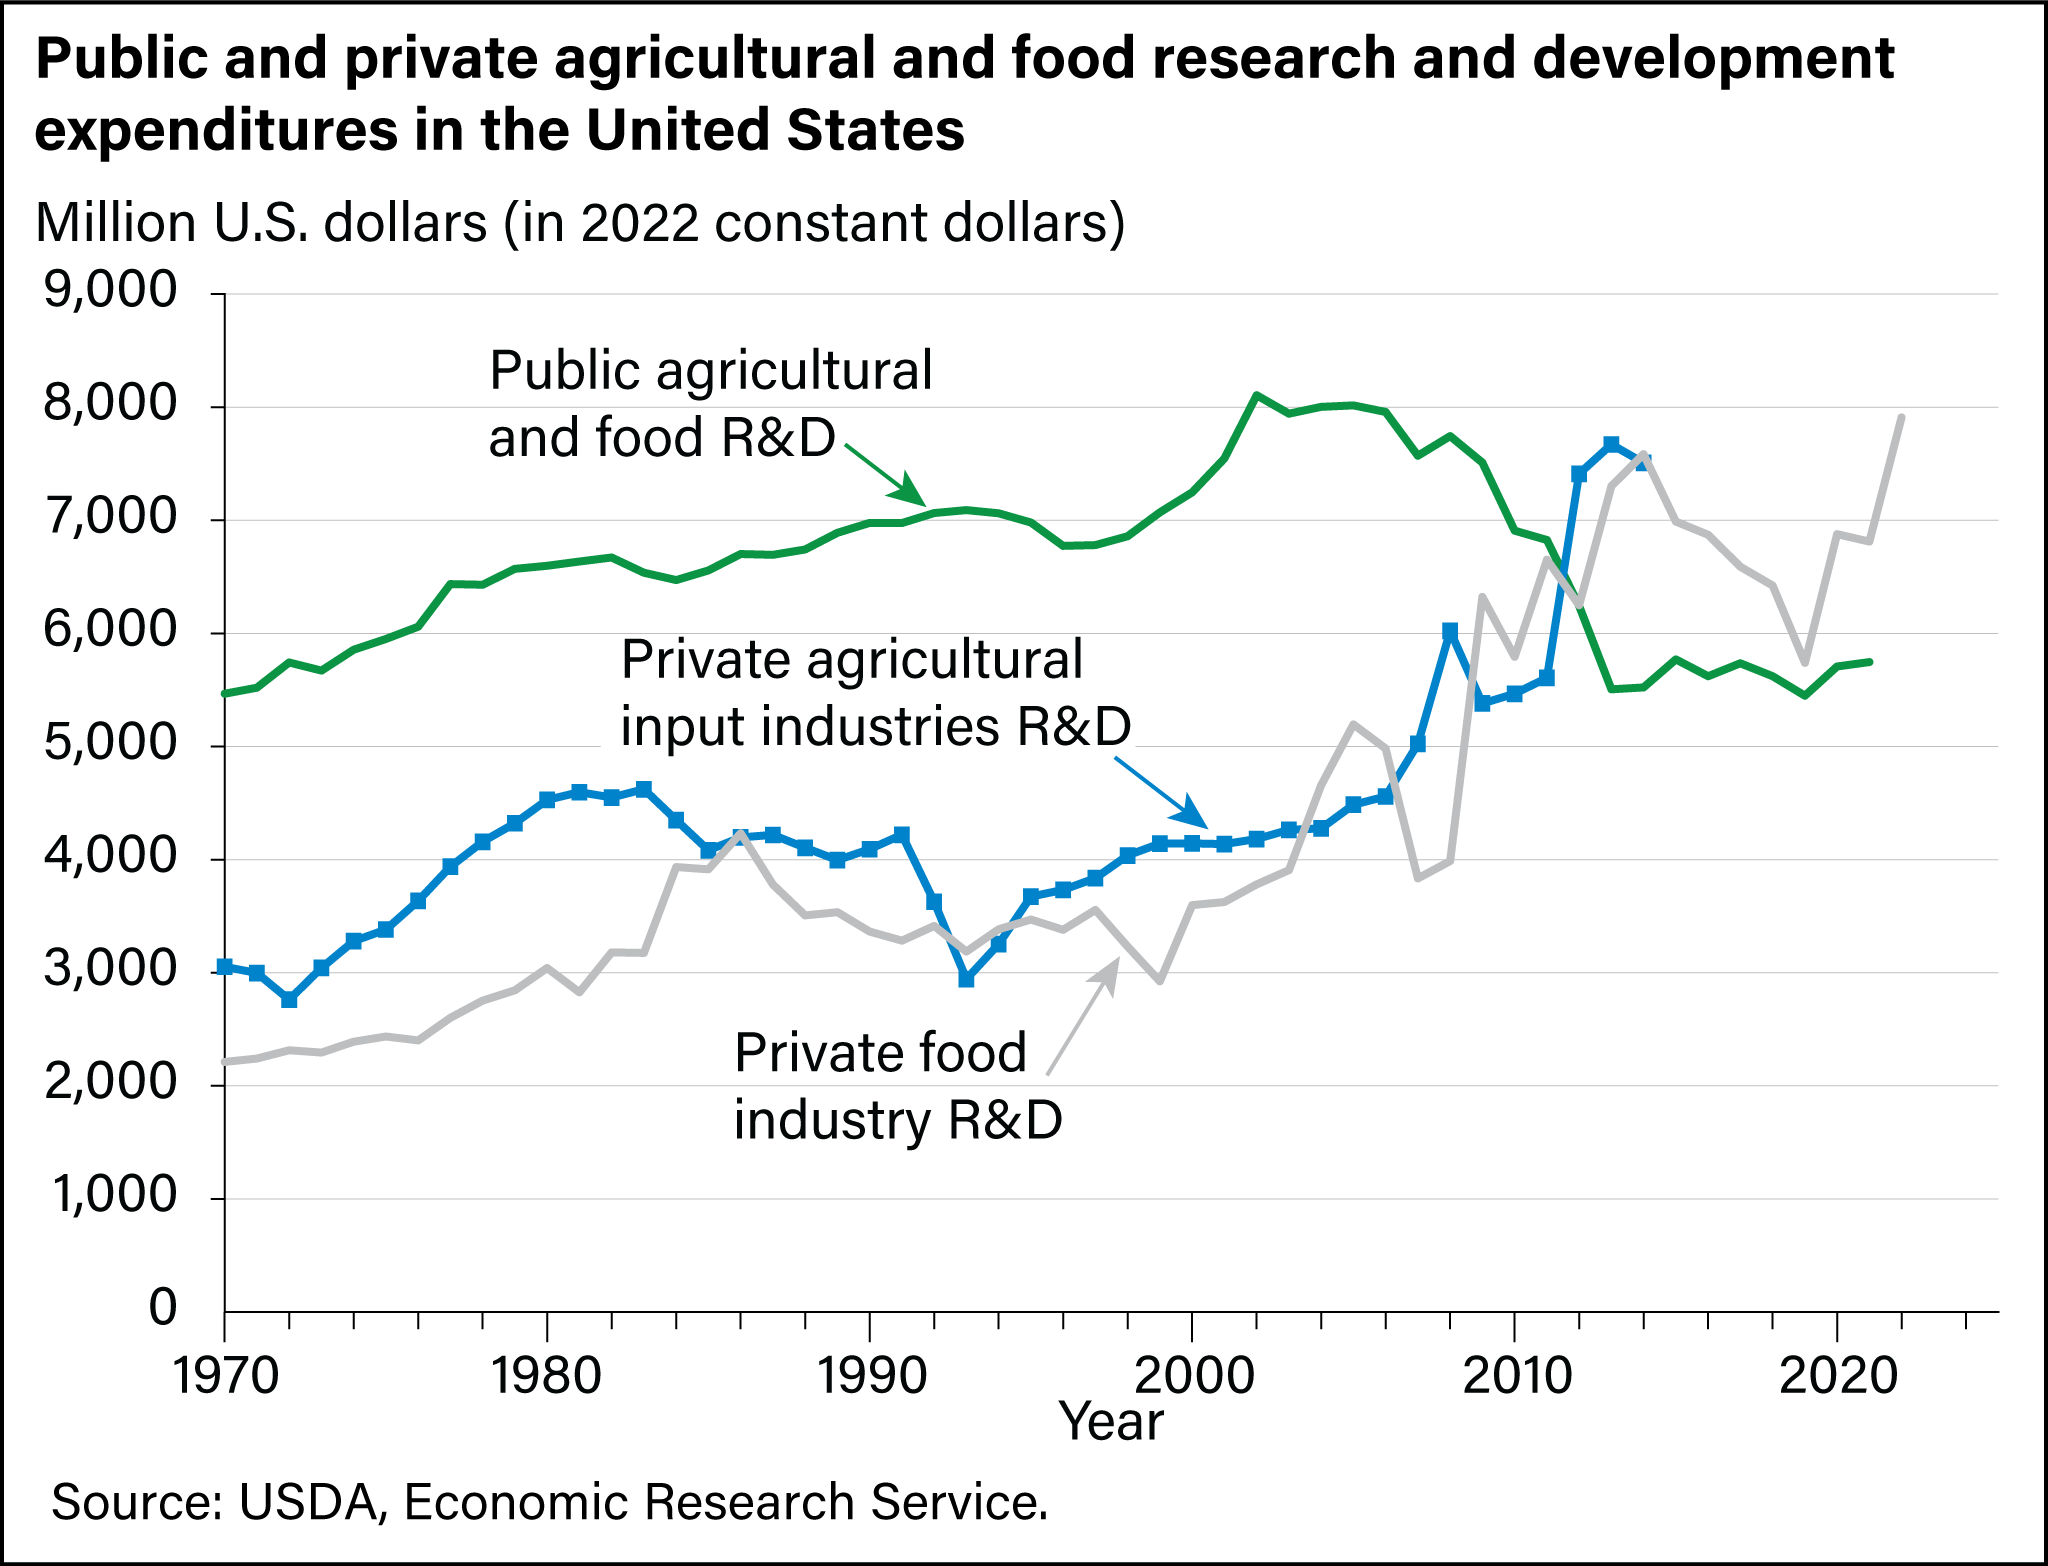
This data product reports on public and private expenditures for agricultural and food research and development (R&D) in the United States. Public agricultural R&D spending is reported annually for 1970-2021, except for R&D expenditures for USDA intramural research agencies which is reported for 1970-2022. Private food industry R&D is also reported for 1970-2022. R&D spending by private agricultural input industries is reported for 1970-2014. R&D expenditures are shown in current dollars and in constant dollars (adjusted for inflation in the cost of research).
Public R&D expenditures are constructed by USDA, Economic Research Service, based on data from two sources:
-
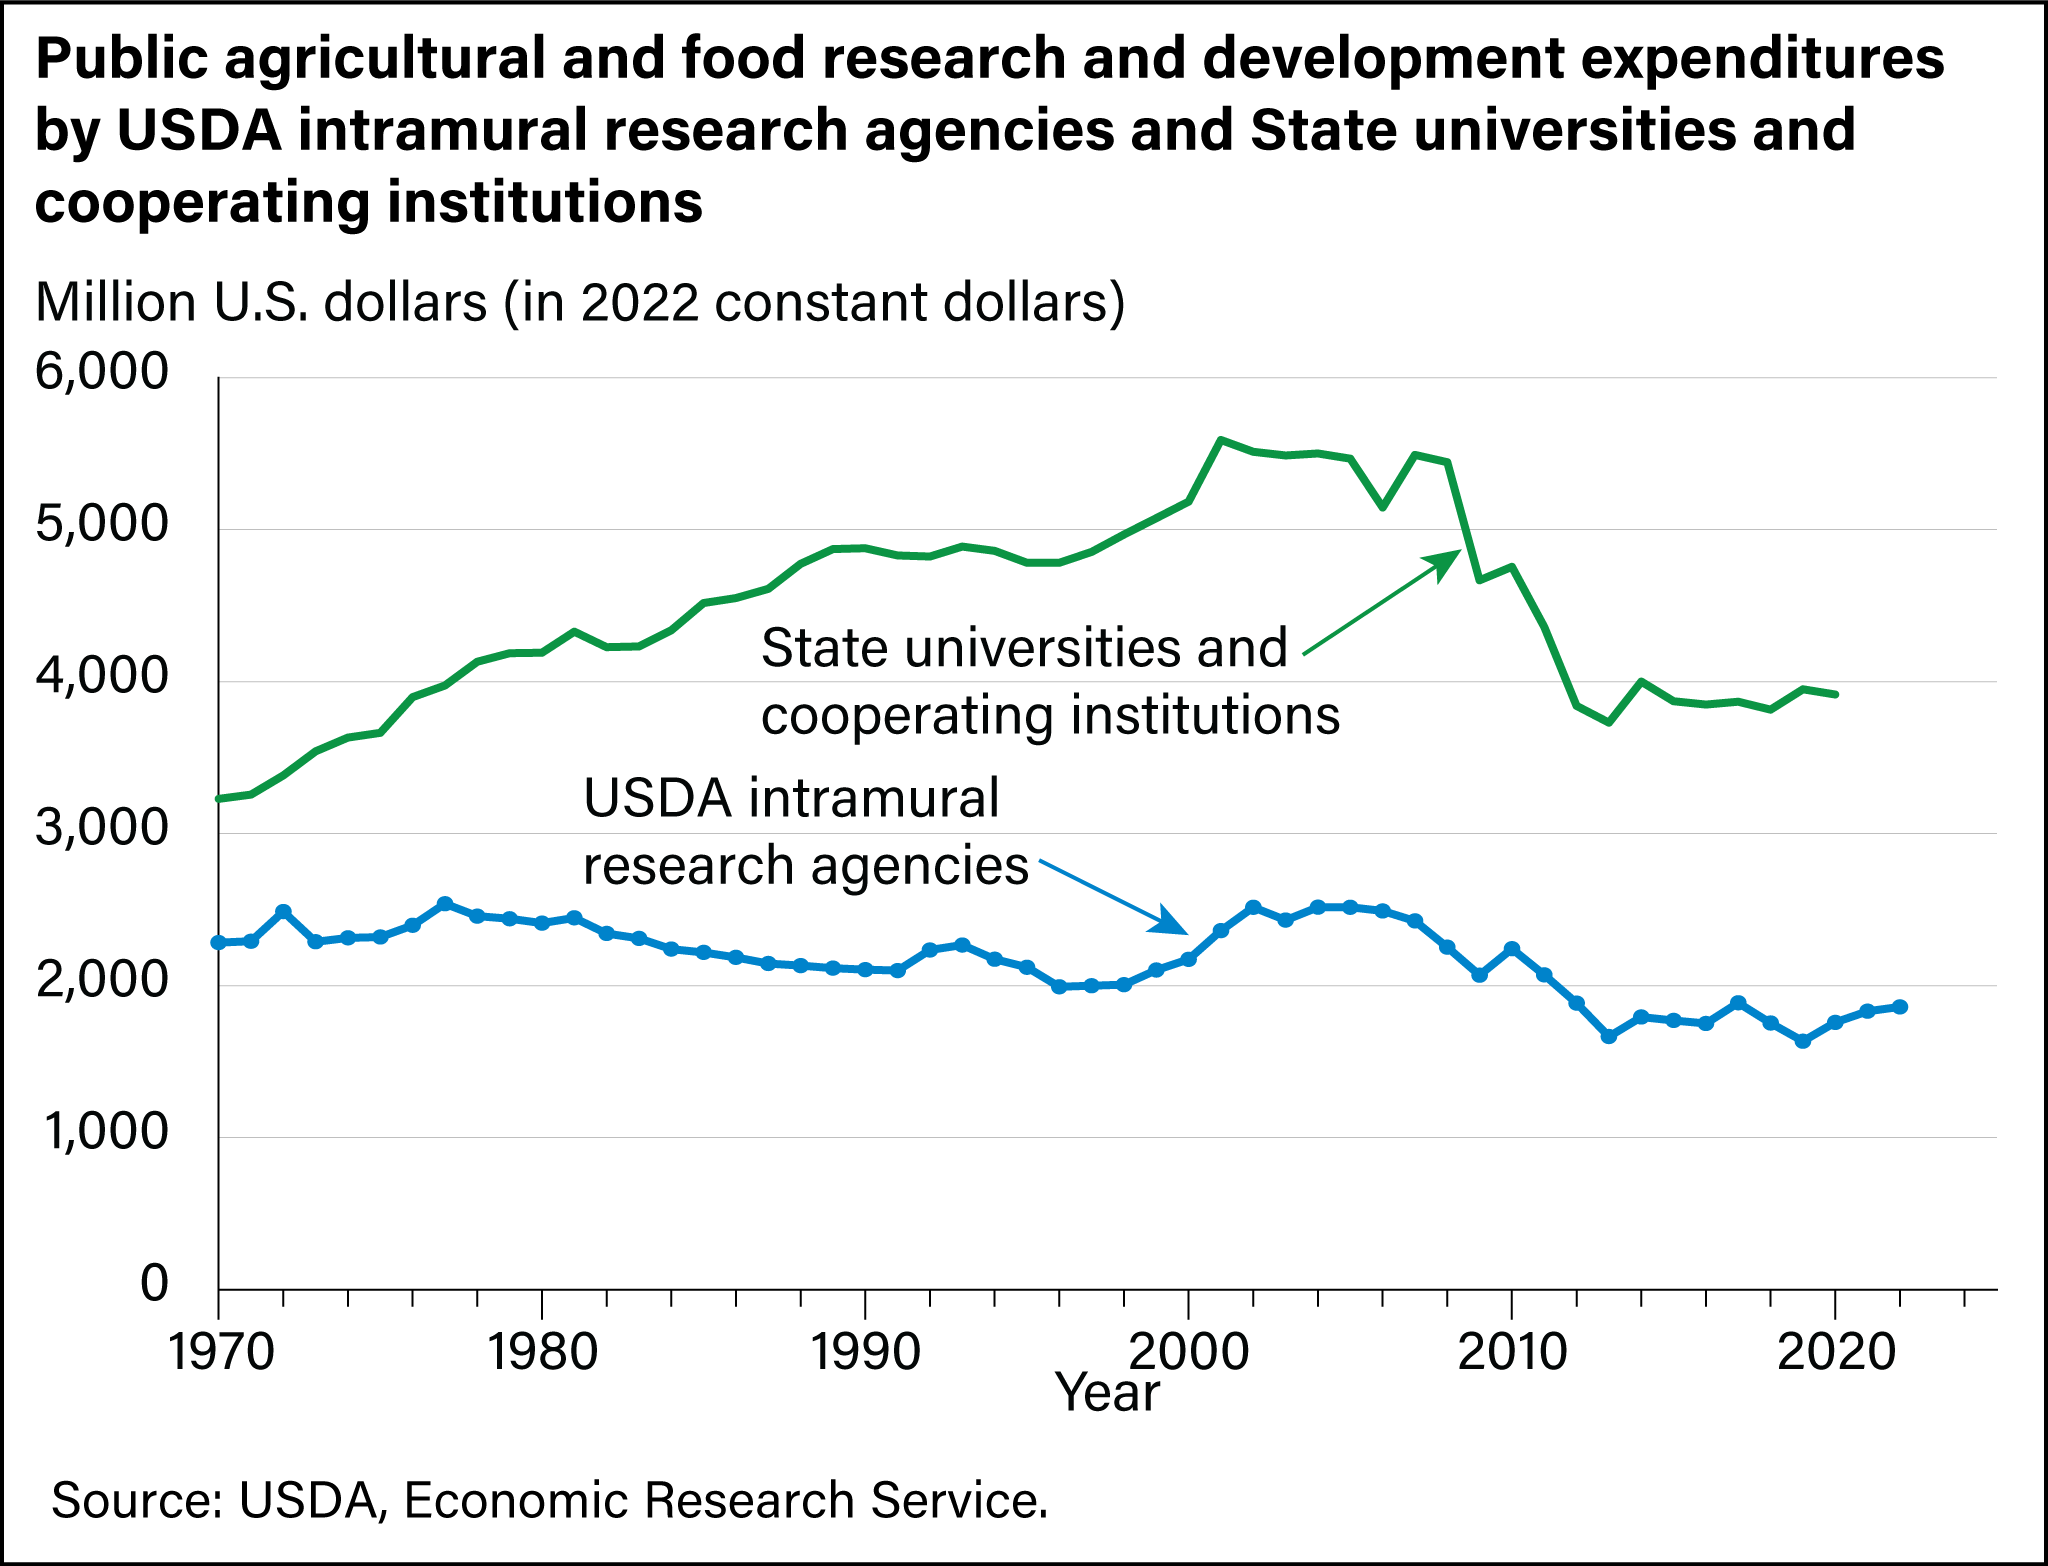
R&D expenditures by USDA intramural research agencies are from the National Science Foundation's (NSF) Survey of Federal Funds for Research and Development.
-
R&D expenditures by State land grant universities and other cooperating institutions for 2002-2021 are from the National Institute for Food and Agriculture’s (NIFA) Research, Education, and Economics Information system (REEIS) data portal. For 1970-2001, R&D expenditures came from the Current Research Inventory System (CRIS) annual Inventory of Agricultural Research and Annual Funding Summaries (discontinued NIFA publications).
Private R&D expenditures are constructed by ERS, based on the methodology described in the ERS report:
- Research Investments and Market Structure in the Food Processing, Agricultural Input, and Biofuel Industries Worldwide (ERR-130, December 2011).
Private agricultural and food R&D includes R&D by business firms in food, beverage and tobacco manufacturing industry and agricultural input supply industries. Private agricultural input industries research is more likely to have impacts on agricultural productivity than private food industry research, so these components of private research are also reported separately.
Research expenditures (in current dollars) are not adjusted for price inflation. Research expenditures (in constant dollars) are adjusted for inflation, using the Biomedical Research and Development Price Index (BRDPI) from the U.S. National Institutes of Health.
For more details, see Documentation and Definitions and Related Resources below. Note that the series methodology and estimates have been revised with this release, see the Update and Revision History for details.
Public agricultural and food R&D is funded and carried out through a Federal-State partnership. Federal, State, and nongovernment sources jointly fund this research, which is performed by USDA intramural research agencies and State universities and cooperating institutions. State research performers include land grant universities, veterinary schools, forestry schools, and other universities and laboratories.
Errata: With the April 28, 2025 update, ERS corrected the data series on public agricultural R&D expenditures by eliminating double-counting of R&D expenditures in cooperative research agreements between USDA intramural research agencies and State Land Grant Universities. This reduced total expenditures by 2-3 percent over 1970-2019.