ERS monitors the food security of U.S. households through an annual, nationally representative survey. While most U.S. households are food secure, a minority of U.S. households experience food insecurity at times during the year, meaning that their access to adequate food for active, healthy living is limited by lack of money and other resources. Some experience very low food security, a more severe range of food insecurity where food intake of one or more members is reduced and normal eating patterns are disrupted. Reliable monitoring of food security contributes to the effective operation of USDA’s food and nutrition assistance programs aimed at reducing food insecurity. USDA administers 16 domestic food and nutrition assistance programs that affect the lives of millions of people and account for roughly two-thirds of USDA’s annual budget. Over a typical year, about one in four people in the United States participates in at least one of these programs.
Food Security and Nutrition Assistance
- Updated: 1/8/2025
- Contact: Anikka Martin
-
The prevalence of food insecurity increased in 2023 compared with 2022
- by Matthew P. Rabbitt, Laura J. Hales and Madeline Reed-Jones
- 9/9/2024
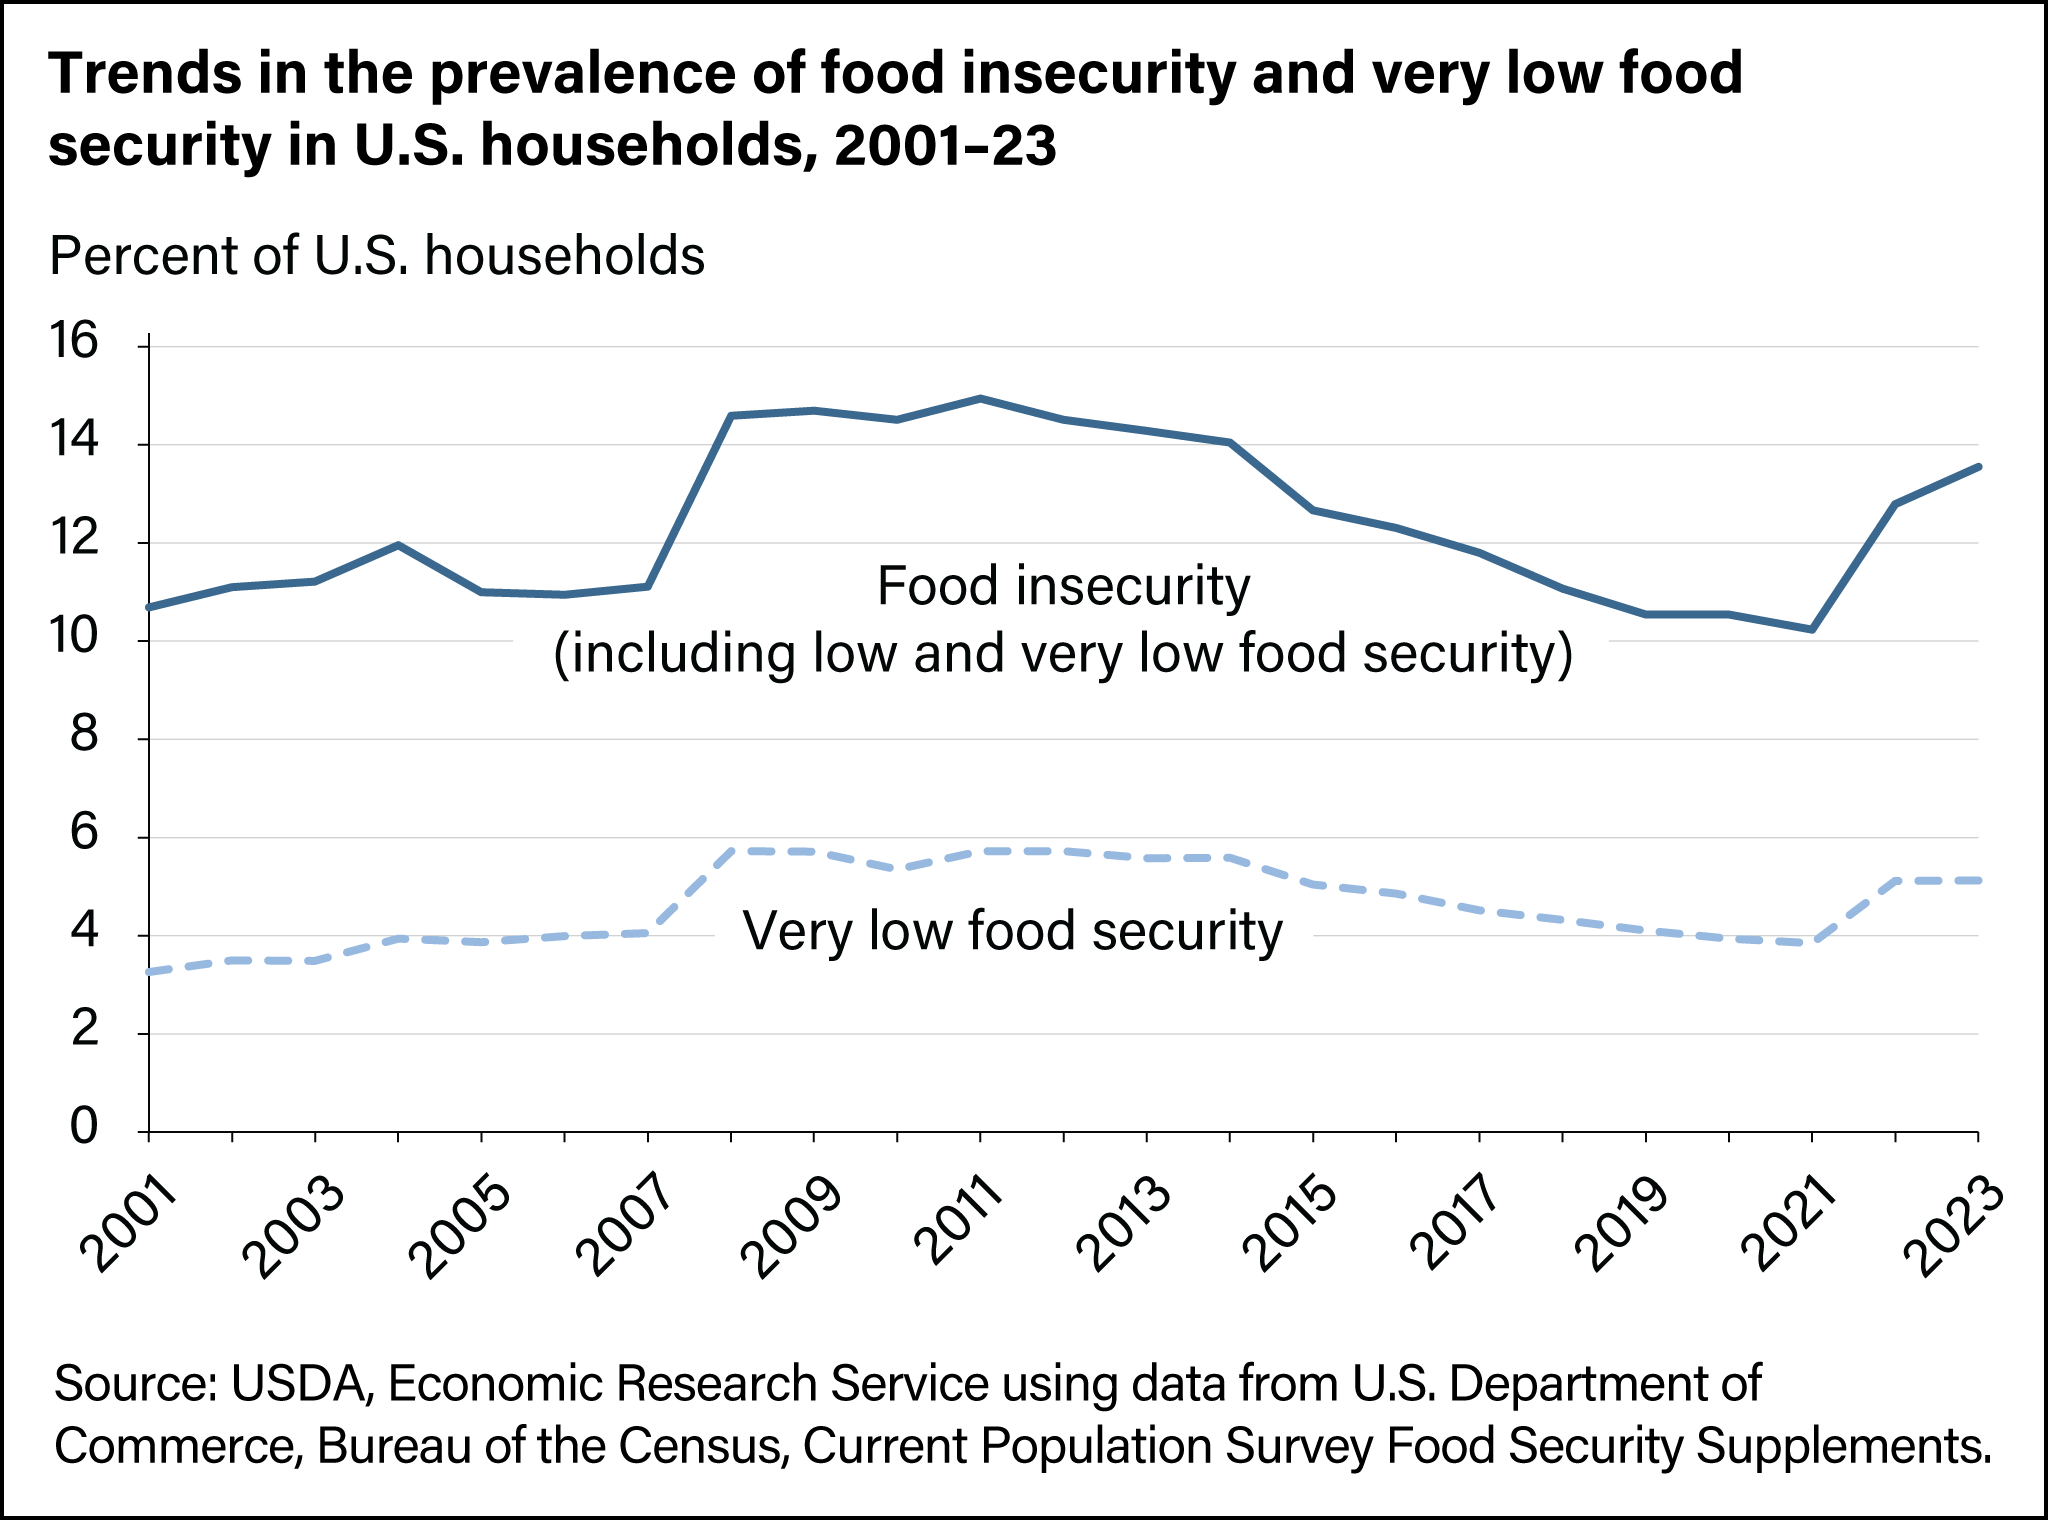
In 2023, 13.5 percent of U.S. households were food insecure at least some time during the year, meaning the households had difficulty providing enough food for all their members because of a lack of resources. The 13.5 percent of food-insecure households (18.0 million households) includes 5.1 percent (6.8 million) that experienced very low food security, a more severe form of food insecurity in which the food intake of some household members was reduced and normal eating patterns were disrupted. The 2023 prevalence rate of food insecurity was statistically significantly higher than the rate recorded in 2022 (12.8 percent). -
Food insecurity rates are highest for households with incomes below the poverty line and single-mother households
- by Matthew P. Rabbitt, Laura J. Hales and Madeline Reed-Jones
- 9/9/2024
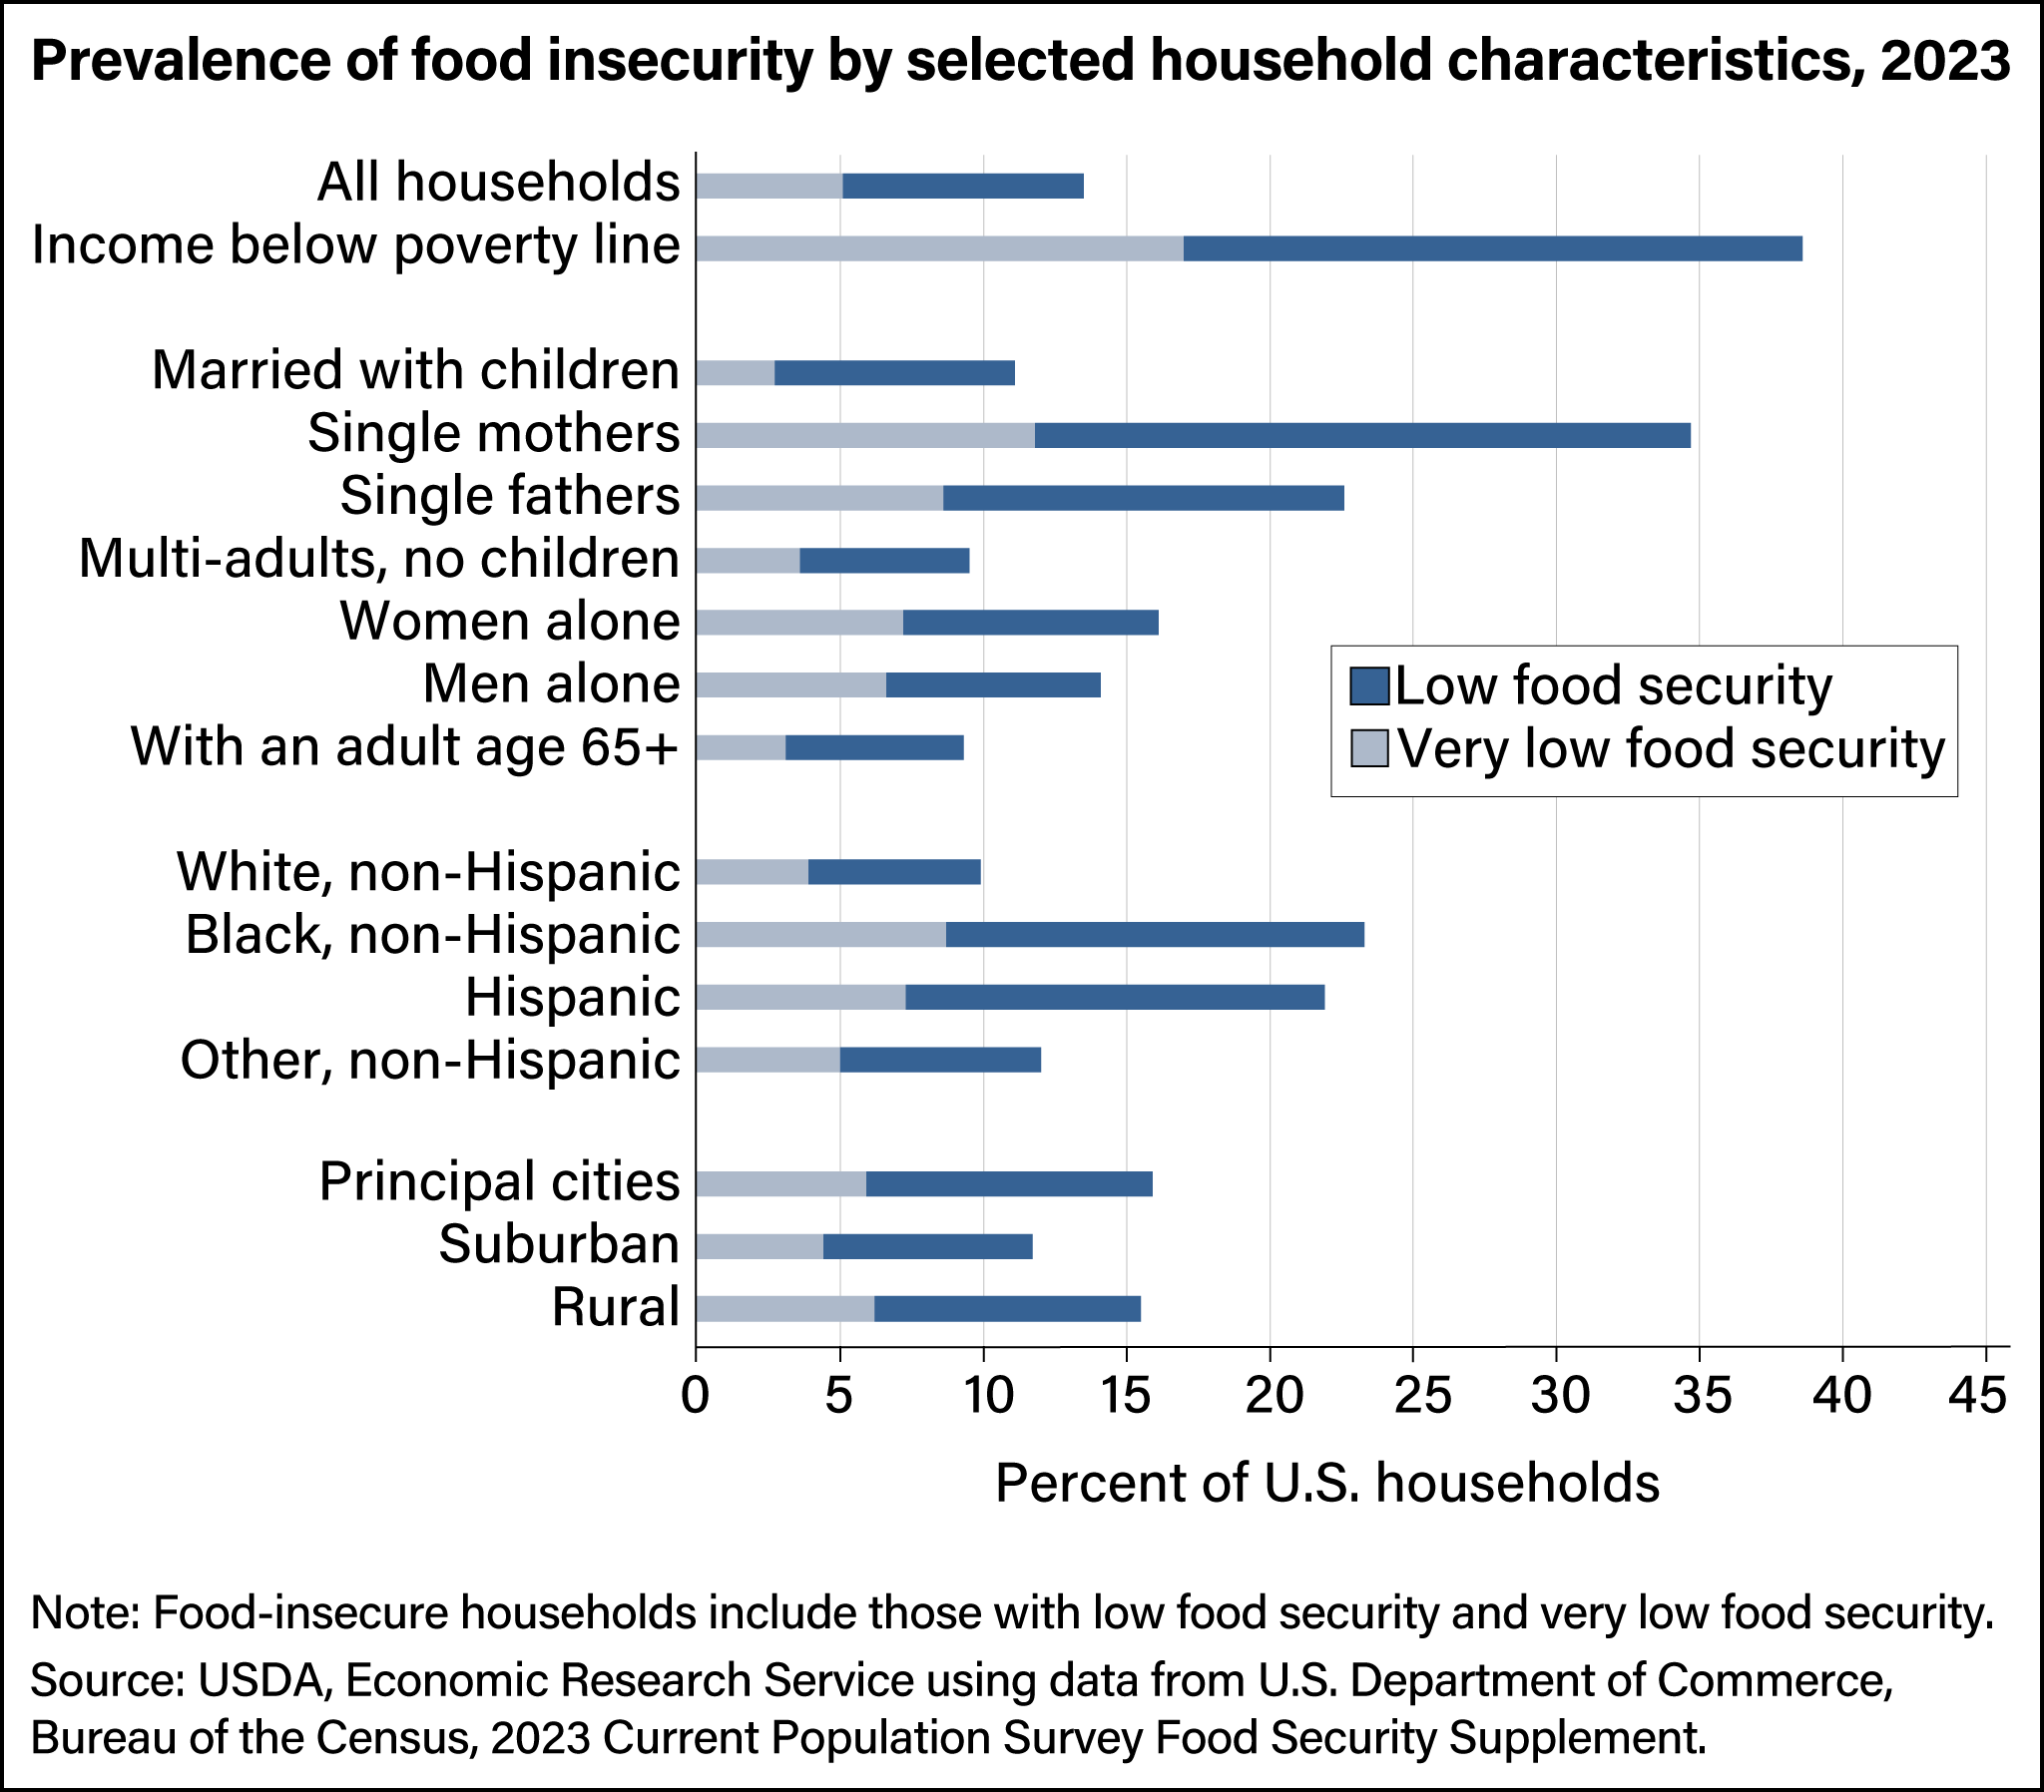
In 2023, 38.7 percent of households with incomes below the Federal poverty line were food insecure. Food-insecure households include those with low food security and very low food security. Rates of food insecurity were also significantly higher than the national average of 13.5 percent for single-parent households, women living alone, Black and Hispanic households, and households in principal cities and rural areas. -
In 2023, 17.9 percent of households with children were affected by food insecurity
- by Matthew P. Rabbitt, Laura J. Hales and Madeline Reed-Jones
- 9/9/2024
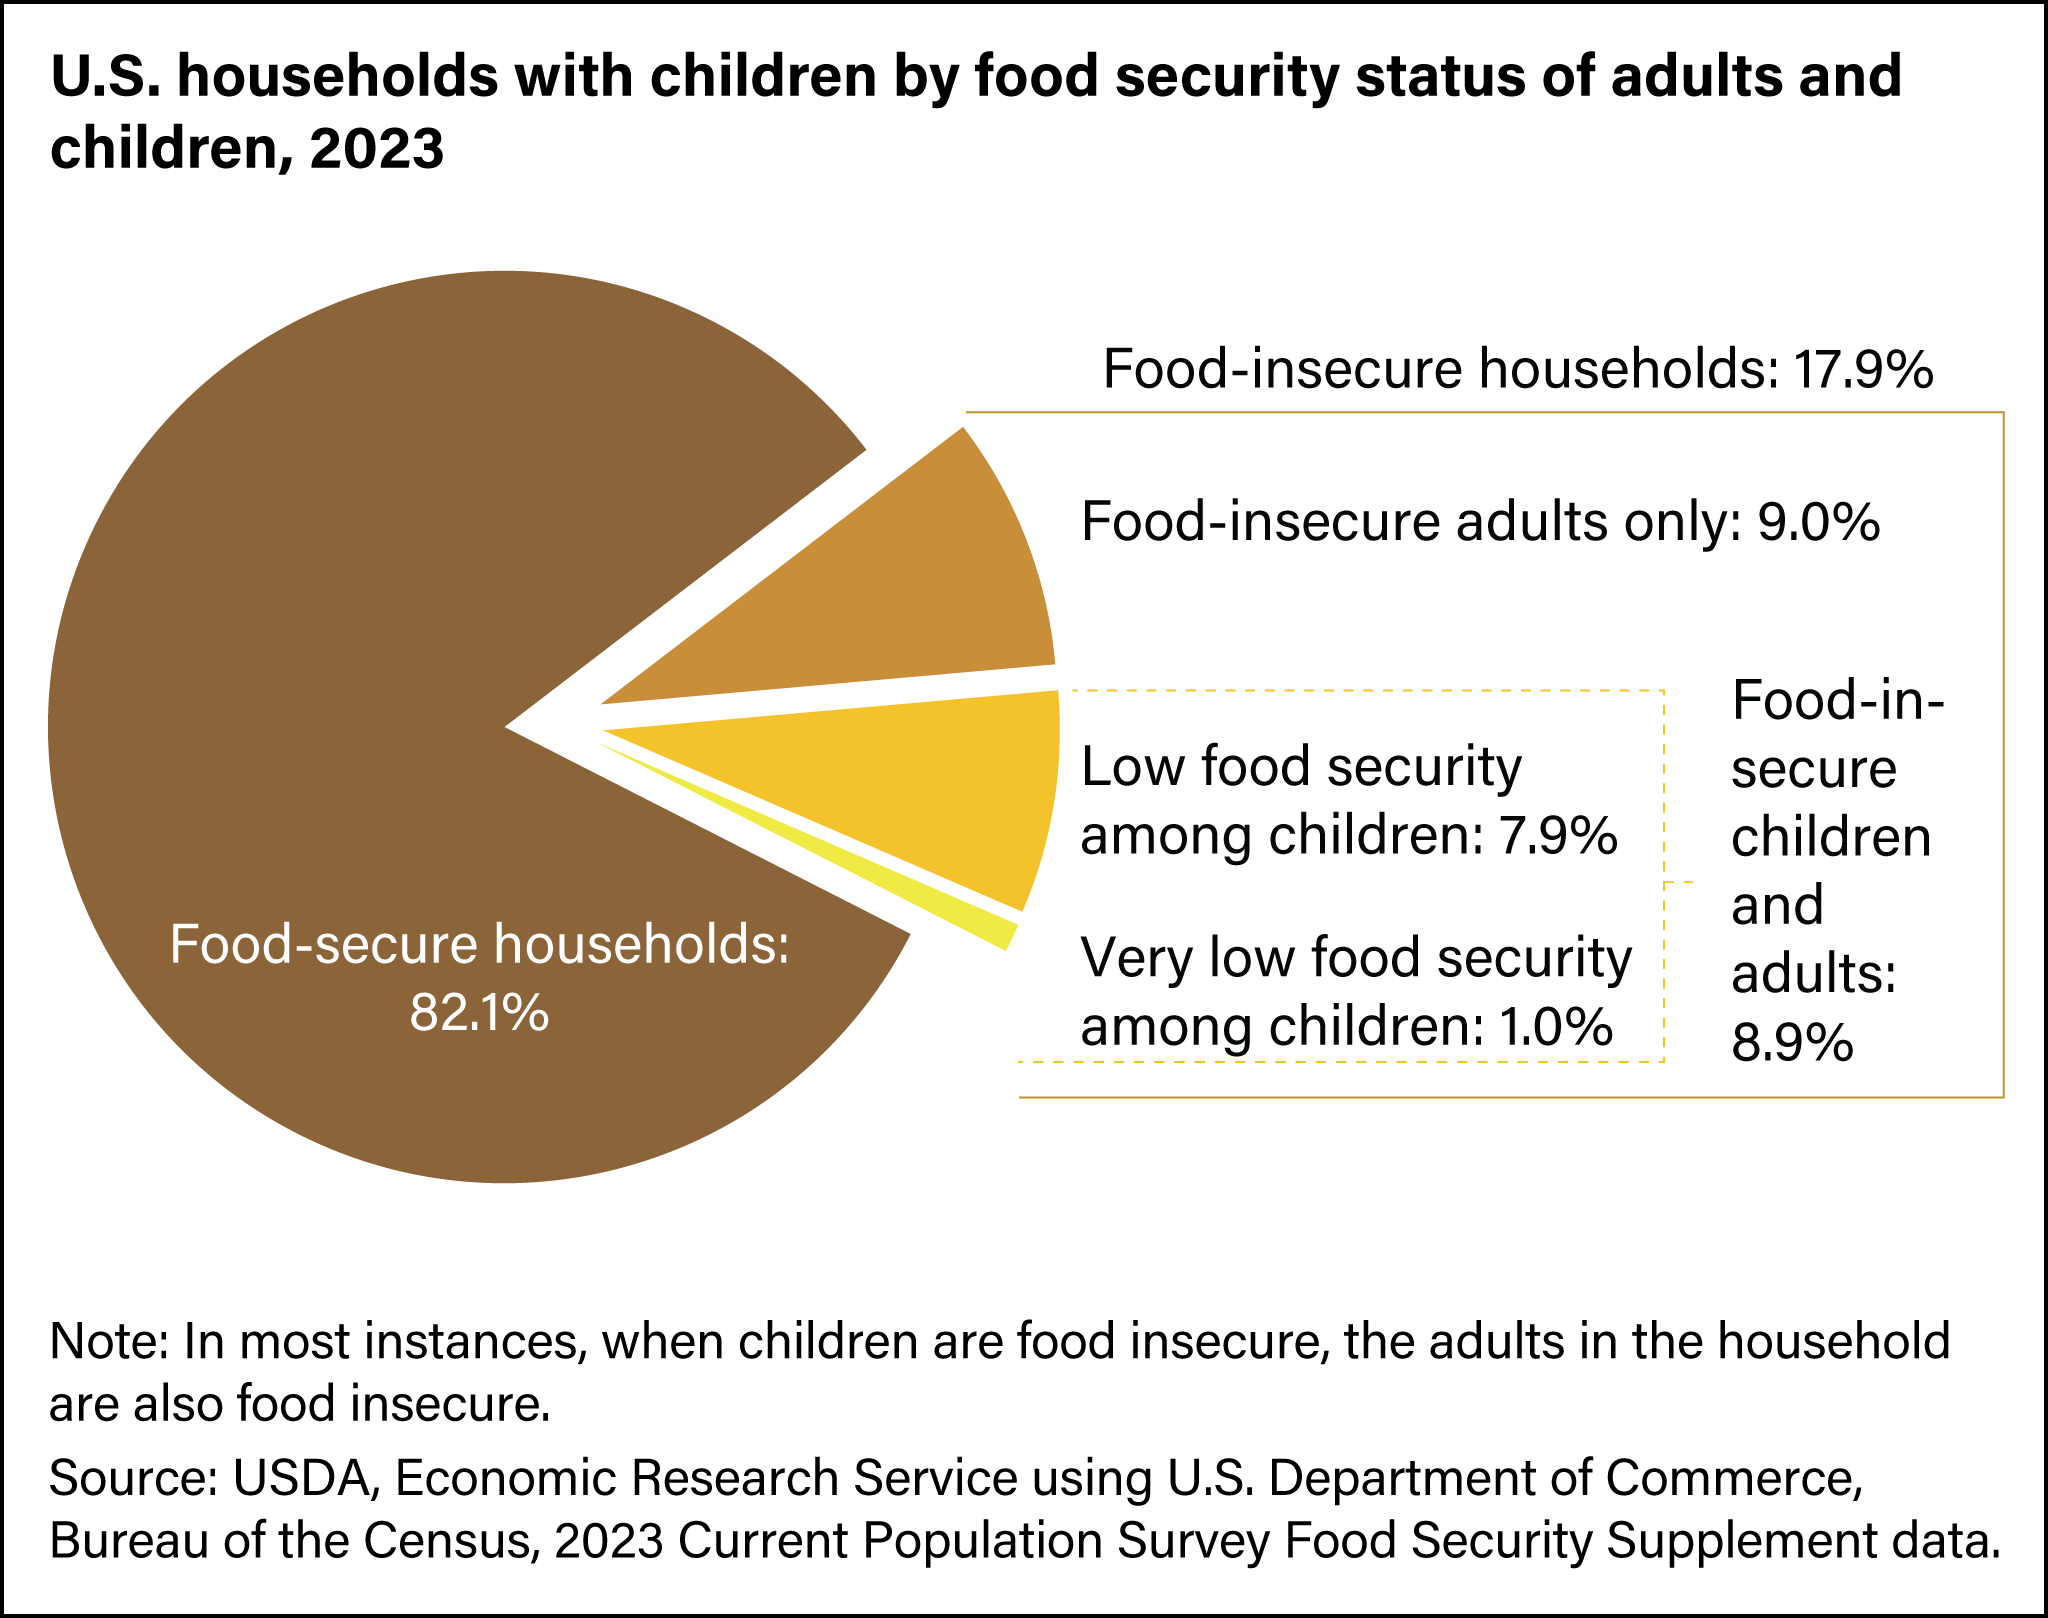
Parents often shield children from experiencing food insecurity, particularly very low food security, even when the parents themselves are food insecure. In 2023, 17.9 percent of households with children were food insecure. In about half of those food-insecure households with children, only the adults experienced food insecurity. But in 8.9 percent of households with children, both children and adults were food insecure sometime during the year. In 1.0 percent of U.S. households with children (374,000 households), both children and adults experienced instances of very low food security. -
Prevalence of food insecurity varies across States
- by Matthew P. Rabbitt, Laura J. Hales and Madeline Reed-Jones
- 9/9/2024
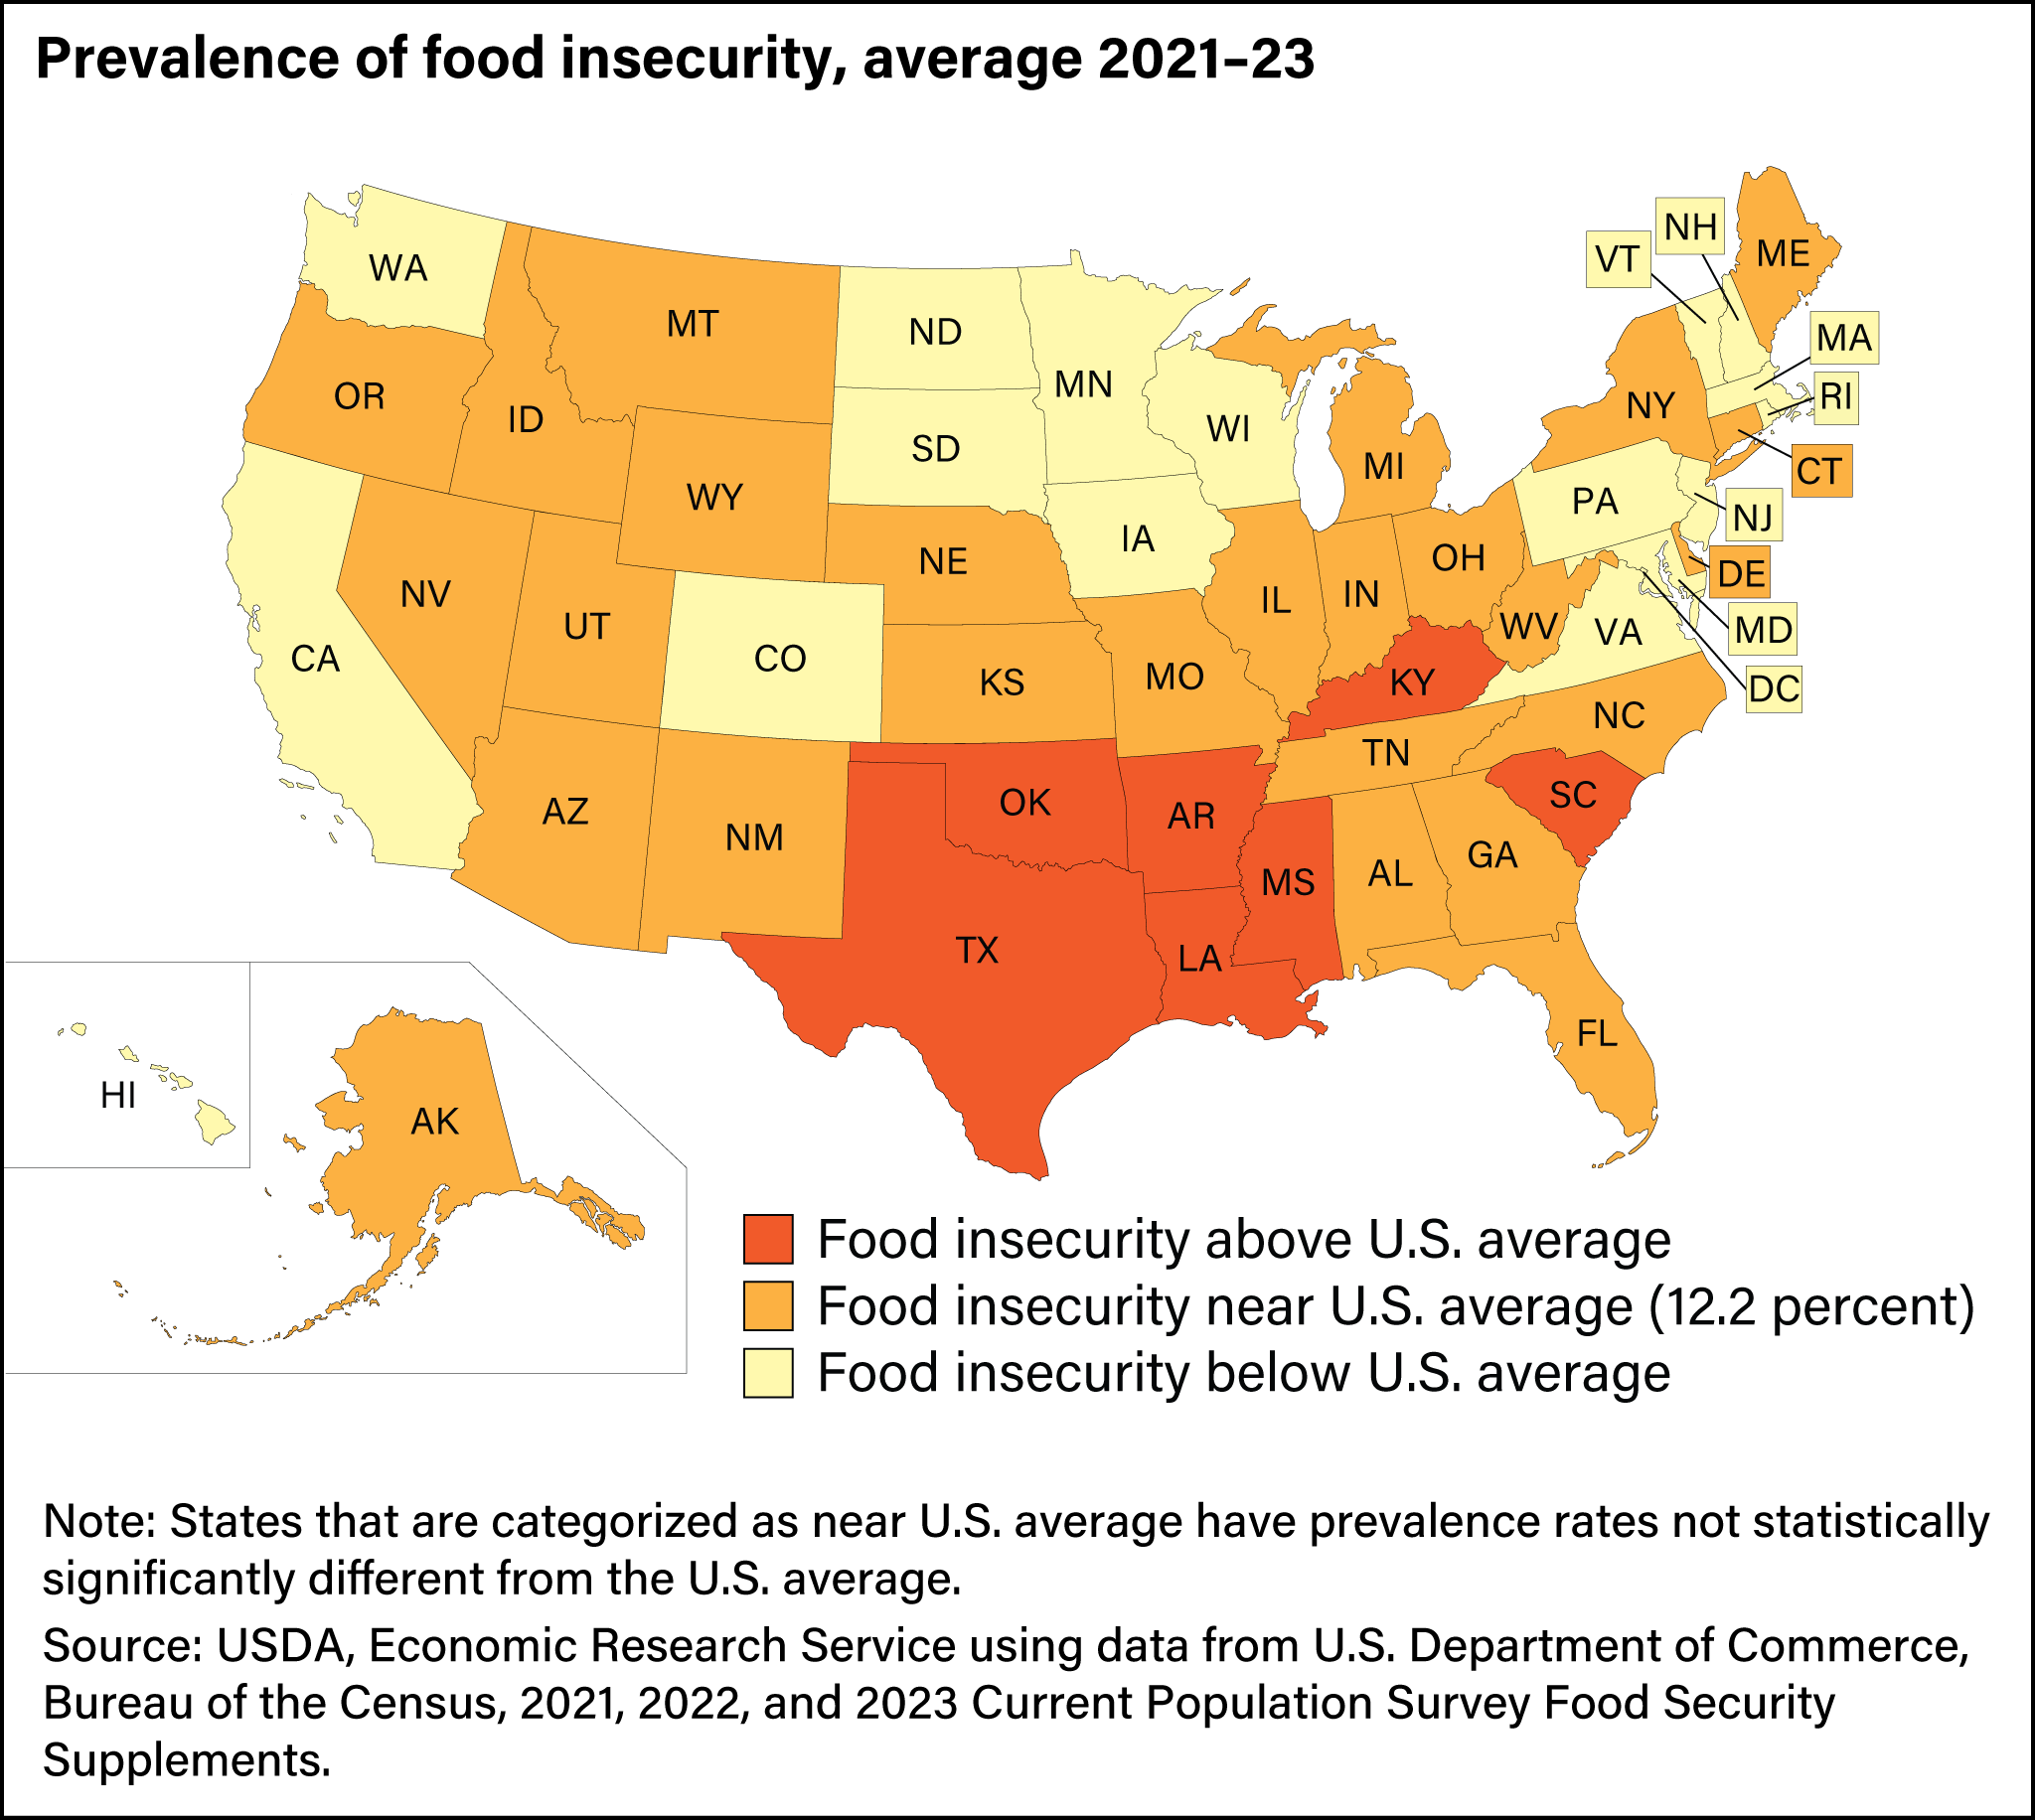
Food insecurity rates differ across States due to both the characteristics of their populations and to State-level policies and economic conditions. The estimated prevalence of food insecurity during 2021–23 ranged from 7.4 percent of households in New Hampshire to 18.9 percent in Arkansas (data for 2021–23 were combined to provide more reliable statistics at the State level). -
Total spending on USDA’s food and nutrition assistance programs fell in fiscal year 2023
- by Jordan W. Jones and Saied Toossi
- 7/22/2024
Federal spending on USDA's food and nutrition assistance programs totaled $166.4 billion in fiscal year 2023, 13 percent less than fiscal year 2022, adjusted for inflation. Inflation-adjusted spending on the Supplemental Nutrition Assistance Program (SNAP), the largest USDA nutrition assistance program, was 9 percent lower than the previous year. Spending on the Special Supplemental Nutrition Program for Women, Infants, and Children (WIC) increased by 11 percent. In fiscal year 2023, combined spending on child nutrition programs decreased by 24 percent compared to fiscal year 2022. Combined spending on other programs fell in fiscal year 2023, primarily due to lower spending on Pandemic Electronic Benefit Transfer (P-EBT) in its final year of operation. -
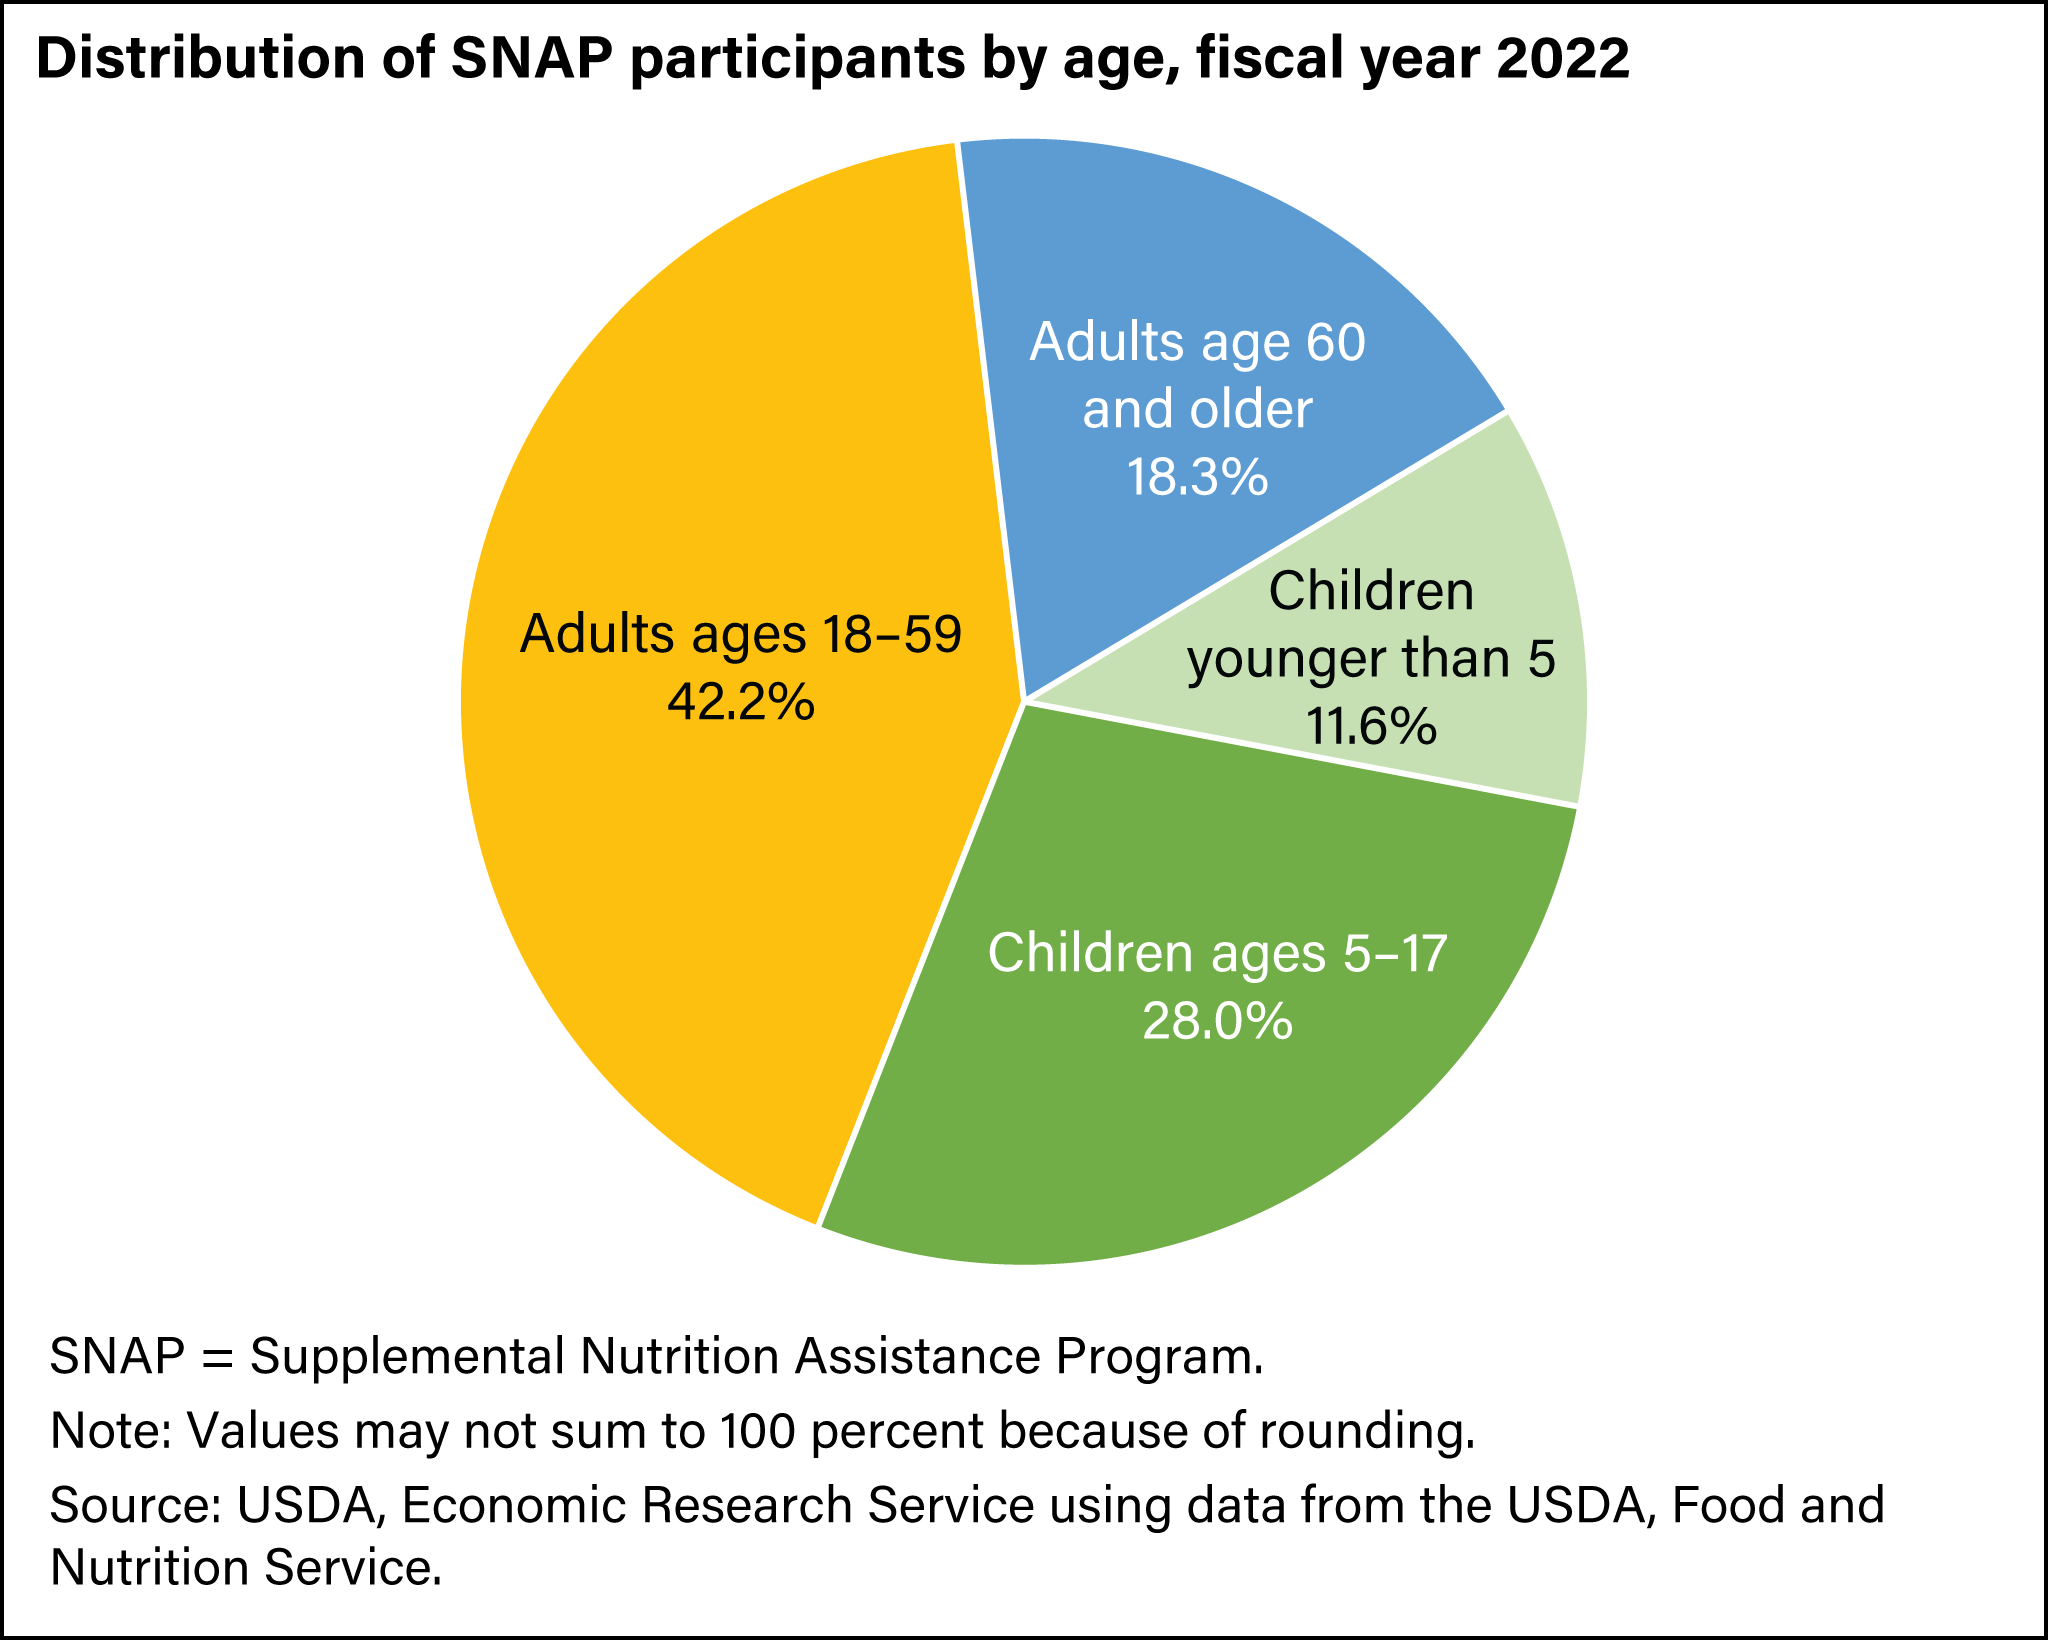
Children accounted for about 40 percent of SNAP participants in fiscal year 2022
- by Jordan W. Jones
- 7/22/2024
In fiscal year 2022, children accounted for about 40 percent of all Supplemental Nutrition Assistance Program (SNAP) participants, down from about 43 percent in fiscal year 2019. Children younger than 5 made up nearly 12 percent of participants, while school-age children made up 28 percent. Adults ages 18–59 represented 42 percent of SNAP participants in fiscal year 2022, similar to fiscal year 2019. The share of the SNAP caseload age 60 and older grew from about 16 percent in fiscal year 2019 to 18 percent in fiscal year 2022. -
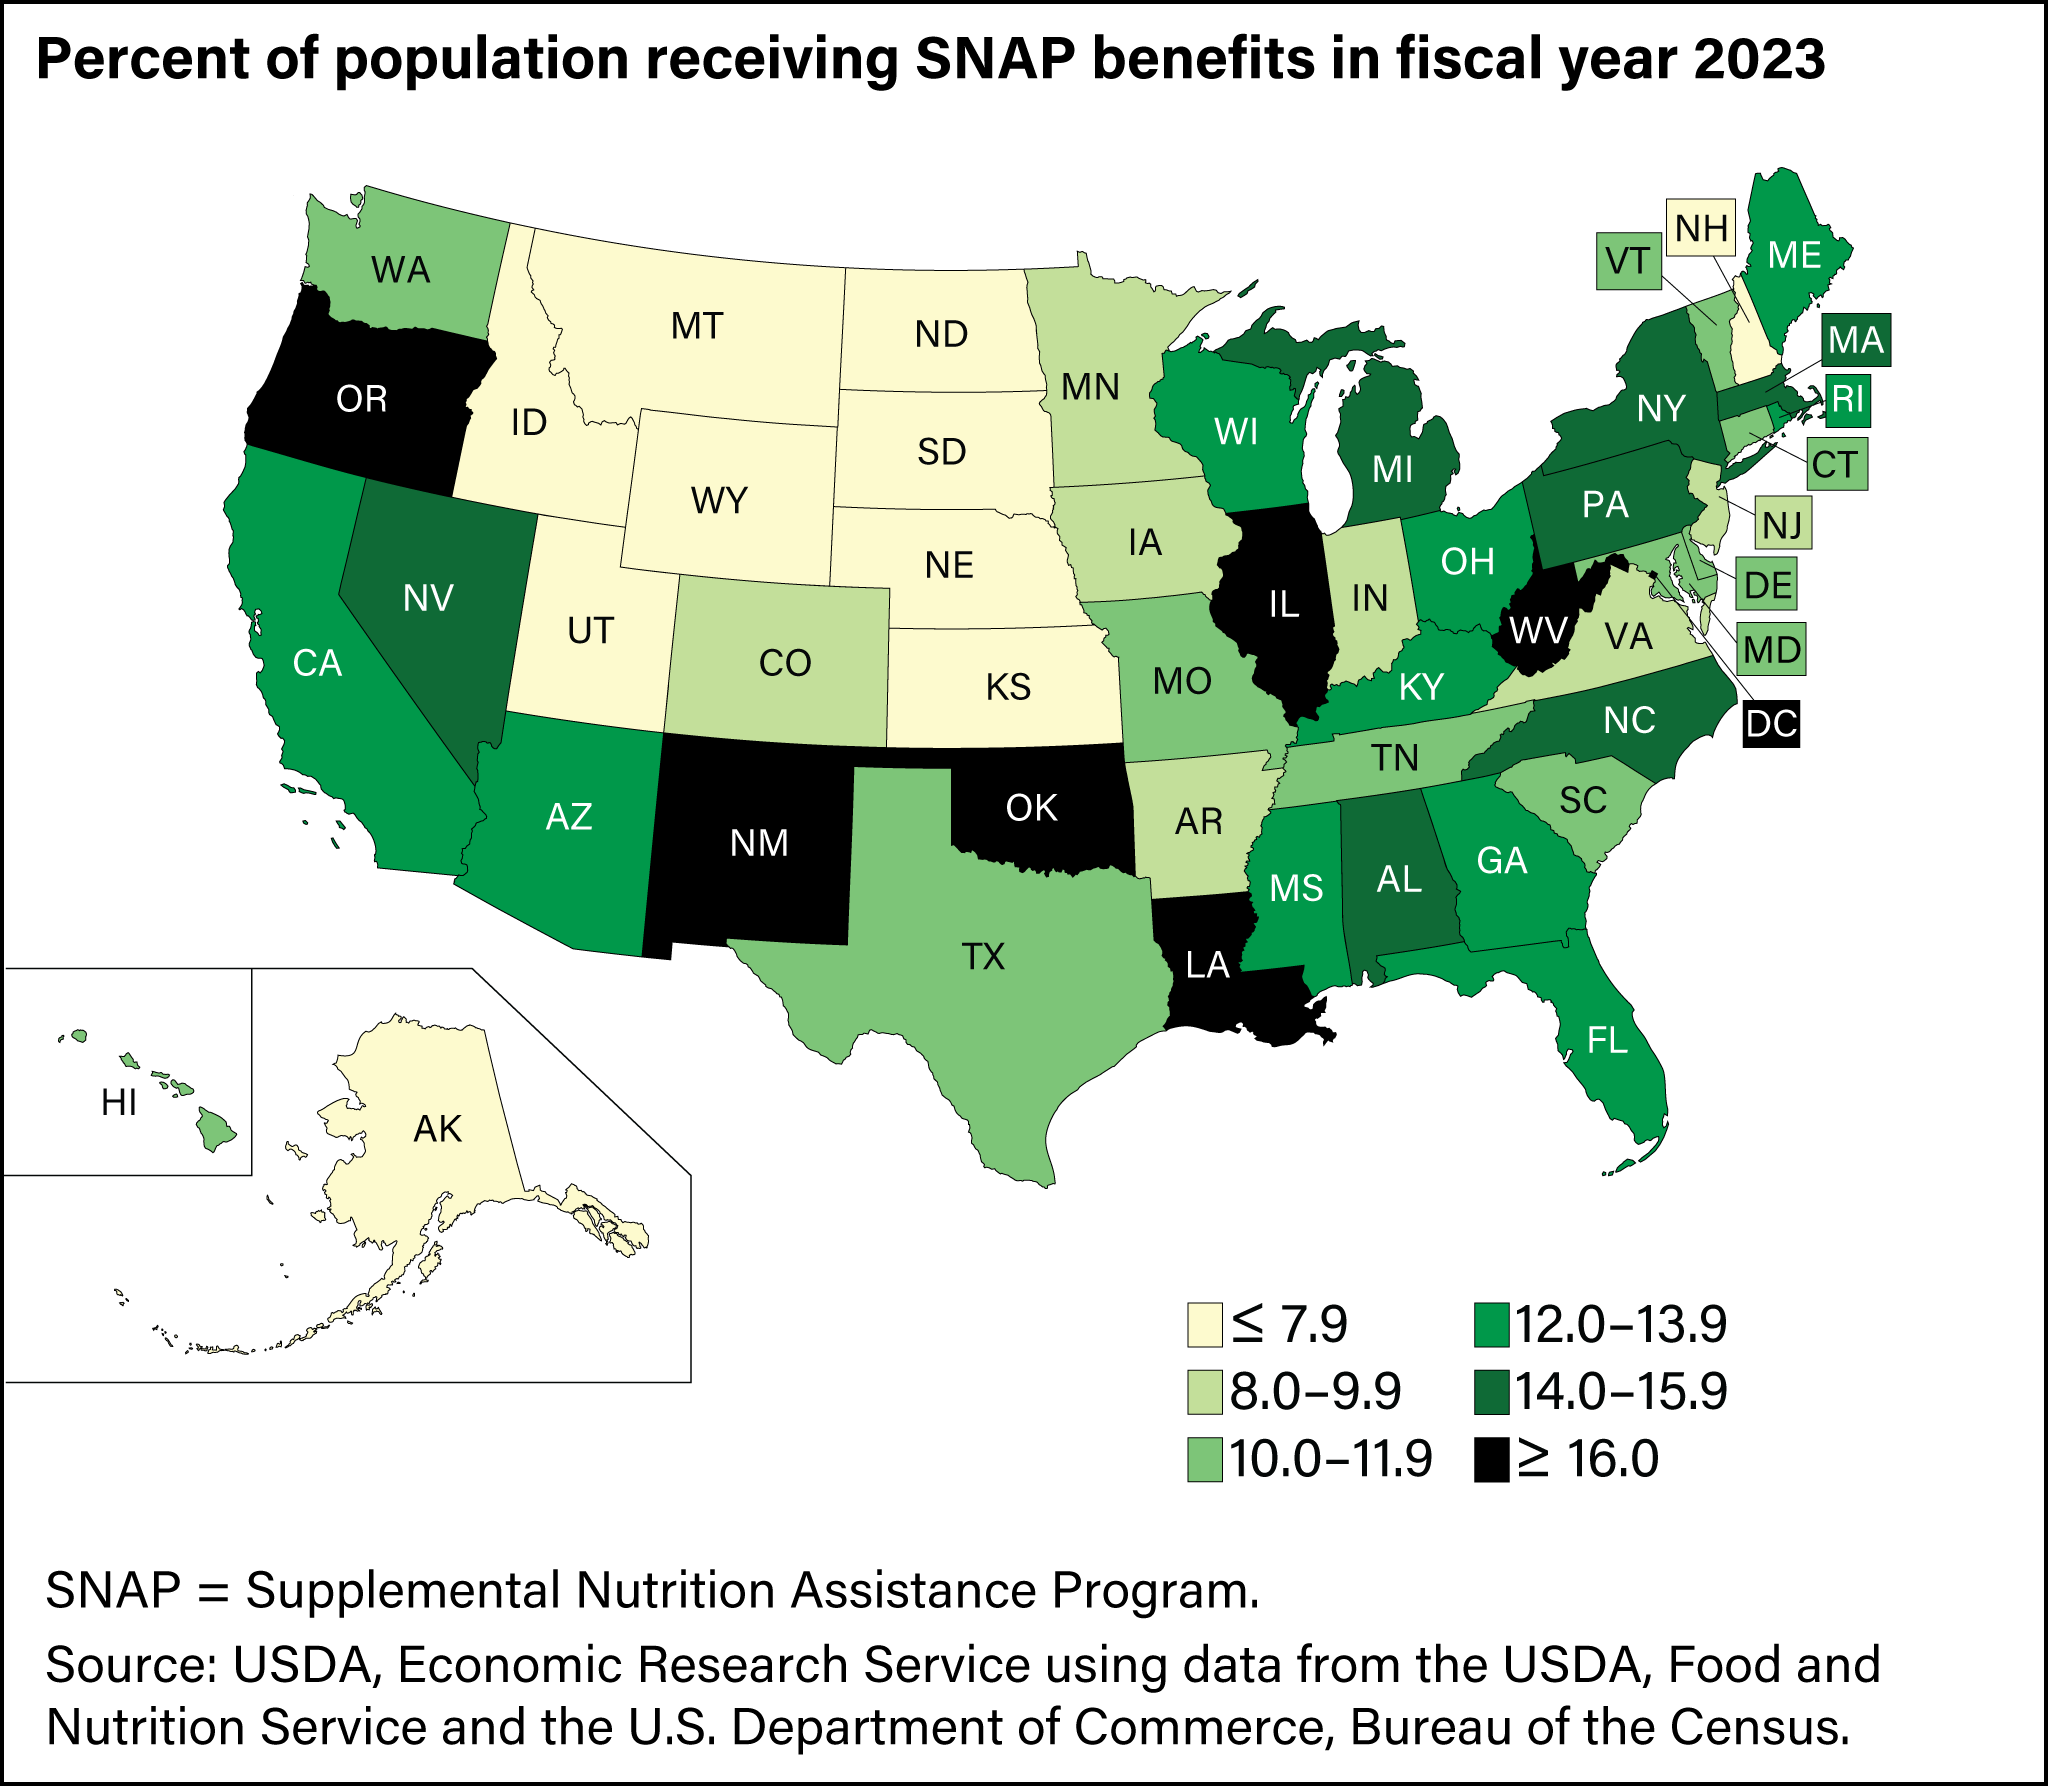
Participation in SNAP varies across States, reflecting differences in need and program policies
- by Jordan W. Jones
- 7/22/2024
In fiscal year 2023, the Supplemental Nutrition Assistance Program (SNAP) served an average of 42.1 million people per month, or 12.6 percent of U.S. residents. The share of residents receiving SNAP benefits in each State ranged from as high as 23.1 percent in New Mexico to as low as 4.6 percent in Utah. In 34 States, the share was between 8 and 16 percent.