

Increases in Labor Quality Contributed to Growth in U.S. Agricultural Output
- by Sun Ling Wang, Robert A. Hoppe and Thomas Hertz
- 2/17/2022
Highlights
- From 1948 to 2017, total farm output almost tripled though total labor hours worked in the farm sector declined more than 80 percent.
- The quality of farm labor, as measured by characteristics of workers, increased over this time period. For example, in 1950, nearly three-quarters of the total hours worked in the farm sector were by people with fewer than 9 years of schooling and 4 percent by people with at least some college. By 2017, those shares had shifted to 16 percent and 41 percent, respectively.
- Agricultural output grew at an average rate of 1.53 percent per year between 1948 and 2017. With total input use almost flat, total factor productivity growth is the major driver of agricultural output growth. For farm labor, the growth in human capital attributes, such as educational attainment, mitigated the negative effects from a decline in farm labor hours worked.
Agricultural output in the United States nearly tripled between 1948 and 2017 even as agricultural employment fell in absolute numbers and as a share of total U.S. employment. These opposing trends reflect continuing high rates of labor productivity growth in agriculture. Through the years, farmers adopted new technologies in production practices and increased their use of farm equipment, farm structures, seeds, livestock, chemical fertilizers, and pesticides. They also paid more for services that replaced some of the self-employed and hired labor hours, according to the U.S. productivity data developed and tracked by the USDA, Economic Research Service (ERS). Moreover, the hired farm workforce, farm operators, and unpaid family workers attained higher levels of education, changing the “quality” of human capital labor brought to farm productivity. Improved labor quality helped to mitigate the effect of reduced labor hours worked and contributed to growth in agricultural output, researchers found.
From 1948 to 2017, agriculture employment (including anyone working on farms or in the forestry, logging, fishing, hunting, and trapping industries) as a share of total U.S. employment fell from 13 percent to 2 percent, according to U.S. Bureau of Labor Statistics data. This decline in share reflected a tripling of nonagricultural employment and a drop in agricultural employment. During the seven decades studied (1948–2017), farm employment, which accounts for most agricultural employment, fell 81 percent and labor hours worked declined 83 percent, according to ERS data. The decline in farm labor occurred as workers sought higher wages and other income opportunities in the nonfarm sector, especially after World War II. In addition, the transformation of the farm structure toward fewer and larger farms and the development of labor-saving technologies—such as bigger and faster tractors and combines and automated feeding equipment—reduced demand for farmworkers. Total hours worked continued to decline in the last decade of the study, though more slowly than in previous decades.
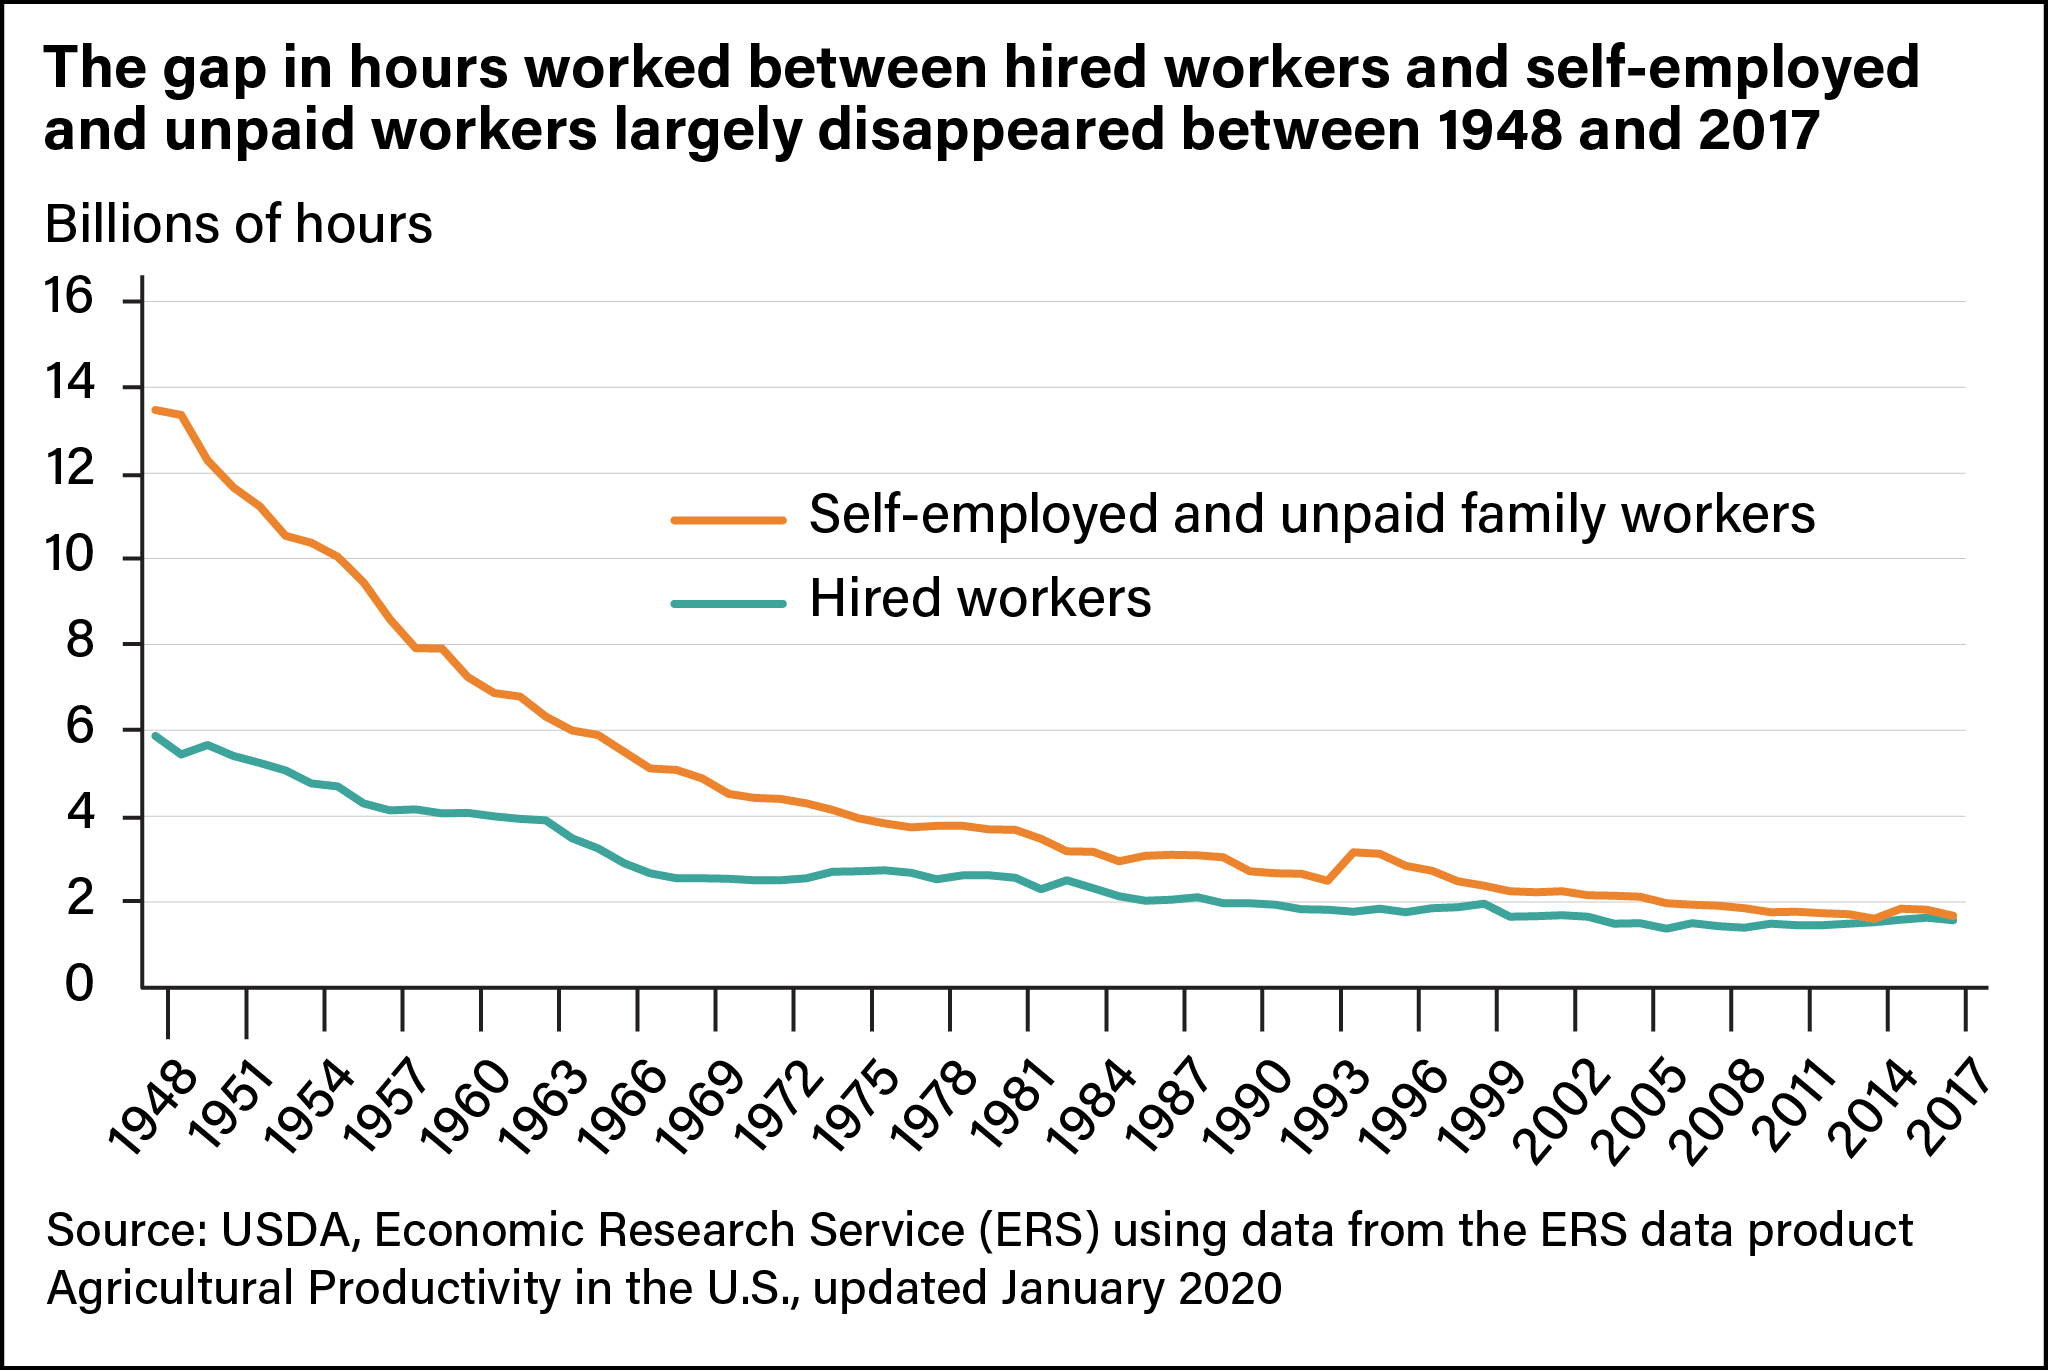
The number of self-employed and unpaid family farm workers fell faster than the number of hired farm workers. In the United States, most farms are family businesses, meaning the operator making most of the day-to-day farm decisions and his or her relatives owned more than half of the farm business' assets. Self-employed and unpaid family labor form a substantial part of the farm workforce. However, both labor components have contracted over time. In 1948, the farm sector used more than twice as many self-employed and unpaid labor hours as hired labor hours as it did in 2017. By 2017, the difference between hired labor hours and self-employed and unpaid hours had largely disappeared. Over the seven decades, hours worked by hired workers declined 73 percent, from 5.9 billion hours to 1.6 billion hours, while hours worked by self-employed and unpaid workers declined 87 percent, from 13.5 billion hours to about 1.7 billion hours.
Farm Operator and Farm Worker Education Increased, Resulting in Higher Labor Quality
During the time period studied, the highest level of education attained by farm workers rose along with the general U.S. population, especially after World War II. According to ERS estimates, in 1950, farm workers with 1 to 8 years of schooling accounted for 72 percent of total hours worked in the U.S. farm sector. That share declined to 38 percent by 1970 and to less than half of its 1970 level—16 percent—by 2017. By 1980, farm workers with a high school diploma but no college had become the largest educational attainment category. Yet between 1950 and 2017, the largest growth in the share of total farm hours worked was among workers with a 4-year college degree and above, rising from 1 percent to 25 percent.
| 1950 | 1960 | 1970 | 1980 | 1990 | 2000 | 2010 | 2017 | |
| Total hours (in million hours) |
17,943 |
11,318 |
7,059 |
6,317 |
4,682 |
3,903 |
3,335 |
3,253 |
| Total hours share (percent) | ||||||||
| 1–8 years grade school |
72.39 |
59.91 |
38.07 |
22.34 |
16.32 |
16.25 |
16.52 |
15.70 |
| 1–3 years high school |
12.92 |
15.76 |
18.27 |
15.12 |
11.44 |
10.55 |
8.35 |
7.83 |
| Subtotal |
85.32 |
75.67 |
56.34 |
37.46 |
27.76 |
26.8 |
24.86 |
23.53 |
| 4 years high school |
10.98 |
18.64 |
29.3 |
42.39 |
47.17 |
37.69 |
36.08 |
35.18 |
| 1–3 years college |
2.56 |
4.21 |
8.5 |
12.3 |
14.01 |
17.52 |
17.49 |
16.34 |
| 4 years college and above |
1.14 |
1.48 |
5.85 |
7.85 |
11.07 |
17.99 |
21.57 |
24.96 |
| Subtotal |
14.68 |
24.33 |
43.66 |
62.54 |
72.24 |
73.2 |
75.14 |
76.47 |
|
Notes: This table presents farm workers' hours worked as a share of total hours. Total hours include hours worked by self-employed and unpaid family workers and hired labor. |
||||||||
The changing distribution of labor costs across educational attainment categories reflects higher levels of education and a growing earnings gap between workers at the lower and higher ends of the earnings spectrum. Between 1950 and 2017, the cost share of those with 1 to 8 years of schooling dropped from 66 percent to 13 percent. The cost share of workers with 4 years of high school education increased from 13 percent in 1950 to 45 percent in 1980 and then fell to 31 percent in 2017, largely reflecting underlying patterns in the hours share by group. The cost share of workers with at least a 4-year college degree increased roughly 12 times, from 3 percent in 1950 to 37 percent in 2017. In a competitive labor market, the wage rate is determined by the productivity the worker can offer, so higher earnings for those with higher educational attainment suggest farm hiring managers consider workers with a more advanced education might be more productive.
| 1950 | 1960 | 1970 | 1980 | 1990 | 2000 | 2010 | 2017 | |
| Total cost (in 2015 million dollars) | 273,492 | 183,432 | 128,958 | 114,505 | 88,895 | 80,115 | 68,699 | 70,518 |
| Total cost share (percent) | ||||||||
| 1–8 years grade school | 66.34 | 54.29 | 30.94 | 17.5 | 12.25 | 10.39 | 9.95 | 9.97 |
| 1–3 years high school | 13.7 | 15.57 | 16.7 | 12.92 | 10.13 | 6.86 | 5.17 | 5.19 |
| Subtotal | 80.04 | 69.86 | 47.64 | 30.43 | 22.38 | 17.25 | 15.12 | 15.16 |
| 4 years high school | 13.13 | 21.26 | 33.77 | 44.92 | 44.91 | 35.16 | 31.92 | 31.08 |
| 1–3 years college | 3.92 | 5.59 | 10.07 | 13.91 | 15.94 | 18.99 | 17.92 | 16.58 |
| 4 years college and above | 2.91 | 3.29 | 8.52 | 10.74 | 16.76 | 28.59 | 35.03 | 37.18 |
| Subtotal | 19.96 | 30.14 | 52.36 | 69.57 | 77.62 | 82.75 | 84.88 | 84.84 |
|
Source: USDA, Economic Research Service using data from the Census of Population for 1950–2000, American Community Survey for 2005–2017, Current Population Survey 1950 to 2017, U.S. Bureau of Economic Analysis National Income and Product Accounts for 1950–2017. |
||||||||
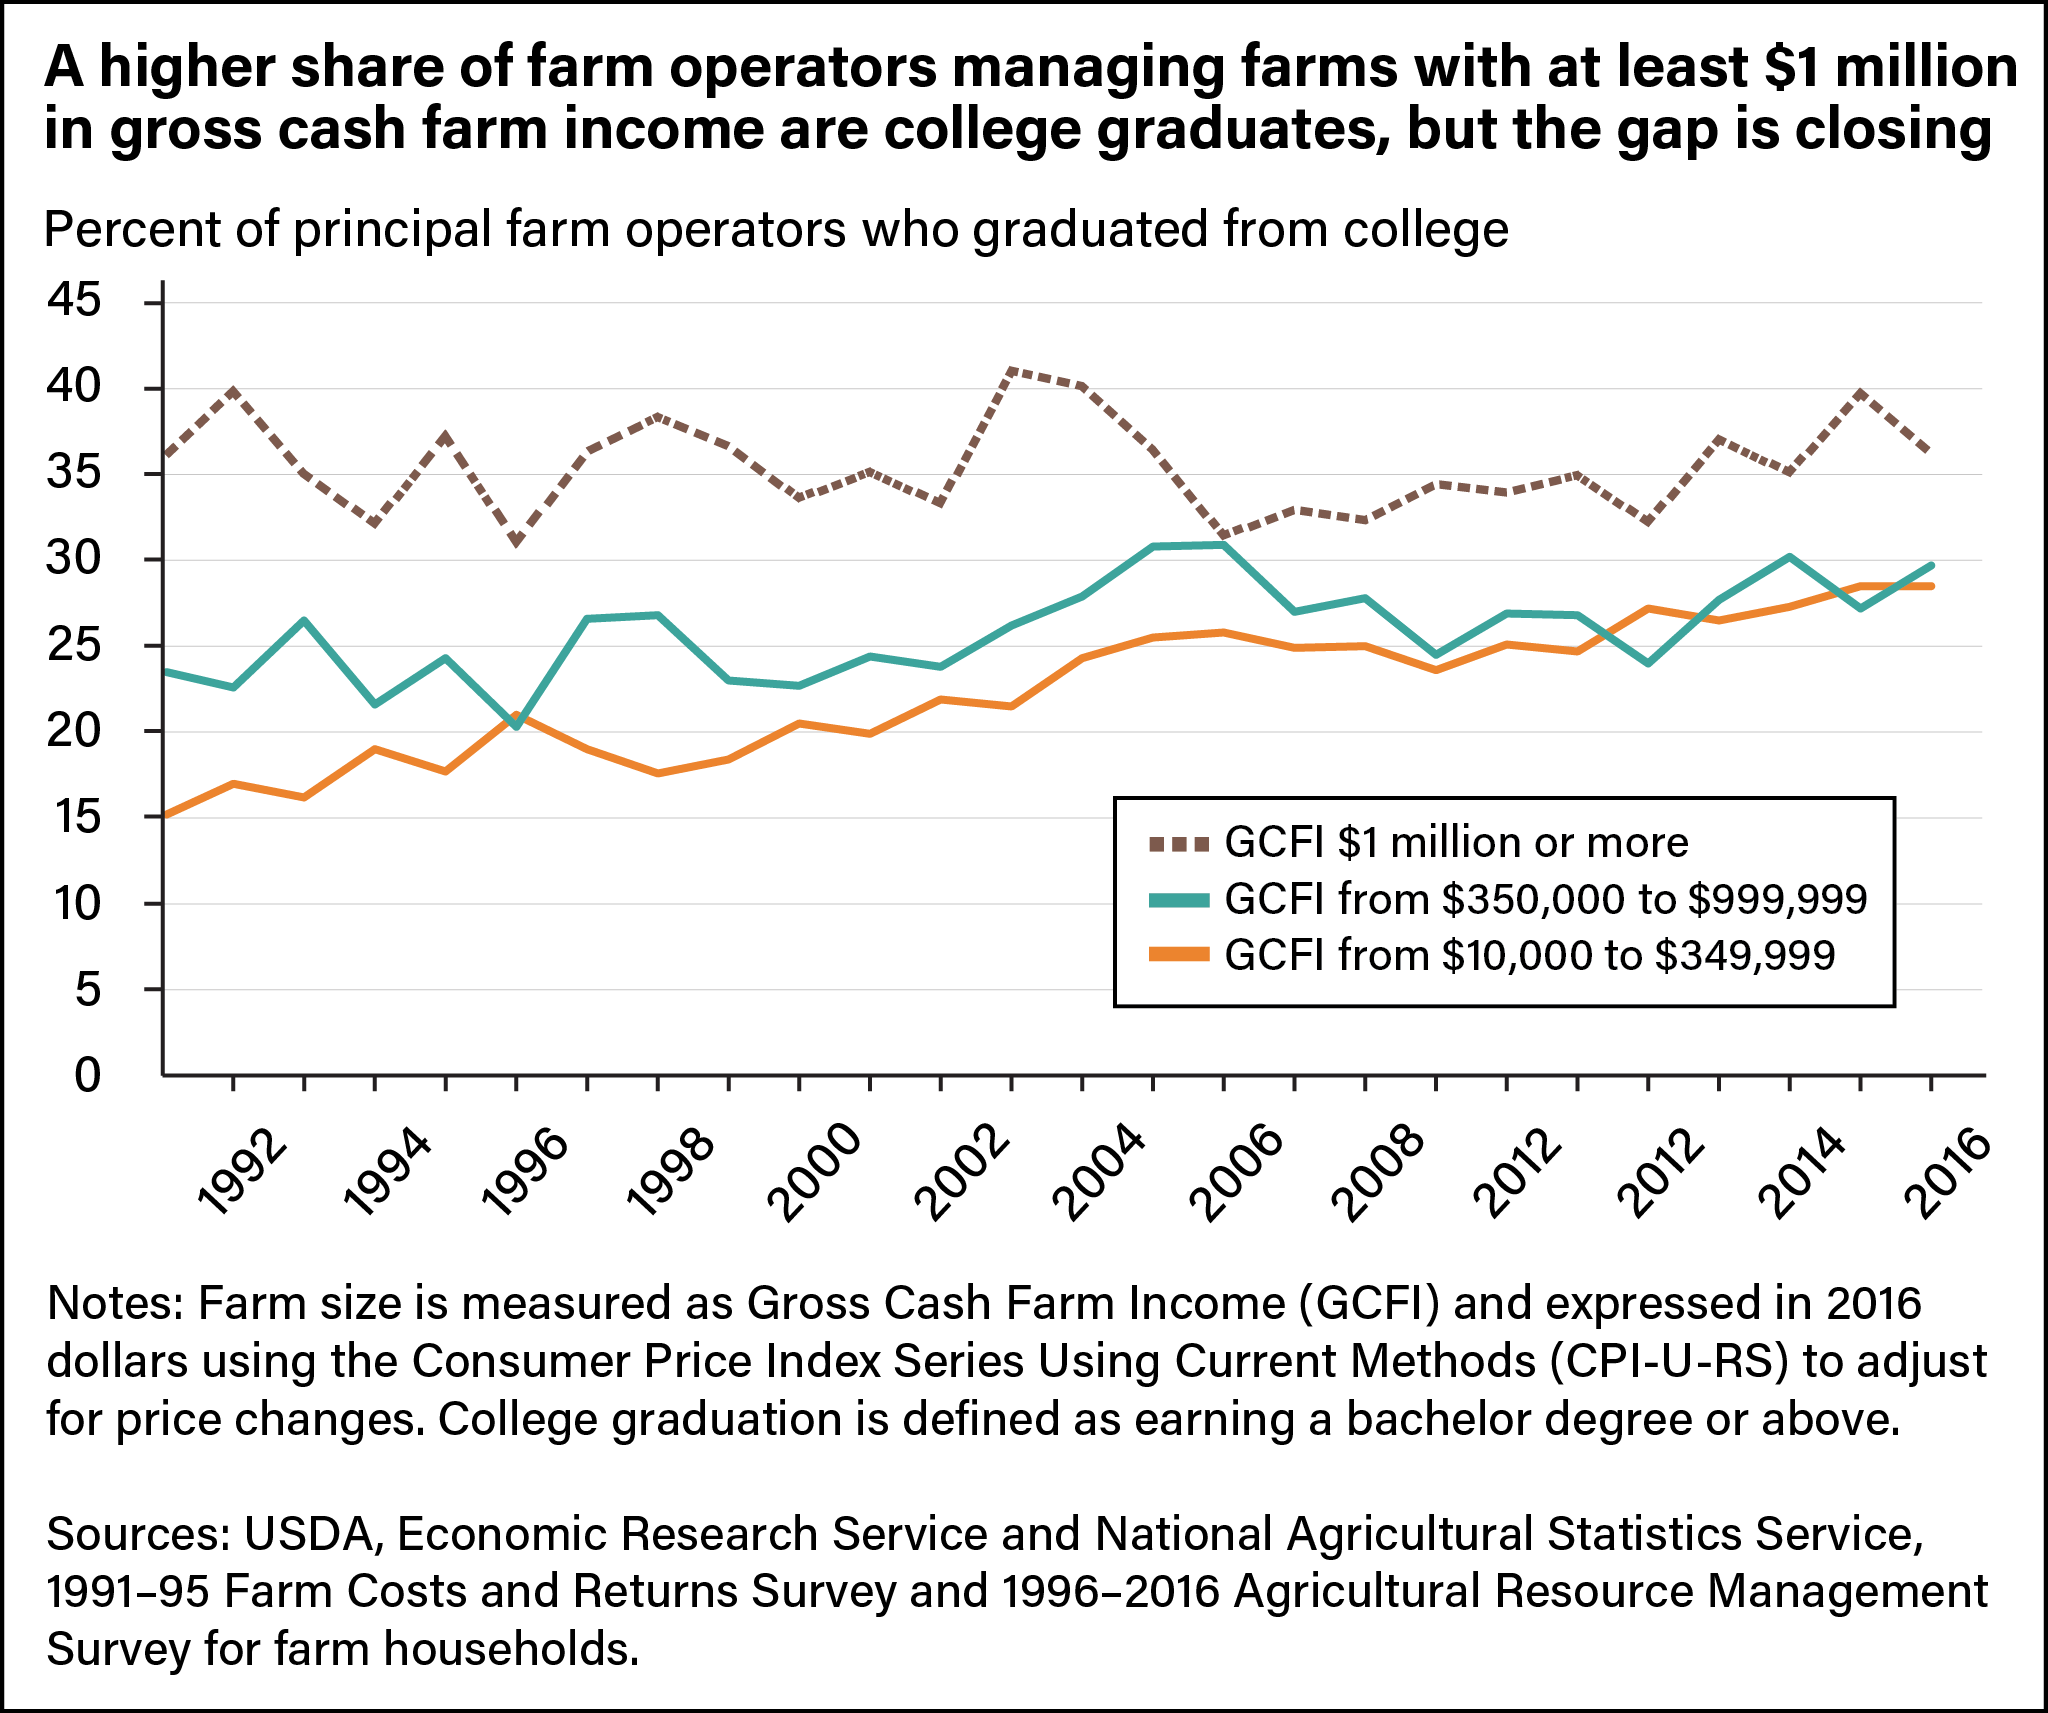
Higher levels of education, especially for principal operators, also are associated with a recent shift in agricultural production to larger farms, according to 1991–2016 data drawn from the USDA, Agricultural Resource Management Survey (ARMS). In 1991, farms with at least $1 million (in 2015 dollars) in sales contributed about a third of total agriculture production value. That share rose to just more than half in 2015. Principal farm operators associated with larger farms, those with a higher total gross cash farm income (GCFI), are more likely to hold a college degree, ERS research showed. College graduation rates for operators of large farms, with at least $1 million GCFI, ranged between 31 and 41 percent from 1991 to 2016, consistently higher than the rates for operators of smaller farms. The 36-percent college graduation rate for operators of large farms exceeded the rate for all U.S. household members (age 25 or more) in 2016 (34.3 percent). College graduation rates trended upward for the other GCFI classes, although the increase was not as clear after 2006 for operators in the $350,000–$999,999 category.
Increased Input Intensities Contributed to Labor Productivity Growth
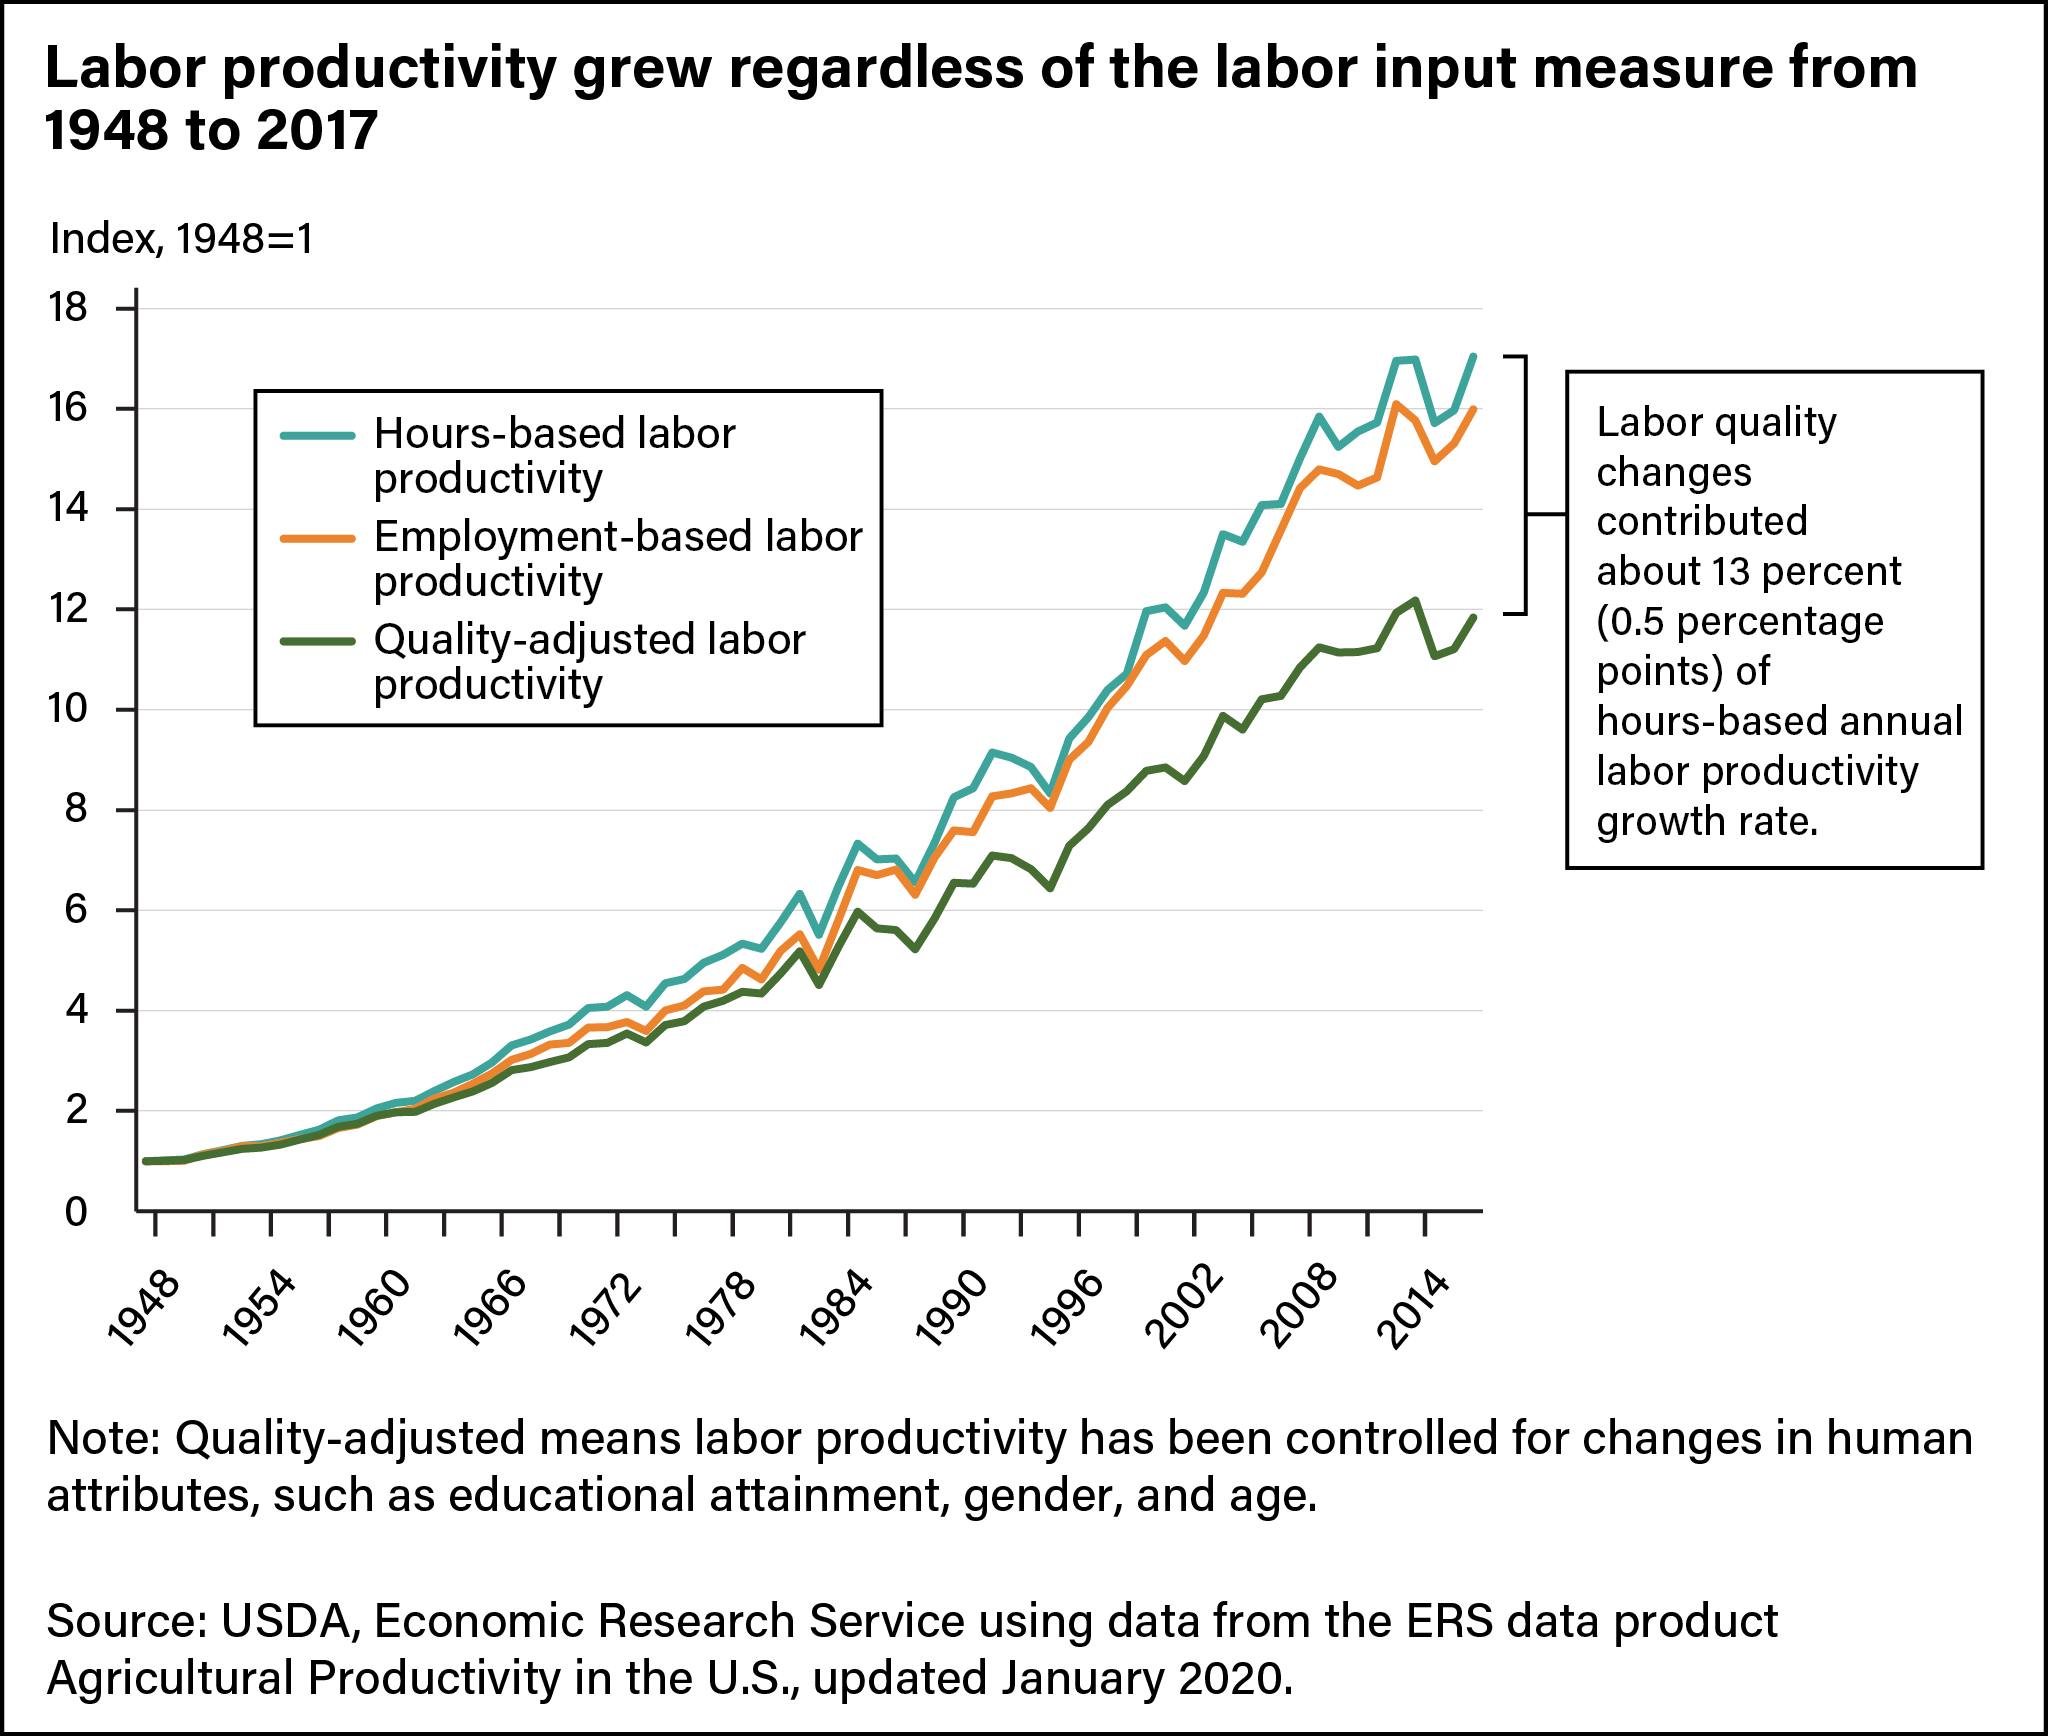
Between 1948 and 2017, U.S. agricultural output grew more than 180 percent at an average annual growth rate of 1.53 percent. That rate of growth, combined with the declining use of labor, resulted in a considerable increase in labor productivity, measured as the average output per unit of labor input. In the seven decades studied, output per worker grew by 16 times and output per hour by 17 times. Because human attributes such as educational attainment, gender, and age may affect worker performance, ERS researchers account for labor quality changes (including changes in human capital attributes—such as education, age, or gender—in employment types) in productivity analyses. When labor quality changes since 1948 are accounted for, labor productivity grew about 12 times, a slower rate than those based simply on labor hours worked or employment. This implies that changes in labor quality, such as improvements in education, account for the difference in labor productivity changes over the years.
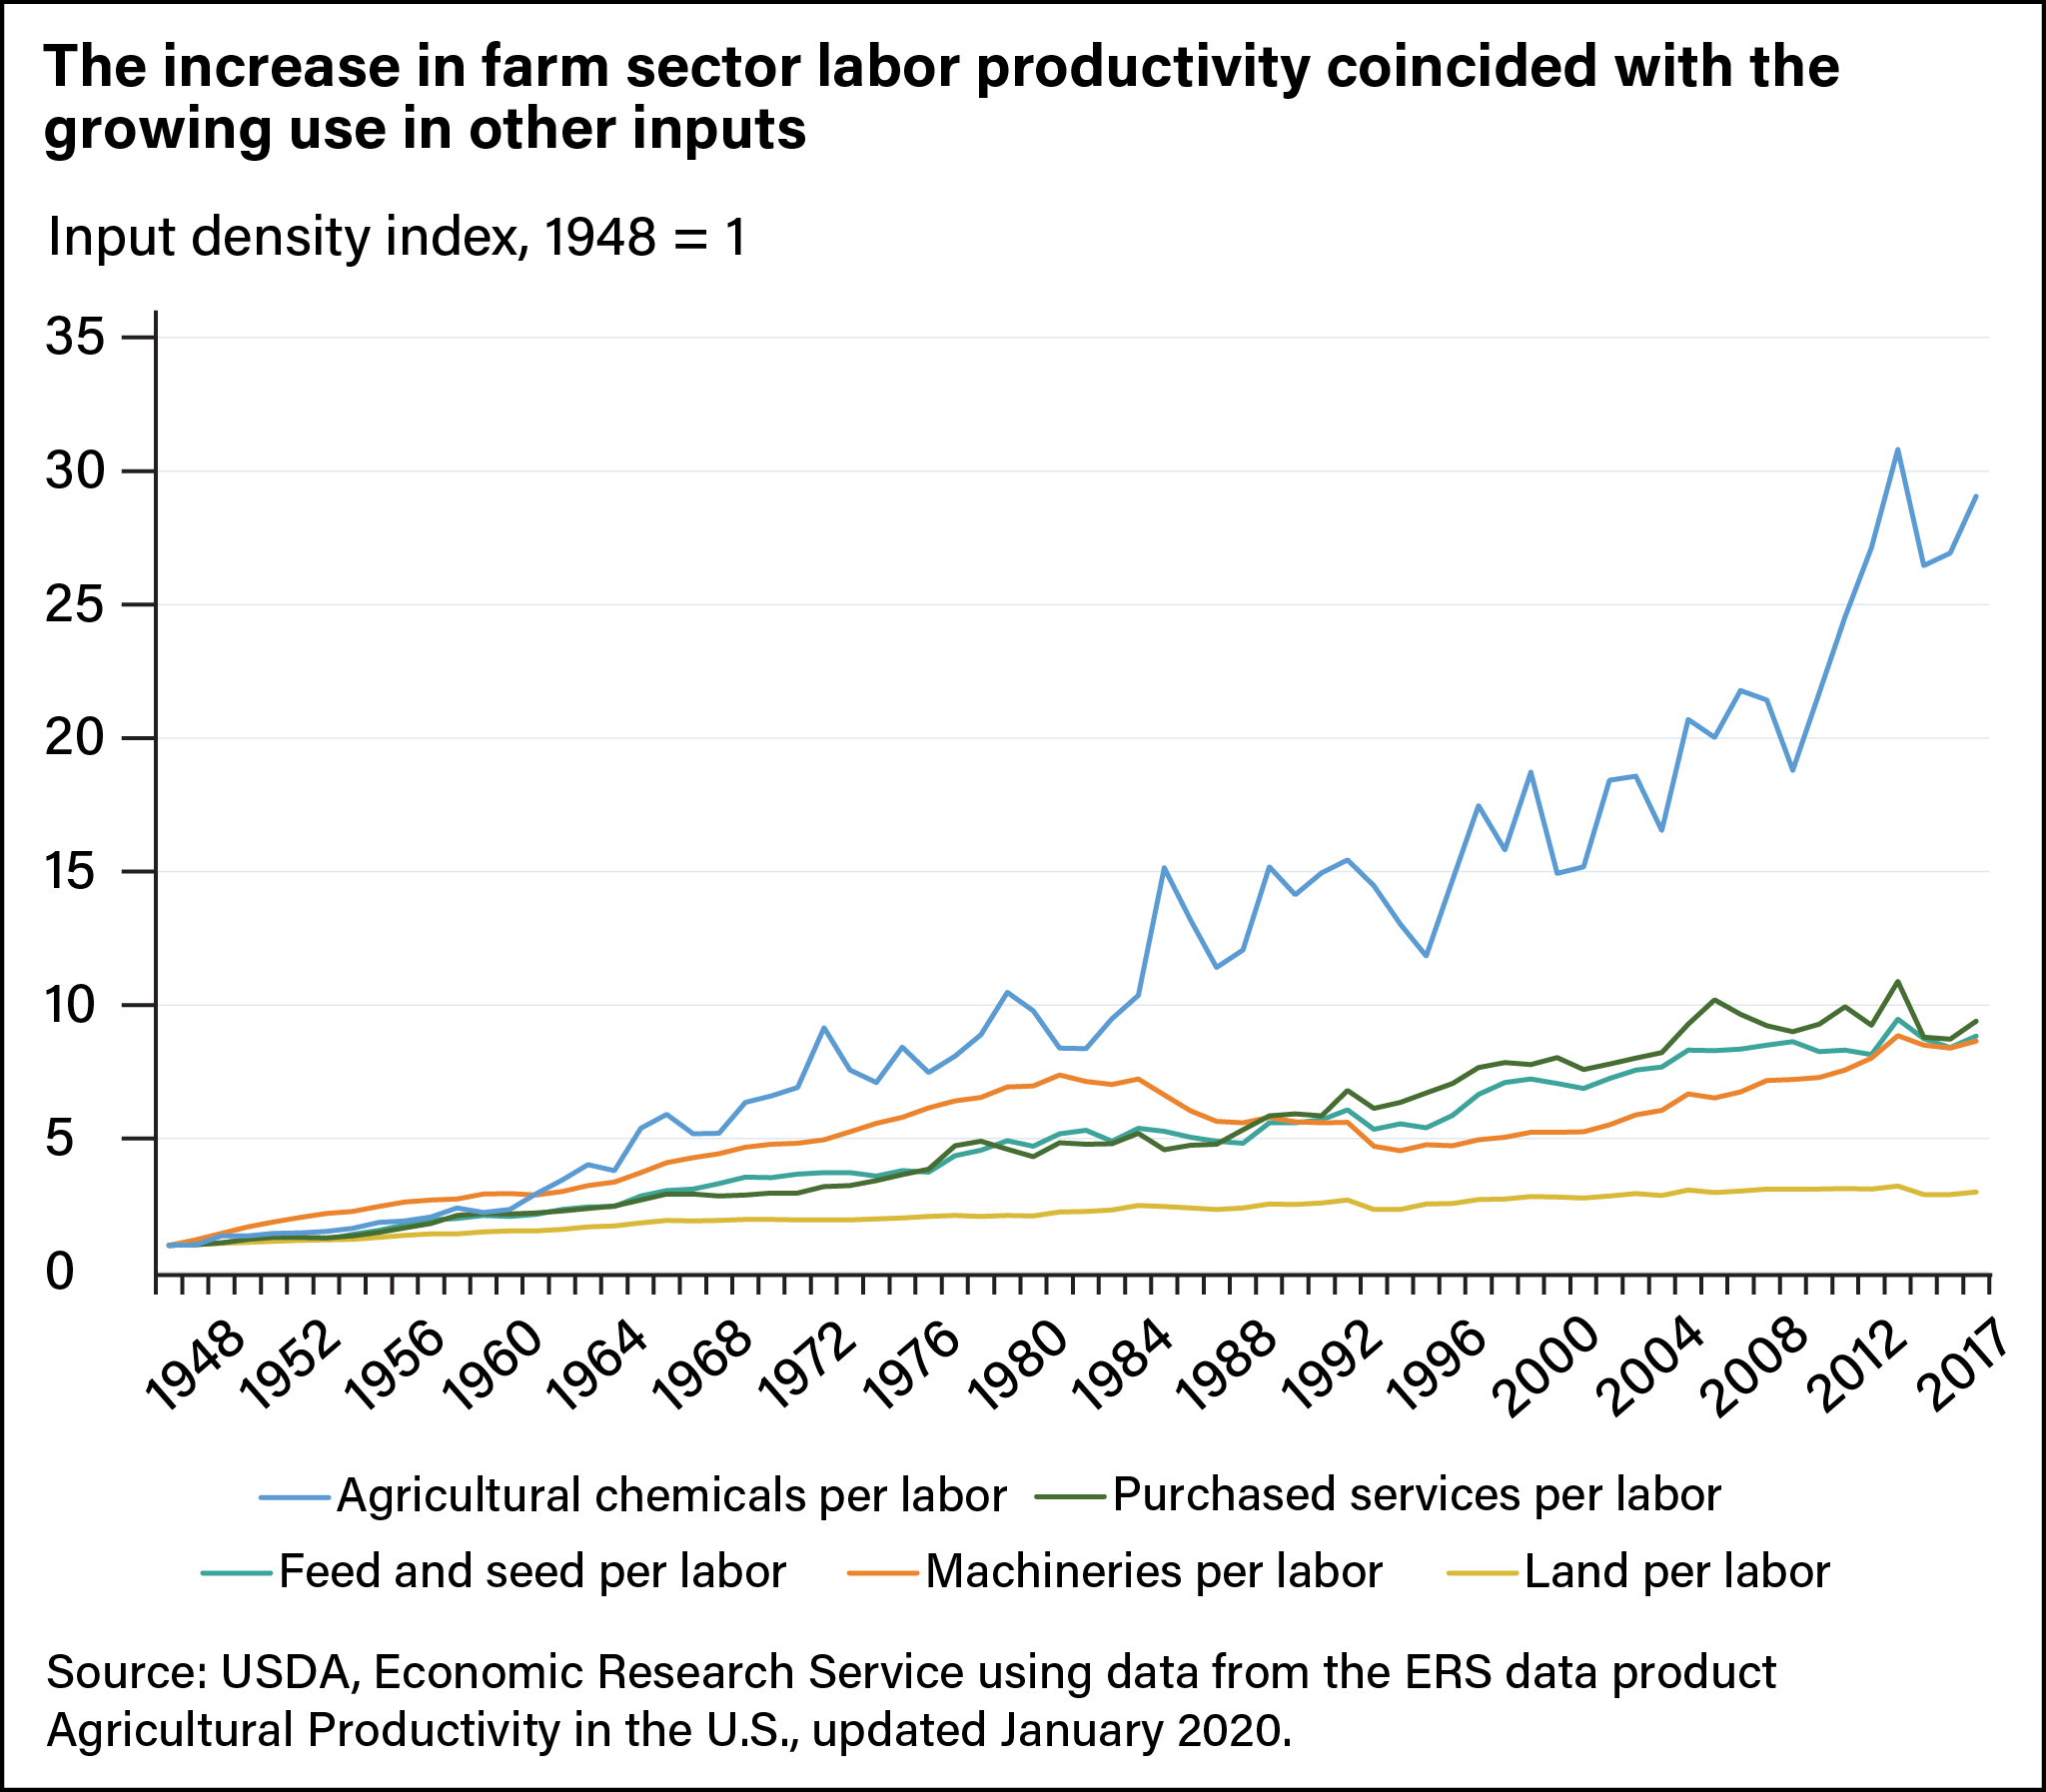
Labor productivity grew mainly because farm operators used different inputs and adopted new technology in their farm practices. With reductions in farm labor over time, the U.S. farm sector now relies more on capital goods, intermediate inputs (such as chemical fertilizers, energy, and purchased services), and growth in total factor productivity (TFP)—an indicator of technical change—to maintain output growth. Over time, the increase in labor productivity coincided with increases in input intensities per unit of labor. This pattern implies that input substitution contributed partially to increasing labor productivity, with some inputs substituting for labor used in the production process. Among all inputs, the use of chemicals (pesticides and fertilizer) increased the fastest. Labor productivity continued to grow even when input intensities slowed between 1980 and 1996 primarily because of total factor productivity growth.
TFP Has Been the Major Driver of Agricultural Output Growth Over Time, With Changes in Labor Quality Contributing Positively to Output Growth
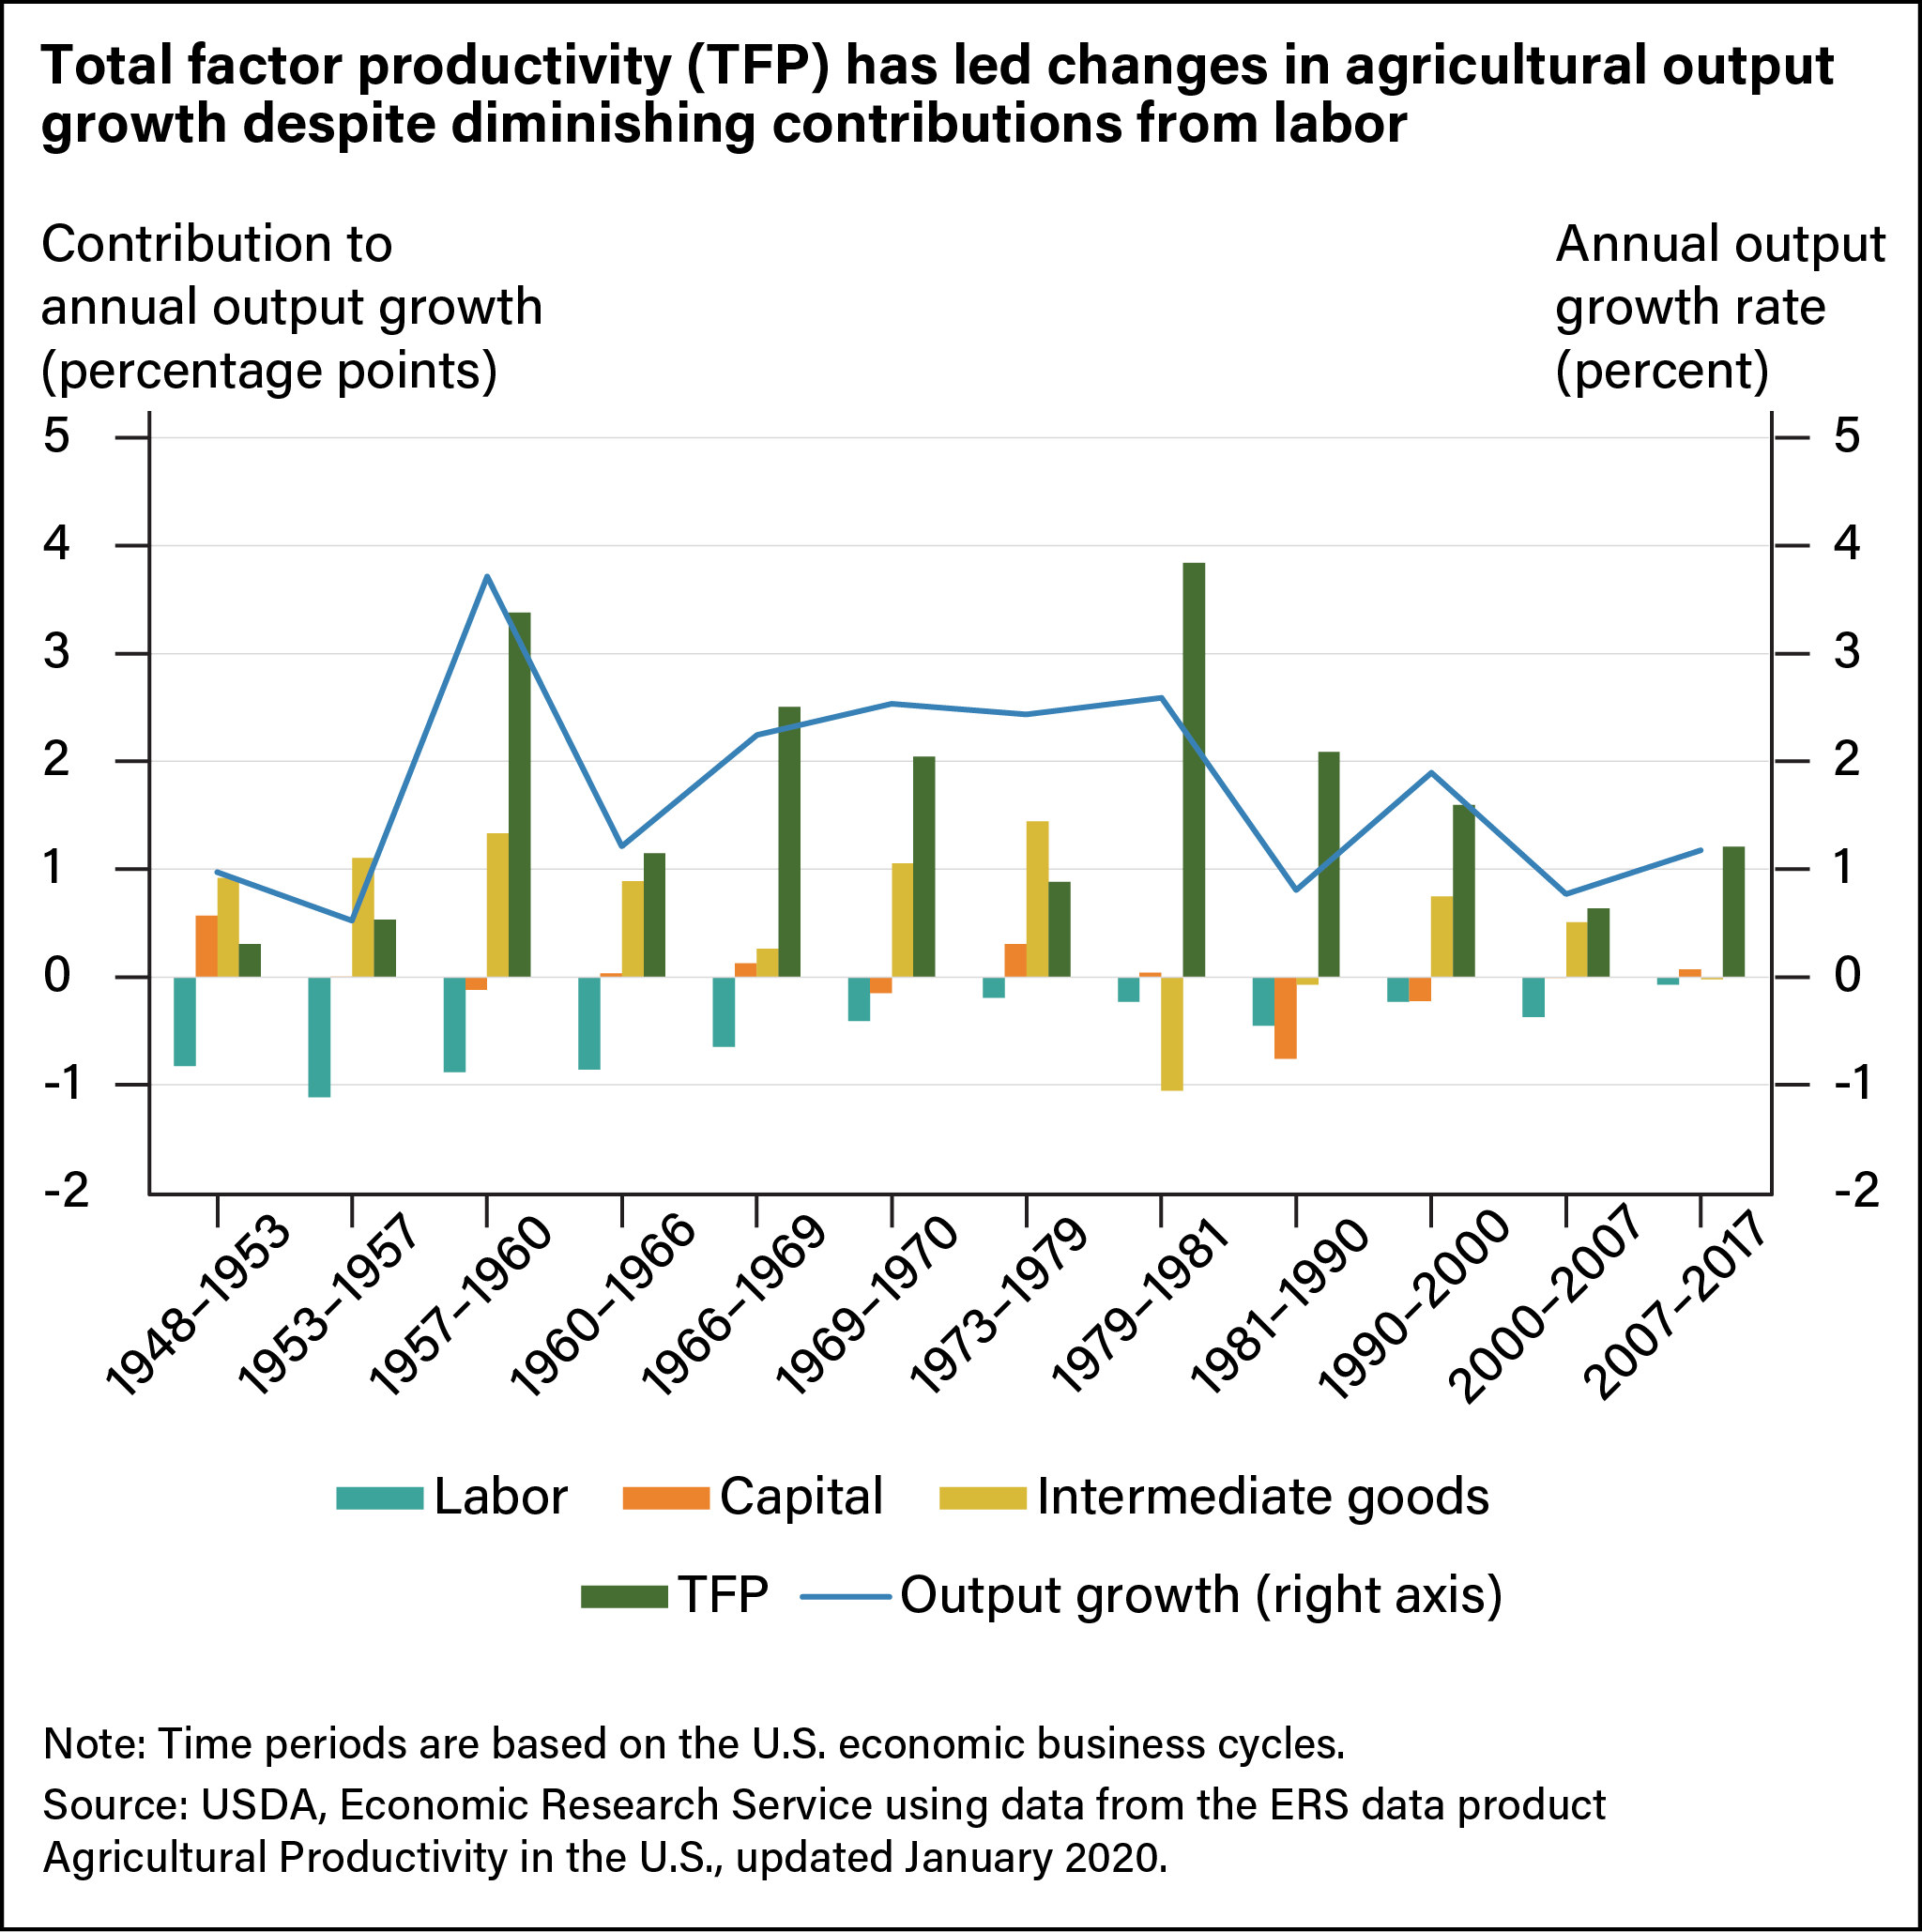
Growth in agricultural production depends on the production inputs used and on TFP. Inputs can be in the form of labor, capital (durable equipment, farm structures, and land), and intermediate goods (including energy, agricultural chemicals, purchased services, and seed and feed). In analyzing the value of contributors to agricultural output growth, researchers break labor into two subcategories: quantity (measurable determinants such as hours worked) and quality (human capital attributes such as education, age, or gender). To study trends in how these factors contributed to overall agricultural output growth, ERS researchers looked at 12 periods determined by the U.S. economic business cycles from 1948 to 2017.
In the earliest period, from 1948 to 1953, increases in the input of intermediate goods were the biggest contributing factor to overall output growth, and declines in hours worked were a negative force. TFP was a lesser contributor in this time period. By 2017, U.S. farm output had grown at an average annual rate of 1.53 percent, according to ERS research. But in the seven decades studied, growth in the use of all major input categories—labor, capital, and intermediate goods—was almost flat at a 0.07-percent annual average. This implies TFP was the major driver of agricultural growth since World War II with average annual growth of 1.46 percent over the period.
Although total input use grew very little, its composition shifted toward more use of intermediate goods and machinery and away from labor and farmland. Between 1948 and 2017, the growth of intermediate goods contributed 0.58 percentage points to the 1.53-percent average annual output growth, while declines in farm labor input subtracted 0.45 percentage points from output growth.
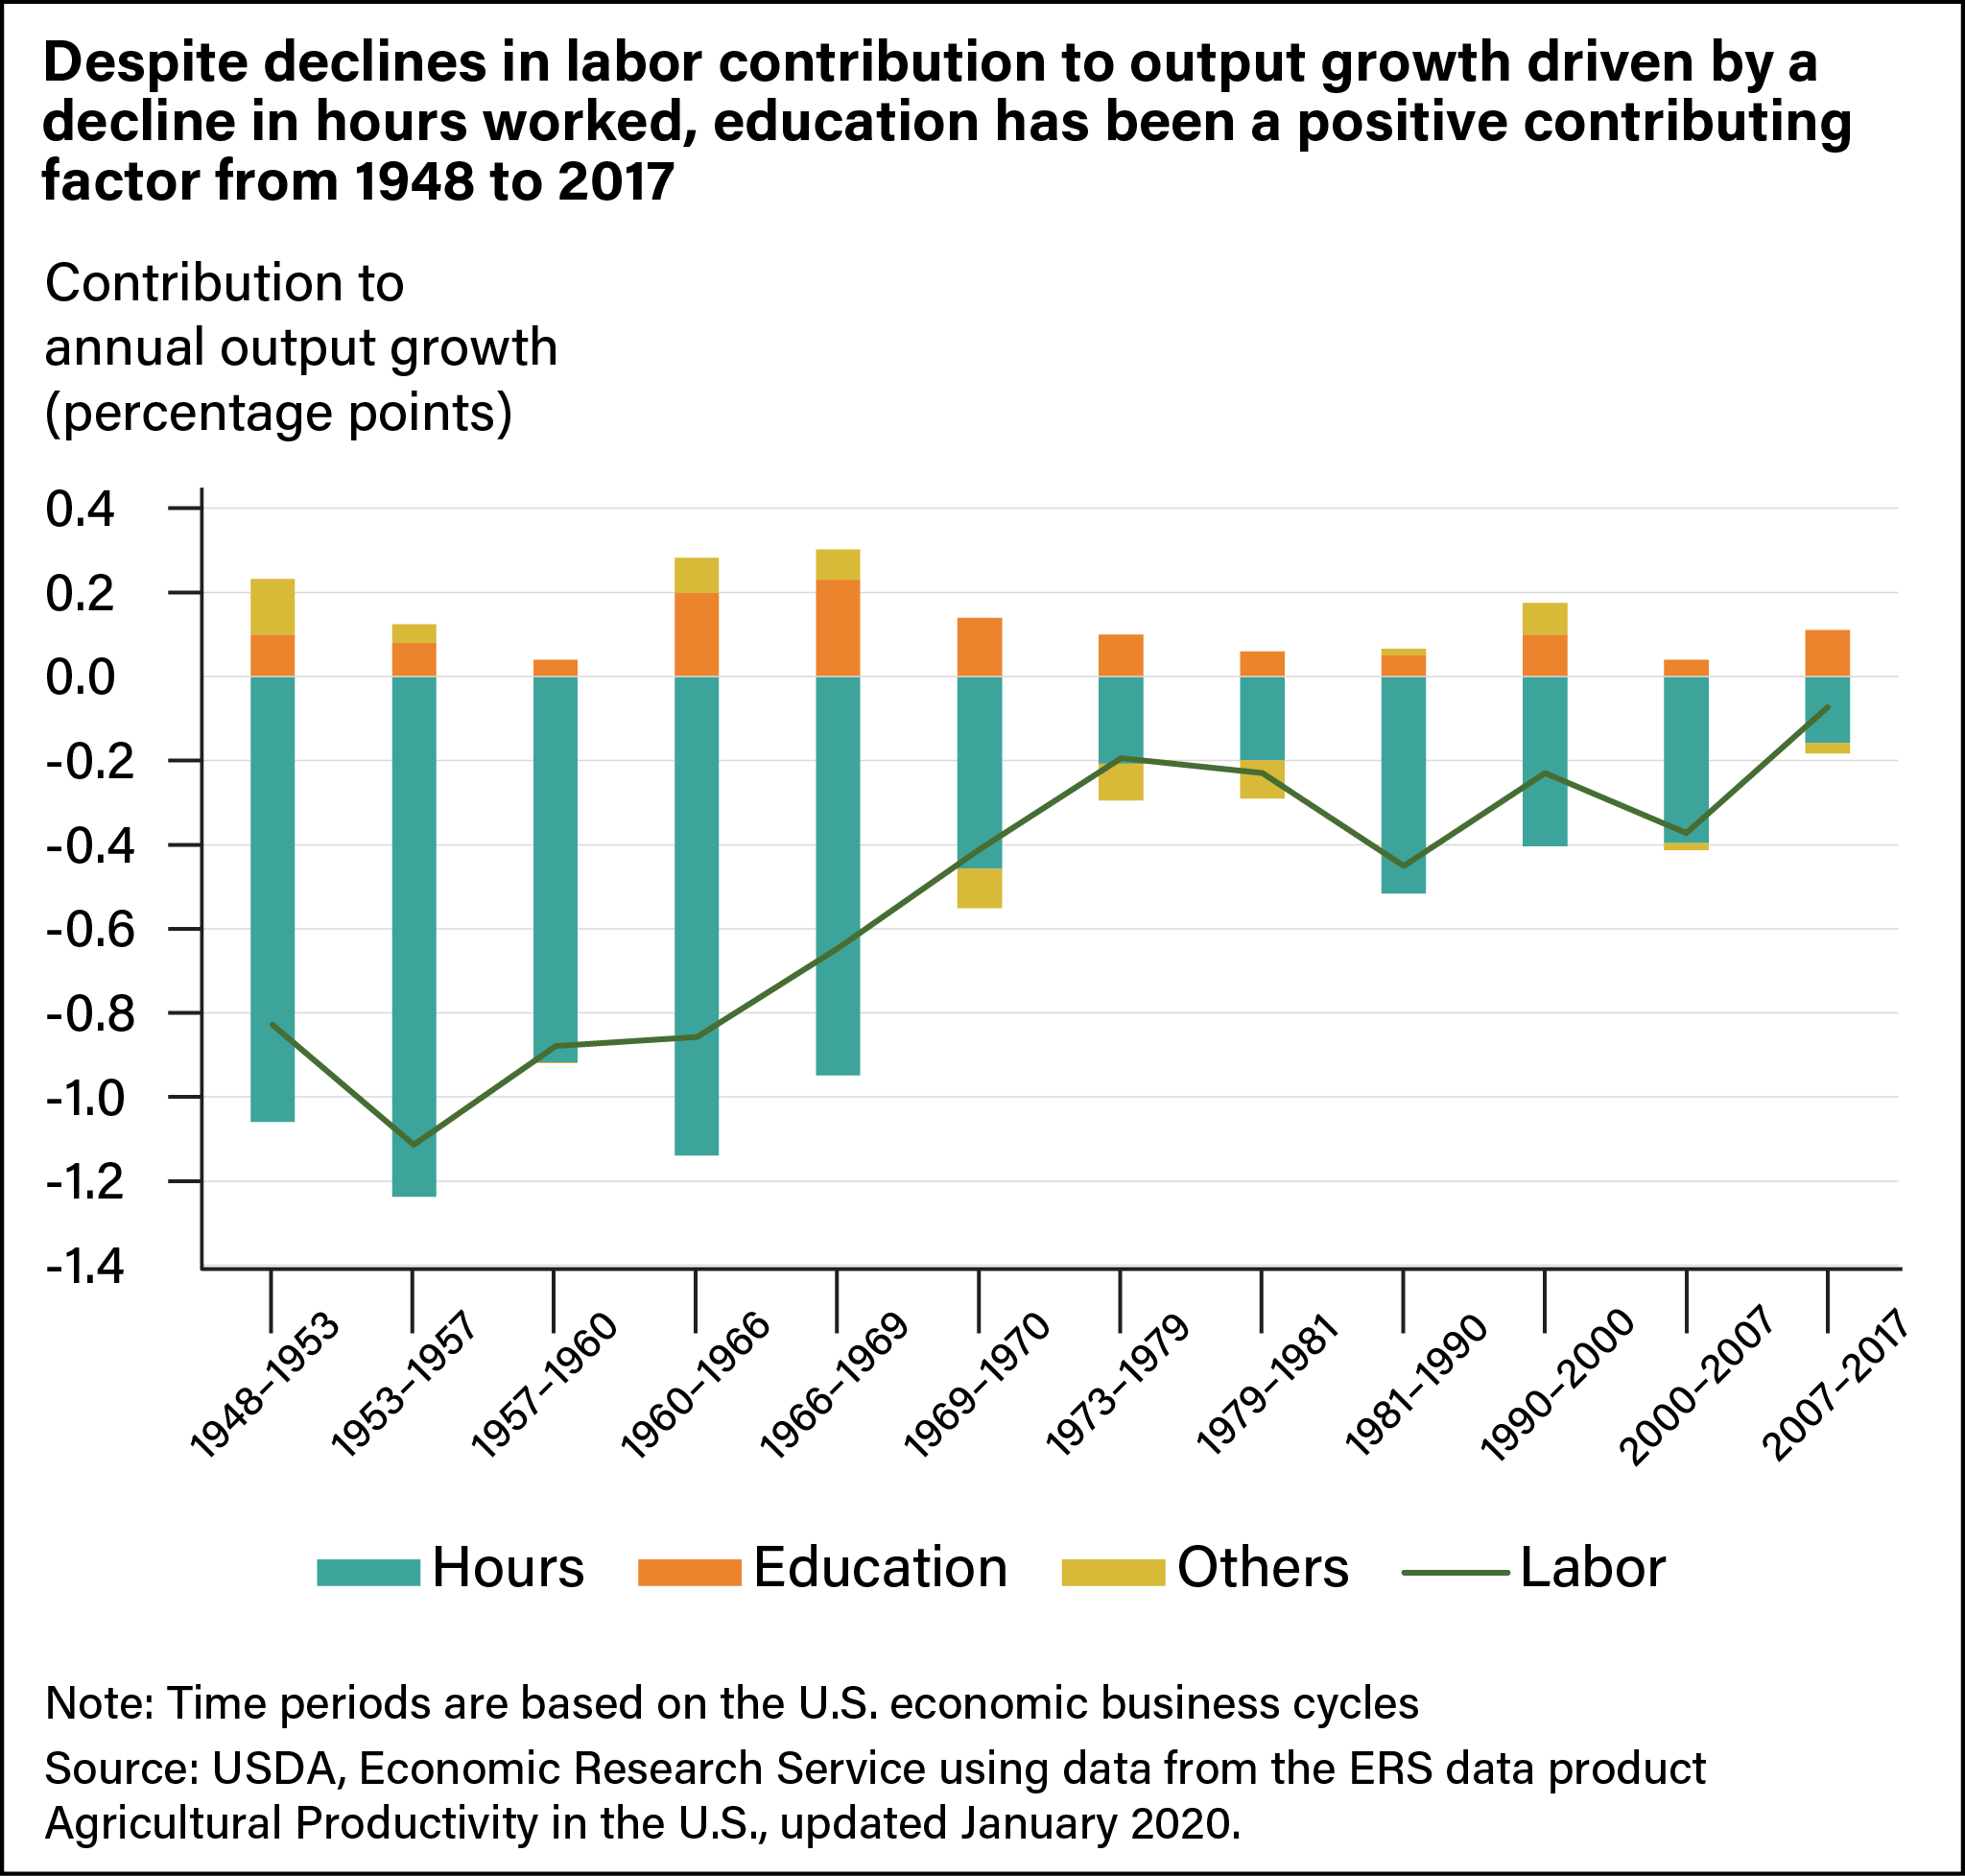
While the decrease in hours worked contributed negatively to output growth, most of the contraction in hours worked occurred between 1948 and 1969, during the expansionary period after World War II, and the data suggest agricultural output growth could have doubled or more in certain time periods had total hours worked not declined. By the 2007–17 economic business cycle, the negative effect of reduced labor hours on annual output growth had shrunk to its lowest level, a reduction of just 0.16 percentage points.
While declines in labor hours worked pulled down agricultural output, changes in labor quality contributed positively to output growth. ERS researchers found that labor quality was a positive force on output in all economic business cycles except for 1979–81, which coincided with the oil crisis. The effects of labor quality on agricultural output were especially crucial before 1969. It accounted for almost 25 percent of total output growth per year.
Education improvement accounted for more than 90 percent of these labor quality changes between 1948 and 2017. Only during the 1948–53 business cycle did other factors outpace education in contributing more to labor quality changes, primarily an increase in the percentage of male workers and a reduction of young workers (groups of 14–15 and 16–17 years old). Since 1969, the rise in educational attainment has slowed, and the overall influence of labor quality on output growth has diminished.
This article is drawn from:
- Wang, S.L., Hoppe, R.A. & Hertz, T. (2022). Farm Labor, Human Capital, and Agricultural Productivity in the United States. U.S. Department of Agriculture, Economic Research Service. ERR-302.
You may also like:
- Agricultural Productivity in the United States. (n.d.). U.S. Department of Agriculture, Economic Research Service.
- Wang, S.L., Heisey, P., Schimmelpfennig, D. & Ball, E. (2015). Agricultural Productivity Growth in the United States: Measurement, Trends, and Drivers. U.S. Department of Agriculture, Economic Research Service. ERR-189.
- MacDonald, J.M., Hoppe, R.A. & Newton, D. (2018). Three Decades of Consolidation in U.S. Agriculture. U.S. Department of Agriculture, Economic Research Service. EIB-189.