
Farm Milk Components and Their Use Among Dairy Products Have Shifted Over Time
- by Angel Terán and Jerry Cessna
- 8/9/2021
Highlights
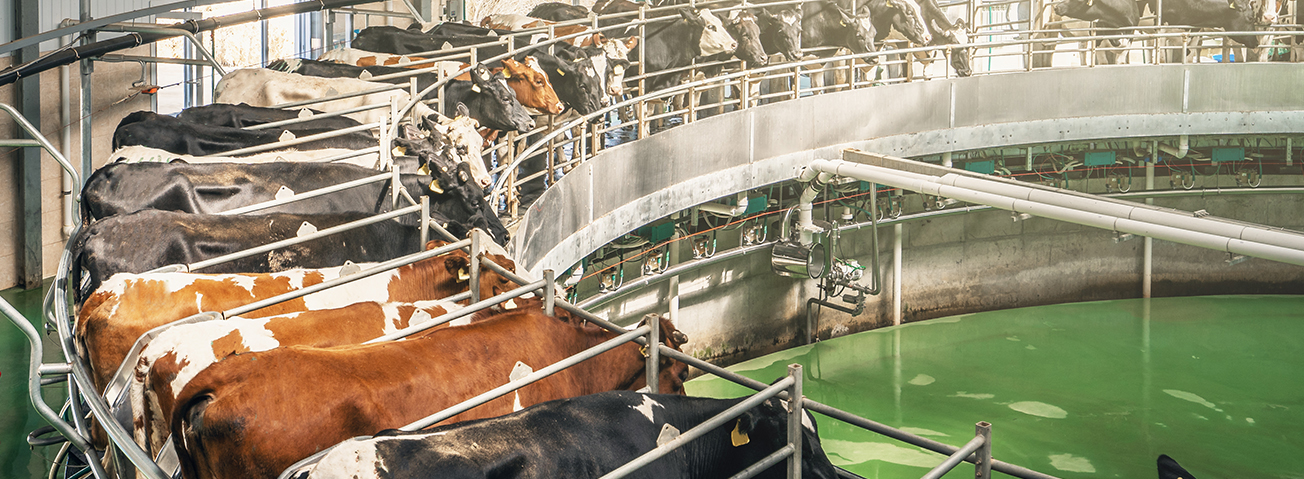
- Density of nutrients in farm milk has grown in the last two decades. In 2019, the milk-fat content was 3.95 percent, while the skim-solids content was 8.94 percent.
- In response to an increase in demand for products with high milk-fat content, dairy farmers have selected breeds, adjusted feeds, and made use of improved genetics to increase milk fat produced by dairy cows.
- Cheese is the dairy product category accounting for the largest percentage of the U.S. milk-fat supply, and that percentage has been growing.
- Fluid beverage milk is the dairy product category accounting for the largest percentage of the U.S. skim-solids supply, but that percentage has been declining.
Milk consists of water, milk fat, and skim solids. Skim solids include protein, lactose, minerals, and trace elements. The average percentages of both milk fat and skim solids in farm milk (cows’ milk from dairy farms) have increased in the last two decades. In 2000, U.S. farm milk contained 3.68 percent milk fat and 8.72 percent skim solids on average. By 2020, the milk-fat percentage had grown to 3.95 percent, and the skim-solids percentage had increased to 8.94 percent. For skim solids, content increased gradually from 2000 to 2020, while milk-fat content began rising in 2011, after remaining relatively steady from 2000 to 2010 (see figure below).
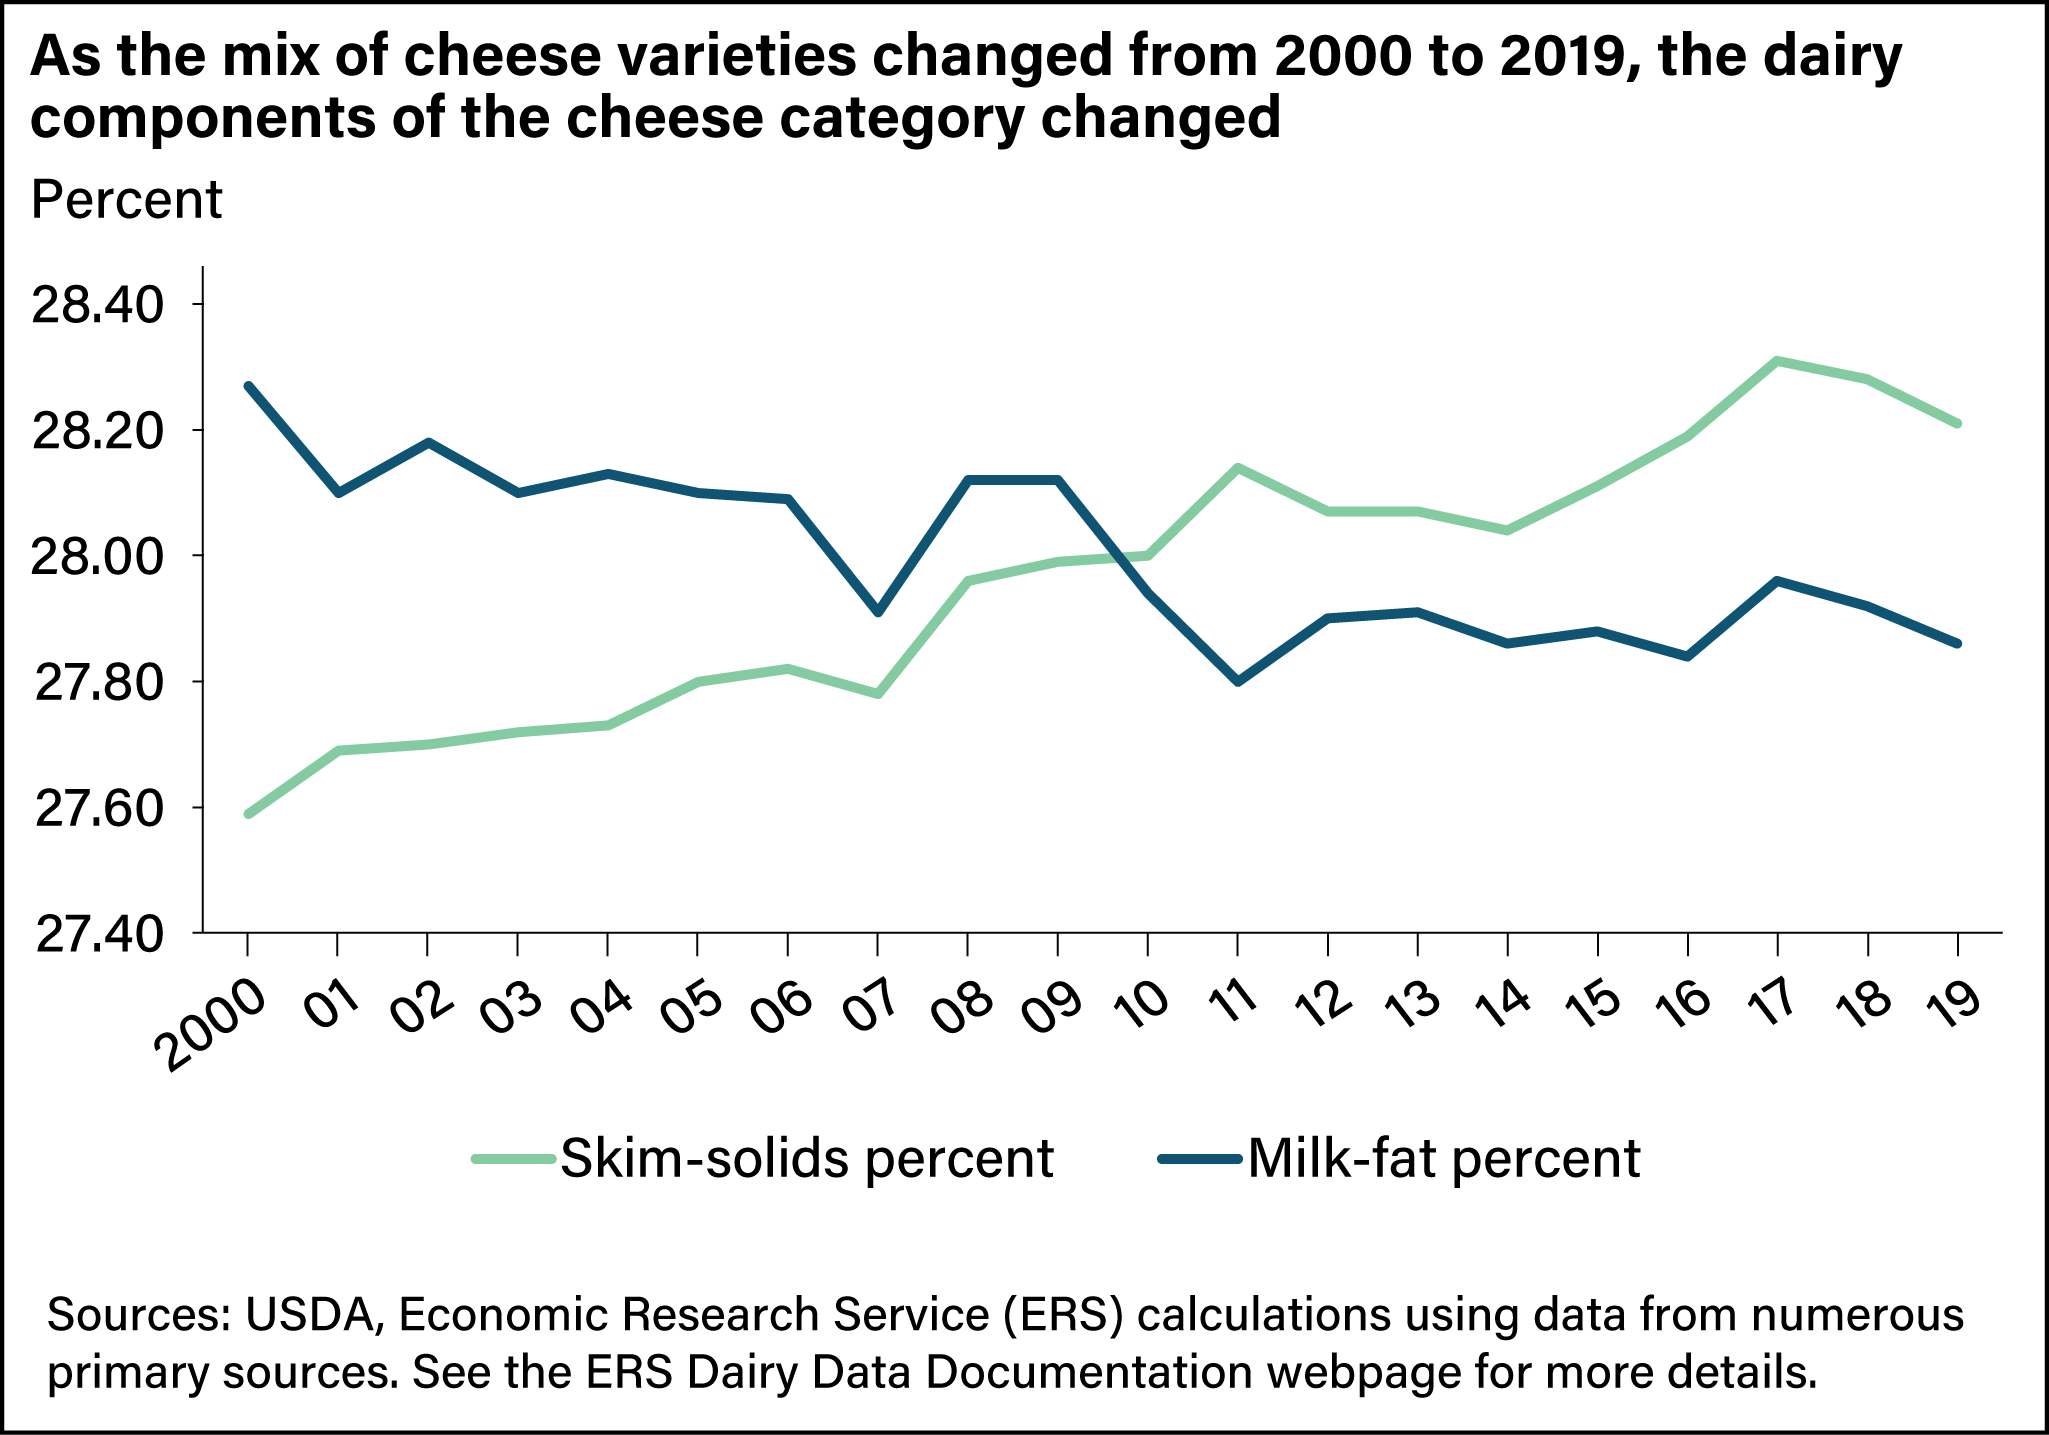
The Dietary Guidelines for Americans, published by USDA and the U.S. Food and Drug Administration, recommend “fat-free or low-fat milk, yogurt, and cheese, and/or lactose-free versions and fortified soy beverages and yogurt as alternatives.” While the Dietary Guidelines continue to recommend low-fat dairy, some studies receiving attention in the general media have indicated less of a health risk in milk-fat consumption than had been previously perceived. Other studies have suggested that there are nutritional benefits in milk fat. As a result, demand for higher-fat milk products has increased substantially over the last decade. Through an adjustment in production practices or shifting to breeds that produce higher fat milk, farmers have been able to increase fat content in the milk. While Holstein cows—the iconic black and white (or sometimes red and white) dairy cows—remain the predominant species of dairy cows in the United States, farms are increasingly shifting to other breeds, such as Jersey cows, which produce higher-fat milk naturally. Improvements in genetics of the major breeds and higher quality livestock feeds also have contributed to the increasing richness of milk.
Consumer Trends Shape Component Allocations in Fluid Milk and Cheese
USDA’s Economic Research Service (ERS) tracks the percent of milk fat and skim solids allocated or used among different dairy products in Supply and Allocation of Milk Fat and Skim Solids by Product, found at ERS’s Dairy Data web page. The data show that changes in consumption patterns from 2000 to 2019 (the most recent year for which complete data are available) influenced the percentages of milk fat and skim solids of the two largest dairy product categories, fluid beverage milk (hereafter simply called fluid milk) and cheese.
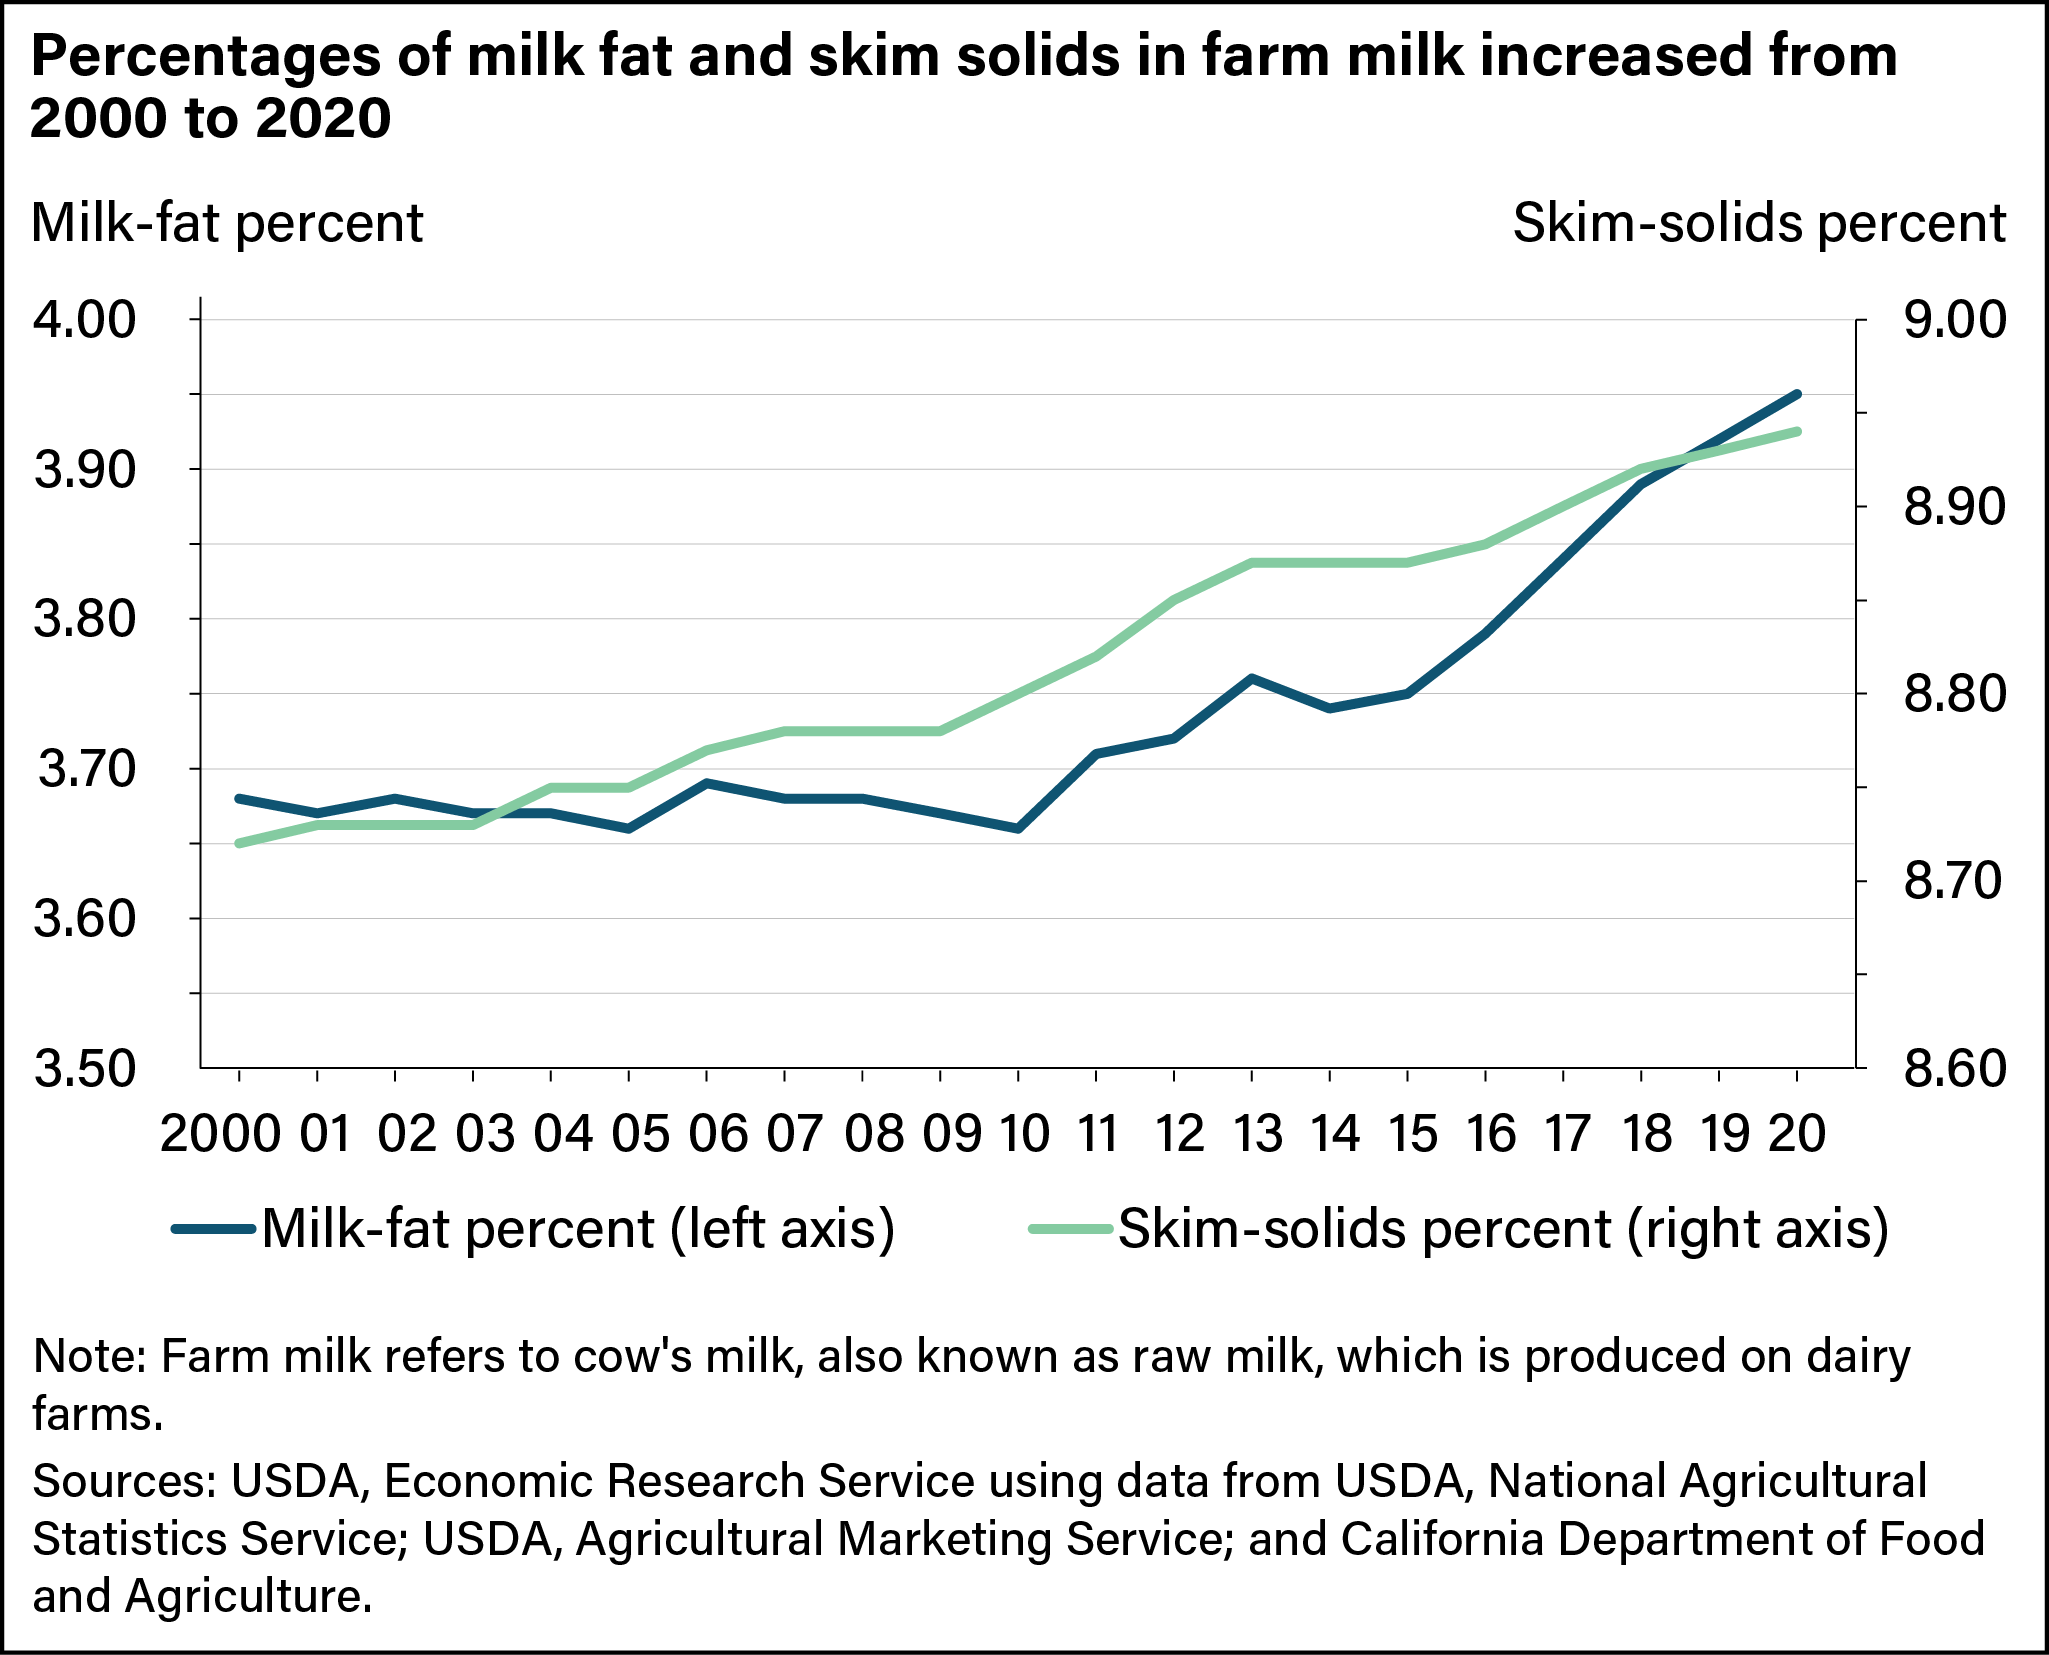
The average milk-fat content of fluid milk varied over the 20-year period, reflecting shifting consumer attitudes towards dietary trends for this dairy product. Fluid milk’s fat content averaged 2.01 percent in 2000 and fell gradually, reaching a low for the 20-year period of 1.83 percent in 2012 (see chart below). The decline was due to falling sales volumes of whole milk and rising sales volumes of lower fat milks. Subsequently, as consumers began to look at milk fat more favorably, whole milk sales increased and sales of lower fat milk varieties decreased. According to ERS fluid beverage milk sales quantities by product, in 2019, whole milk sales totaled 16.1 billion pounds, an increase of 16.3 percent from 13.8 billion pounds in 2012. The average milk-fat content for fluid milk reached 2.10 percent in 2019.
While milk-fat content of fluid milk declined and then rose over the 20-year period, the skim-solids content rose steadily from 8.95 percent in 2000 to 9.15 percent in 2019. The increase in average skim solids of fluid milk consumed can be mainly attributed to the increase in average skim solids of farm milk.
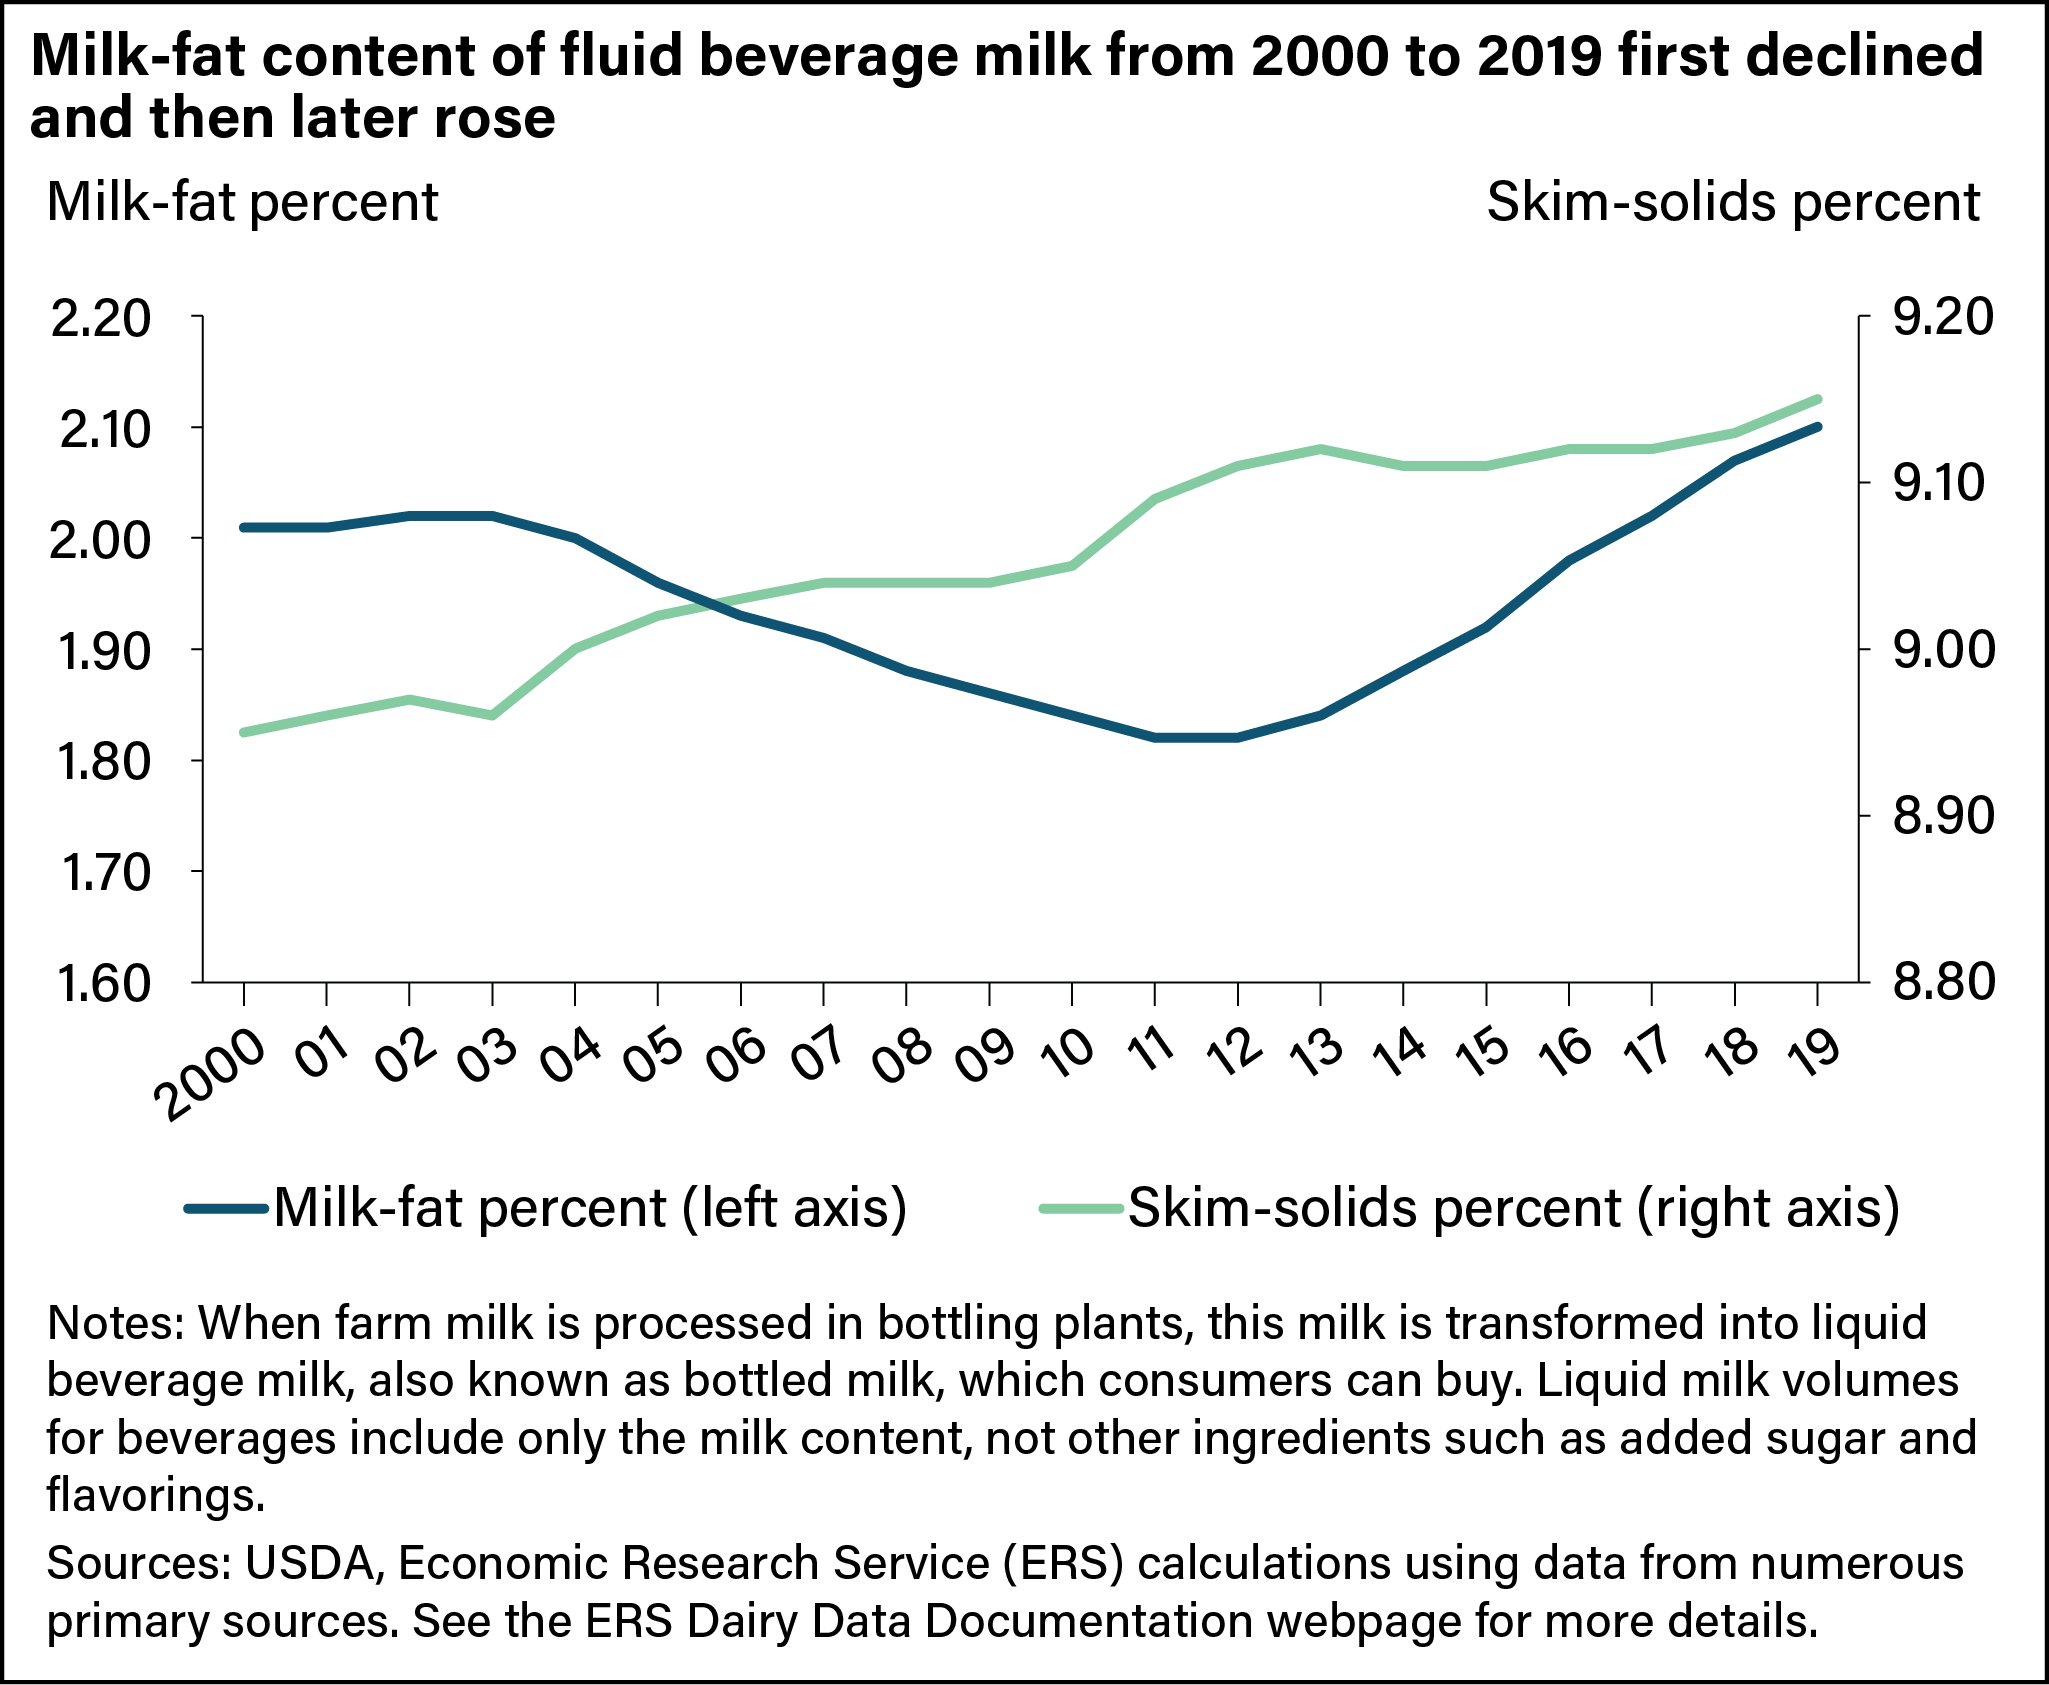
From 2000 to 2019, cheese consumption rose for most major cheese varieties. However, some varieties with lower milk-fat content grew at faster rates than others, and production rose to meet increasing consumer demand. Production of American-type cheeses (Cheddar, Colby, Monterey, and Jack) totaled 5.2 billion pounds in 2019, an increase of 44 percent from 2000. American-type cheeses tend to have a higher milk-fat content than other types. Production of other-than-American cheeses, led by mozzarella, totaled 7.9 billion pounds in 2019, an increase of 71 percent from 2000. During that time, the average milk-fat content of total cheese (other than cottage cheese) slipped from 28.27 to 27.86 percent, while the average skim-solids content increased from 27.59 to 28.21 percent.
Understanding ERS’ Milk-Fat and Skim-Solids Allocation Statistics
Almost all dairy products include both milk fat and skim solids. Cheese has substantial percentages of both, varying by the cheese variety. Even nonfat dry milk contains a trace of milk fat; butter contains a trace of skim solids. ERS estimates the amount of milk fat and skim solids in dairy products based on typical content. For example, Cheddar cheese is estimated to have a milk-fat content of 33.31 percent and a skim-solids content of 29.67 percent, though actual components may vary from these percentages.
ERS statistics concerning the allocation of milk fat and skim solids among dairy products are based on these components in the final products, not the components used as inputs in the manufacturing process. For example, not all components of farm milk used to produce cheese end up in the cheese. Some of the components end up in the whey (a watery byproduct), and some solids are lost in the process. In addition, ERS annual milk-fat and skim-solids allocation statistics are for dairy products produced in the United States, not for dairy products consumed in the United States. Some dairy products are exported to other countries or may be held as stocks at the end of the year for use in another year.
Some dairy products are used as ingredients in other dairy products. For example, dry milk products are often used as ingredients in cheese, frozen desserts, cultured dairy products, or fluid milk. To avoid double counting of milk solids for dry milk products, whey products, and evaporated and condensed milk, ERS provides “net use” estimates for these products, excluding the estimated milk fat and skim solids used as ingredients in other U.S. dairy products.
Cheese Has the Largest Allocation of Milk Fat Among Dairy Products
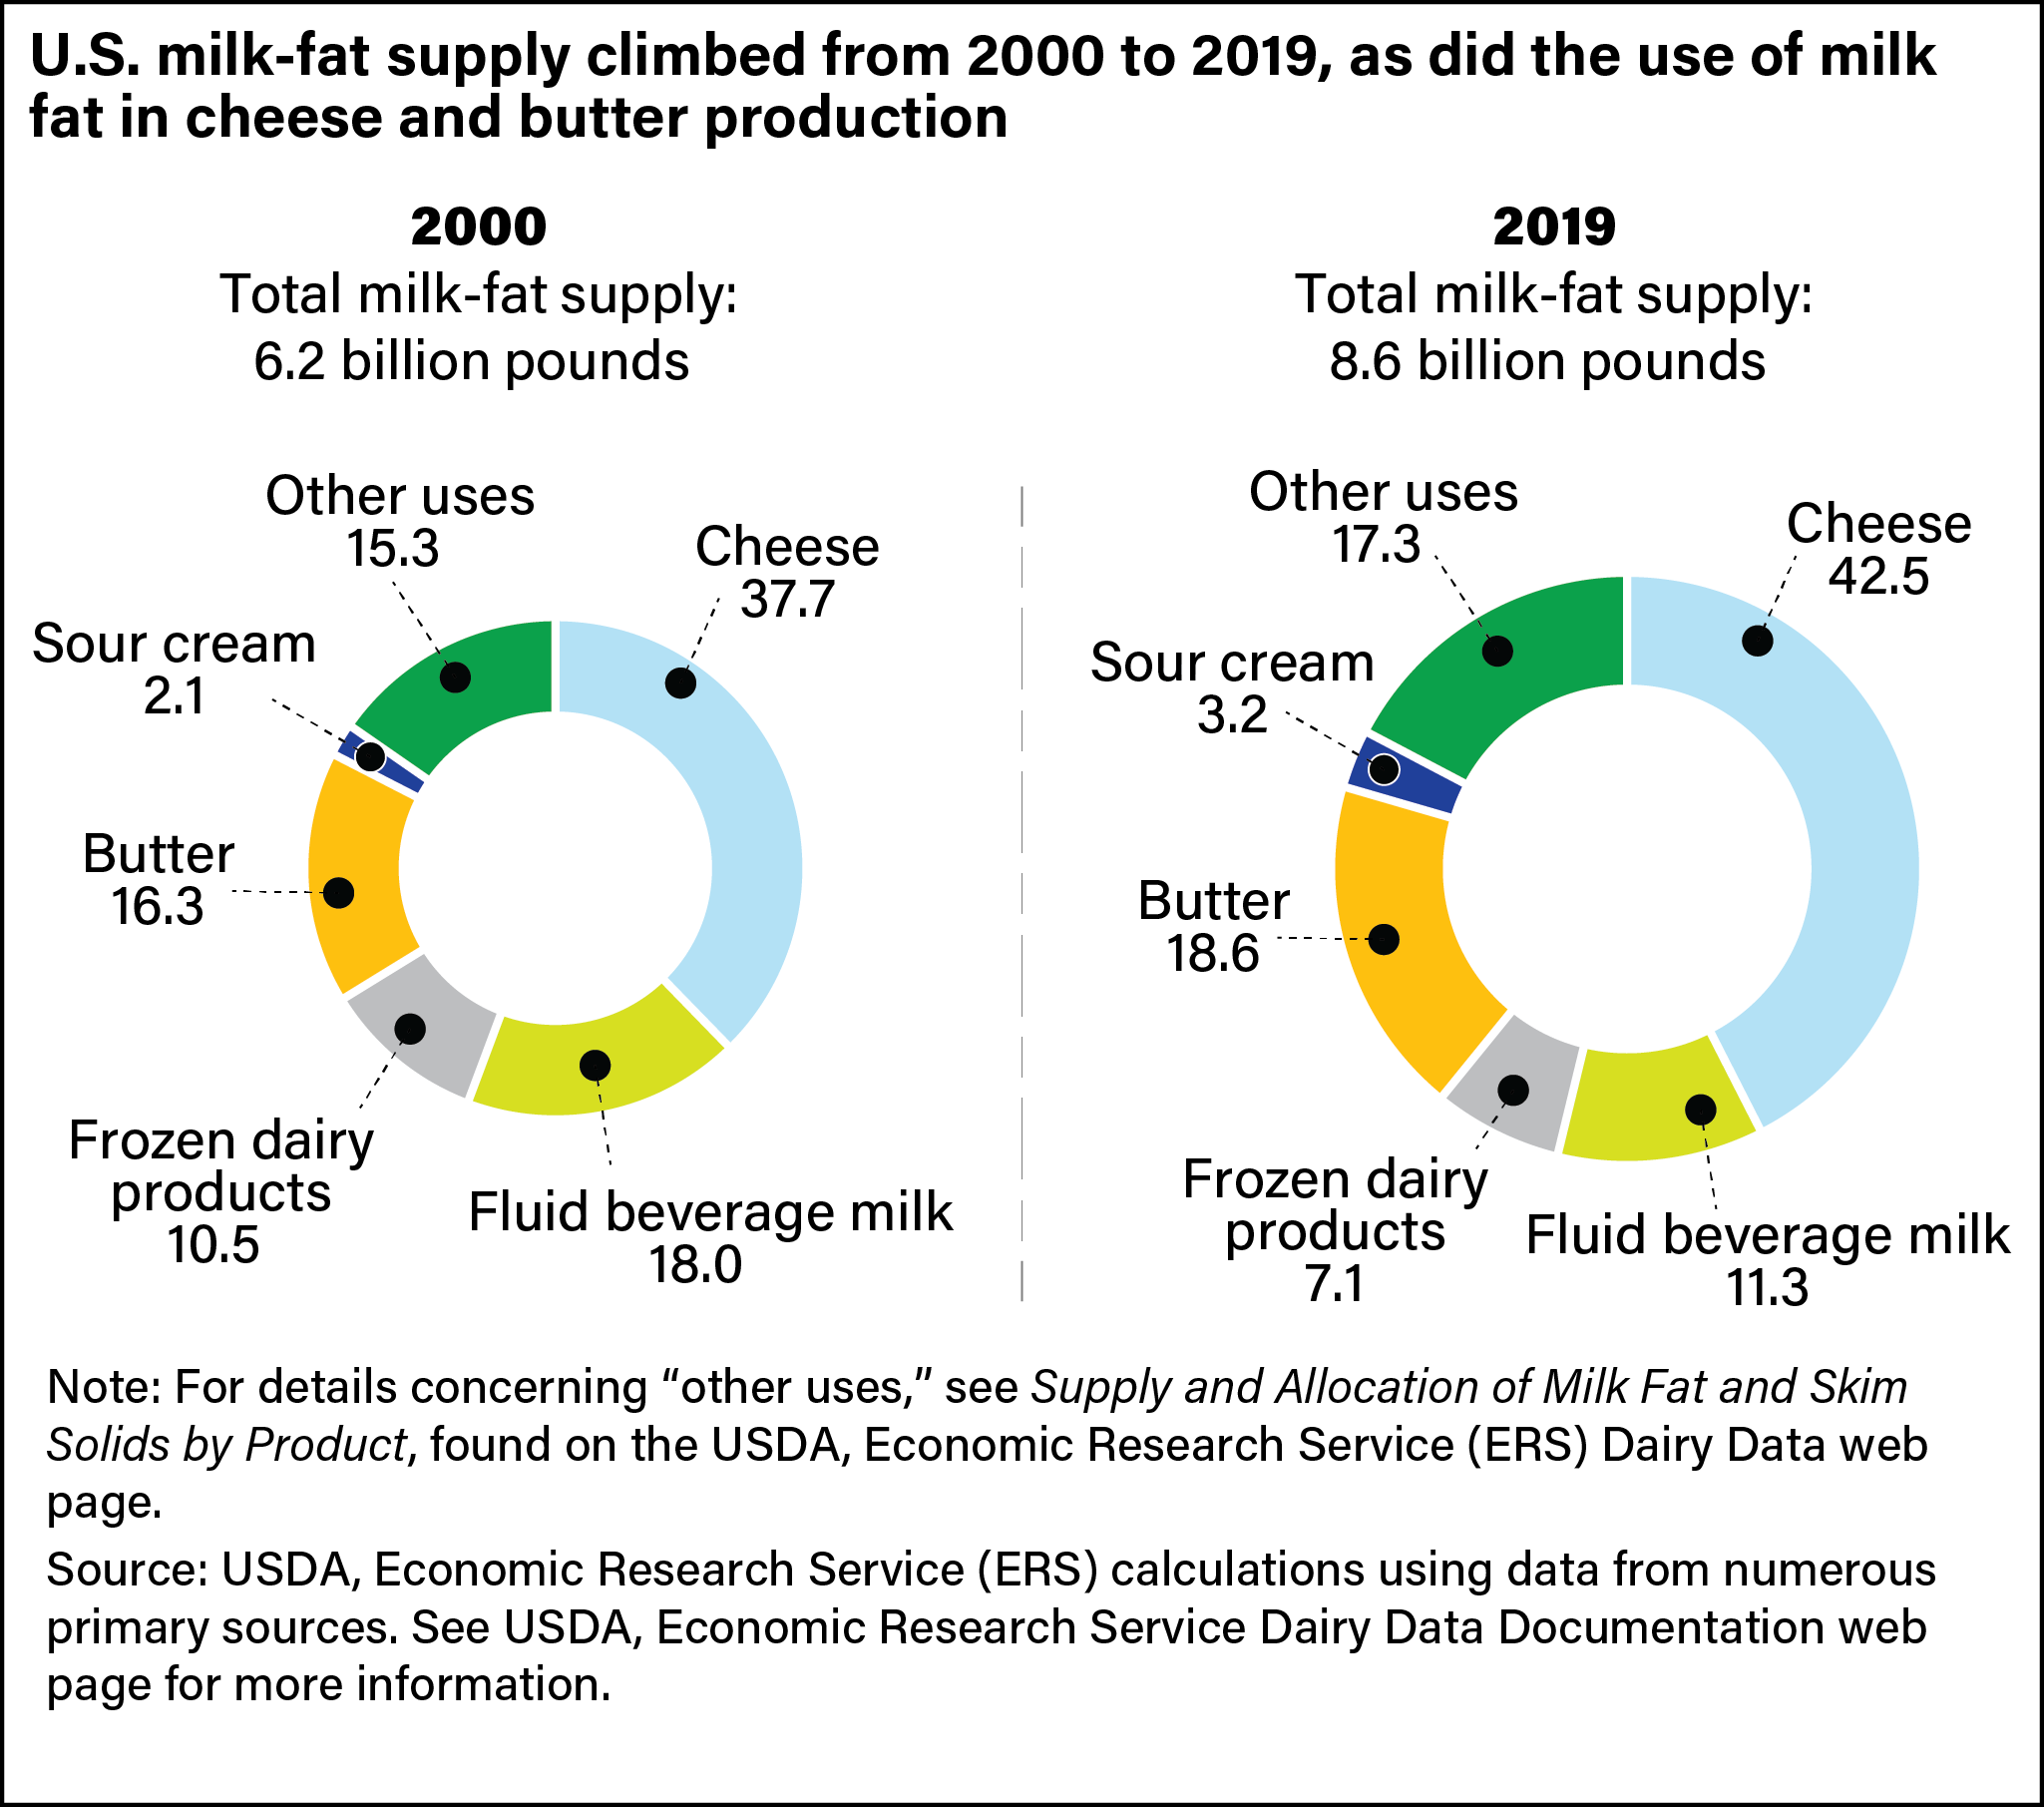
In 2019, the total supply of milk fat in the United States was 8.6 billion pounds, 39 percent higher than in 2000. Cheese is the dairy product category accounting for the highest proportional use of milk fat, and the proportion has been growing (see chart below). In 2019, milk fat allocated to cheese production represented nearly 43 percent of the total milk-fat supply, an increase of about 5 percentage points from 2000. Milk fat allocated for butter has also been growing. In 2019, this use represented almost 19 percent of the total milk-fat supply, an increase of more than 2 percentage points from 2000. In contrast to greater cheese and butter use of milk fat from 2000 to 2019, milk-fat allocation percentages for fluid milk and frozen products declined by roughly 7 and 4 percentage points, respectively.
Fluid Milk Has the Largest Allocation of Skim Solids, But for How Much Longer?
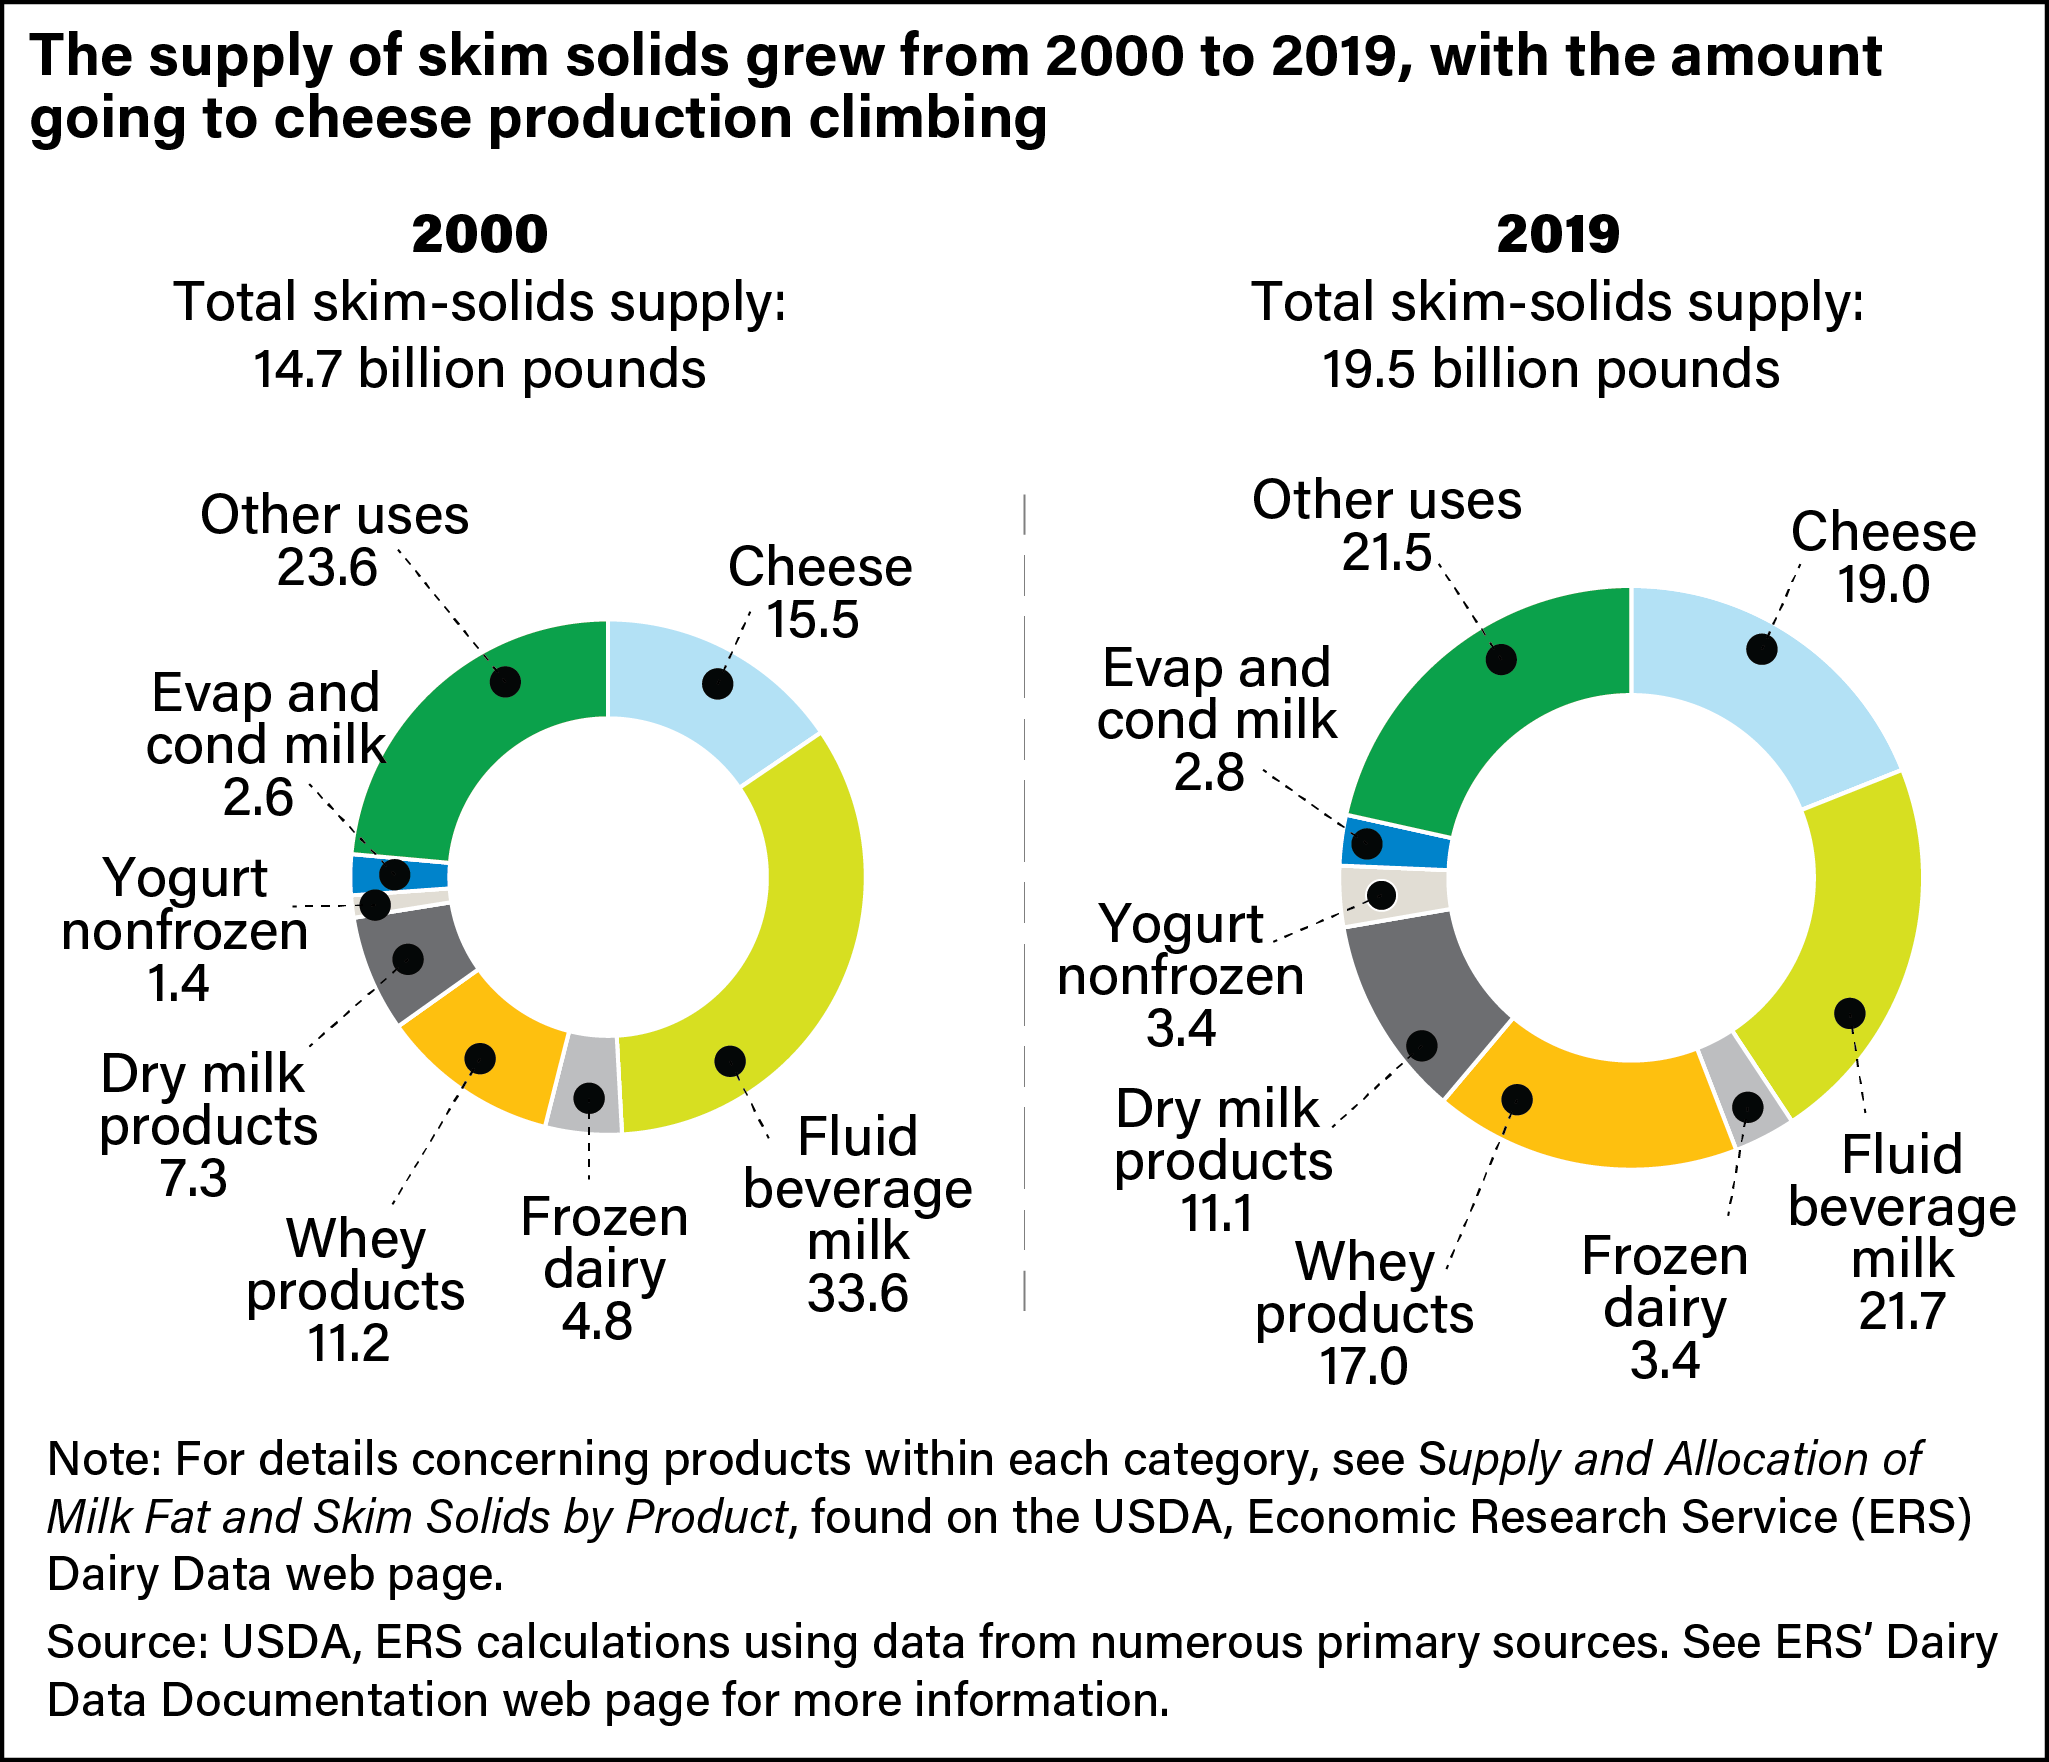
In 2019, the total supply of skim solids available for dairy processing and manufacturing was 19.5 billion pounds, 33 percent more than in 2000. Fluid milk accounts for the largest portion of skim-solids use, but that allocation has been declining over time. If this trend continues, cheese may overtake fluid milk as the largest use of skim solids within the next few years.
In 2019, skim solids used in fluid milk production represented 22 percent of the total supply, down 12 percentage points from 2000. Skim solids in cheese represented 19 percent of the total supply of skim solids in 2019, an increase of almost 4 percentage points from 2000. Skim solids for whey products (including dry whey, whey protein concentrate, lactose, and others) increased by about 6 percentage points. This growth is attributed to an increase in cheesemaking (because whey is a byproduct of cheesemaking) and growing whey product exports. Skim solids for use in dry milk products increased by 4 percentage points, largely because of growing export demand for skim milk powder.
This article is drawn from:
- Dairy Data. (n.d.). U.S. Department of Agriculture, Economic Research Service.