
Food Spending Adjustments During Recessionary Times
- by Aylin Kumcu and Phillip Kaufman
- 9/1/2011
Highlights
- During the 2007-09 recession, inflation-adjusted food expenditures by U.S. households fell 5 percent--the largest decrease in at least 25 years.
- Spending patterns differed by income level, with middle-income households curbing expenditures the most.
- Households responded to the recession by cutting back on eating out and by economizing on grocery purchases.
The 2007-09 recession was the longest period of economic decline since the Great Depression of the 1930s. Faced with falling incomes and economic uncertainty, many Americans economized on their food purchases in 2007-09. The decrease in aggregate food spending by all U.S. households during the recession, which officially began in December 2007 and ended in June 2009, represents the largest inflation-adjusted drop recorded by the Bureau of Labor Statistics' Consumer Expenditure Survey since the survey began in 1984.
A salient feature of the recent recession was a significant and sustained increase in unemployment. National unemployment averaged 9.3 percent in 2009, up from 4.6 percent in 2006. Real (inflation-adjusted) average household income fell from $60,533 in 2006 to $59,067 in 2009 (in 2006 dollars). In addition, food prices increased substantially during the early part of the recession. Food prices peaked in 2008, when the annual rate of food price inflation was 5.5 percent. Even though food prices started to decline in February 2009, the average annual growth rate was still almost 3.8 percent between 2007 and 2009. This double squeeze of lower incomes and higher food prices put pressure on consumer expenditures.
Consumers Reduced Food Spending . . .
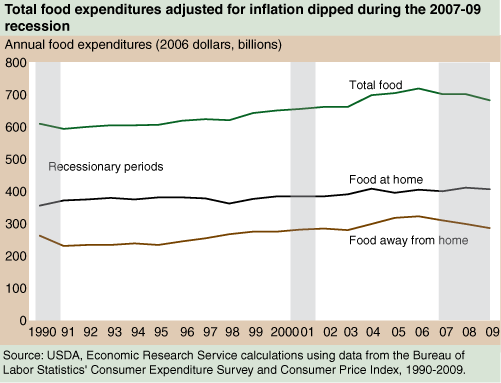
Two public data sources--ERS's Food Expenditure Tables and the BLS Consumer Expenditure Survey (CE)--track U.S. food spending over time, and both showed declines during the 2007-09 recession (see box, 'The ERS Food Expenditure Tables and BLS Consumer Expenditure Survey'). The CE data allow a look at household-level spending and trends. According to the CE, real total food spending by U.S. households declined 5 percent between 2006 and 2009. In 2006, before the recession began, total food spending by all households peaked at $726 billion, according to calculations based on the CE and the BLS Consumer Price Index. By 2008, real food spending in 2006 dollars was down to $709 billion, and in 2009, spending dropped even more, to $690 billion.
Annual reductions in food-away-from-home spending, such as at fast food places and sit-down restaurants, were largely responsible for the decrease in household food expenditures during the recession. Real away-from-home spending declined 11.5 percent between 2006 and 2009. Spending in the grocery aisle (food at home) increased from 2007 to 2008, as consumers replaced restaurant meals with at-home eating. In 2009, however, real at-home food spending dropped, as consumers economized further on their grocery bills.
Trends in per capita food expenditures over this period echoed the aggregate trends. Real average annual per capita food spending declined 6.6 percent, from $2,444 in 2006 to $2,283 in 2009 (in 2006 dollars). Food away from home fell 12.9 percent, accounting for most of the decline in per capita spending. At-home per capita food spending, on the other hand, decreased only 1.6 percent.
A look back at previous recessions shows that spending patterns varied. In the 1990-91 recession, spending responses were similar to those in the 2007-09 recession. During the 8-month 1990-91 recession, aggregate spending on total food declined 3.5 percent, with a 4.0-percent increase in at-home spending and a 13.8-percent drop in away-from-home spending.
The 2001 recession also lasted 8 months, but the increase in unemployment in that timeframe was less than in 1990-91. For the milder 2001 recession, there were smaller adjustments to food expenditures. Away-from-home food spending declined 0.4 percent, while at-home food spending increased 2.2 percent. Thus, overall food spending went up 1.1 percent.
. . . With Middle-Income Households Cutting Back the Most
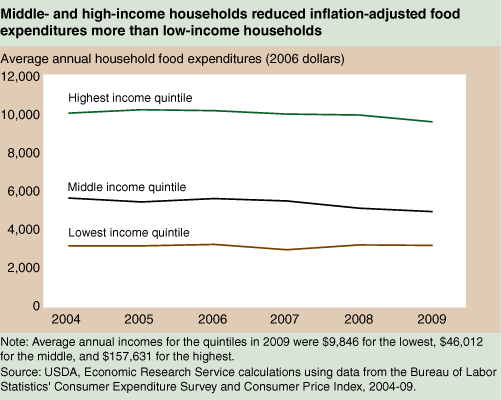
Aggregate expenditures can mask spending adjustments made by different types of households. CE data disaggregated by household demographics reveal that during the 2007-09 recession, middle-income households cut total food spending by more than any other group. Households in the middle quintile of income (the middle 20 percent of the income distribution), with an average income of $46,012, decreased their real food expenditures by 12.5 percent from 2006 to 2009. Households in the lowest quintile (average income of $9,846) cut spending 1.8 percent, while the highest quintile (average income of $157,631) reduced food spending 5.7 percent.
Food expenditures at home and away from home followed similar patterns, with away-from-home spending declining more than at-home spending among all five income levels. Real expenditures by middle-quintile households fell the most for both food at home (6.4 percent) and food away from home (20.8 percent). The lowest quintile households actually increased their real food-at-home spending during the recession by 3.2 percent, and they reduced food-away-from-home spending by 11.9 percent. The highest quintile households, on the other hand, trimmed their budgets for both food at home (2.8 percent) and food away from home (8.8 percent).
SNAP Relieved Some Pressure on Low-Income Households
Reductions in food expenditures by low-income households may not have been as large as those by middle-income households for several reasons. First, even before the recession, low-income households' food budgets were stretched thin, with little room for further reductions. Many low-income families were already spending less than the cost of USDA's Thrifty Food Plan. The Thrifty Food Plan specifies types and quantities of commonly consumed foods that can be prepared at home to obtain a nutritious, palatable diet at a low cost. In December 2009, the cost of the Thrifty Food Plan for a family of two adults and two elementary school-age children was $577 per month.
Data from the past 10 years of Current Population Survey Food Security Supplements show that households with incomes below the Federal poverty level spent an average of 7 percent less than the value of the Thrifty Food Plan on at-home food each week. In comparison, households with incomes above 185 percent of the poverty level spent 39 percent more than the value of the Thrifty Food Plan for their grocery foods.
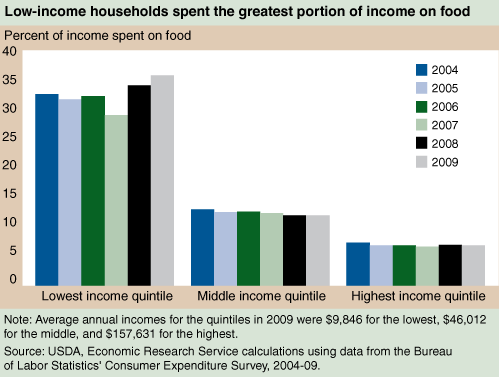
For low-income households, even these low levels of food expenditure account for a large share of household income. In 2006, households in the lowest income quintile spent 32.0 percent of their income on food. The recession led to increases in this already high share. Food spending as a share of income for households in the lowest income quintile grew to 35.6 percent in 2009--putting further pressure on thin budgets. Over the same period, food spending as a share of income declined for middle-income households from 12.5 to 11.9 percent and remained flat for the highest income quintile at 6.8 percent.
A second reason for the smaller drop in food spending by low-income households is the additional financial support given to these households from the American Recovery and Reinvestment Act of 2009 (ARRA). In April 2009, ARRA increased benefit levels for USDA's Supplemental Nutrition Assistance Program (SNAP, formerly known as the Food Stamp Program) and expanded eligibility for jobless adults without children. After these enhancements, SNAP participation and real food spending by low-income households increased--and food security improved. Food security is the ability to consistently provide adequate food for active, healthy living for all household members. A 2011 ERS study found that food security among low-income households increased by 2.2 percentage points from late 2008 to late 2009, while it remained unchanged among households with incomes somewhat above eligibility cutoffs for SNAP.
Tough Times Lead to Economizing
During the 2007-09 recession, Americans of all income levels tightened their belts, primarily by eating out less. According to ERS's Food Expenditure Tables, which include all sales by the food industry to consumers, governments, businesses, and nonprofit organizations, away-from-home food spending dropped from $533 billion in 2006 to $513 billion in 2009 (in 2006 dollars). Real sales at full-service restaurants dropped by 4.5 percent during the recession, and sales at limited-service eating places, such as fast food outlets, declined by 2.6 percent. Sales of meals and snacks also declined at all other food-away-from-home segments between 2006 and 2009, including hotels and motels (8.8 percent); stores, bars, and vending machines (7.3 percent); and schools and colleges (0.8 percent).
Food-at-home sales also declined during the recession. ERS's Food Expenditure data show that inflation-adjusted sales in this category fell 1.3 percent from 2006 to 2009--the only 3-year drop in real sales over the past decade. Previous ERS research found that the various ways American households save on their at-home food spending included taking advantage of sales, promotions, and coupons in stores where they regularly shop; substituting comparable, but lower cost foods; and seeking stores that offer lower prices and more cost-effective selections.
ERS research reveals that during the recession, sales of private label products, or store brands, continued to expand faster than sales of well-known national brands, partly because recession-strapped shoppers sought out these more economical options. In 2009, a record-setting 810 new private label food and beverage products appeared on U.S. retail shelves--7 times more than in 2001. Similarly, consumers looking to stretch their food dollars often cut back on convenience. ERS researchers examined recent sales of bunches of spinach, heads of lettuce, and washed packaged leafy greens. They found that sales of packaged leafy greens decreased relative to sales of unpackaged greens when consumers' incomes fell (see 'Consumers Cut Back on Convenience But Not Necessarily Quantity, When Incomes Fall').
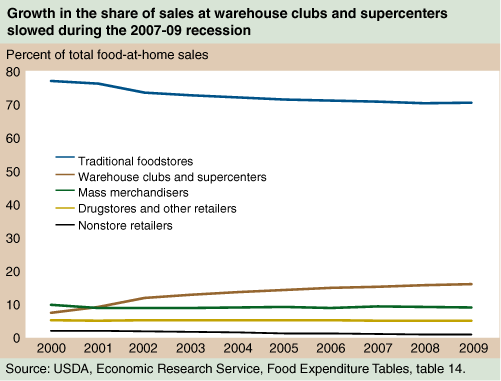
Households may also reduce food spending by shopping at different types of stores. The growth of food offerings by warehouse club stores and supercenters has expanded the range of shopping options available to consumers. ERS data on retail outlets show that traditional foodstores, including supermarkets, convenience stores, other grocery stores, and specialty food stores, have lost food sales shares to nontraditional foodstores, particularly warehouse clubs and supercenters. Between 2000 and 2006, the share of total retail food sales by traditional foodstores fell from 76.8 percent to 70.9 percent, continuing a long-term trend. The recession saw a slowdown of that trend, as the share of total food sales held by traditional foodstores fell only slightly to 70.2 percent in 2009. The share of food sales held by warehouse clubs and supercenters continued to increase during the recession, from 14.6 percent in 2006 to 15.8 percent in 2009.
Will Long-Term Trends Return?
The 2007-09 recession was a time of shifting food expenditure patterns. Many American households traded the convenience of eating out for the more time-intensive but potentially more frugal practice of eating in, and they shopped more carefully in the grocery aisle. Compared with the recent downturn, the recessions of 1990-91 and 2001 were of shorter duration. The severity and nature of the 2007-09 recession suggests that the recession of the mid-1970s (November 1973-March 1975) might be a better indicator of what's ahead. The 1973-75 recession was also characterized by spikes in world food prices and unemployment. Overall food spending took a hit as well, but it rebounded to pre-recession levels by 1976 as the economy recovered from the recession. Whether or not the food spending adjustments of the 2007-09 recession will continue in the post-recession era remains to be seen, but 2010 ERS data suggest that food spending has begun to recover.
This article is drawn from:
- Nord, M. & Prell, M. (2011, June 13). Food Security of SNAP Recipients Improved Following the 2009 Stimulus Package. Amber Waves, U.S. Department of Agriculture, Economic Research Service.
- Martinez, S. (2010, June 1). Recession Brings Record Number of New Store-Brand Food Offerings. Amber Waves, U.S. Department of Agriculture, Economic Research Service.
- Kuchler, F., Tegene, A., Harris, M., Leibtag, E., Binkley, J., Canning, P., Dooley, R., Eales, J., Martinez, S., Tsigas, M., Lee, C., O'Roark, B., Aldrich, L., Blisard, N., Allen, E. & Schluter, G. (2004). Current Issues in Economics of Food Markets. U.S. Department of Agriculture, Economic Research Service. AIB-747.
You may also like:
- Consumer and Producer Price Indexes. (n.d.). U.S. Department of Agriculture, Economic Research Service.
- Processing & Marketing. (n.d.). U.S. Department of Agriculture, Economic Research Service.