


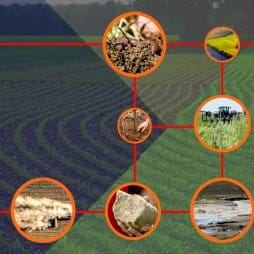
Resource and Environment
(Selected research findings from FY 22)
 Farmers reported at least one resource concern for 49 percent of represented fields for soybeans, oats, cotton, and wheat
The U.S. Department of Agriculture’s (USDA) Natural Resources Conservation Service (NRCS) provides conservation planning and field-level assessments of conservation strategies and serves as one of multiple sources from which agricultural producers can receive conservation technical assistance. This report looks at how many fields in oats, cotton, wheat, and soybeans have farmer-reported, on-field resource concerns and whether farmers received technical assistance to address these concerns from USDA or other sources. Farmers report that 49 percent of these fields have at least one resource concern and 26 percent have multiple resource concerns. Of the fields represented with at least one resource concern, 24 percent received technical assistance. Sixty-seven percent of assisted fields received assistance from USDA, NRCS.
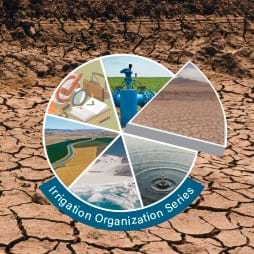 One-fifth of irrigation organizations have a formal drought plan
Drought can have a major impact on irrigated agricultural production. This report summarizes information from USDA’s 2019 Survey of Irrigation Organizations about irrigation organizations’ role in drought planning and response. Drought plans are most common for larger water delivery organizations and groundwater management organizations. Large water delivery organizations, defined as those serving at least 10,000 irrigable acres, serve almost four-fifths of all farmlands irrigated with off-farm water. The most common component of these organizations’ drought plans is guidance on how water use will be restricted during a drought.
 Irrigated agriculture has expanded significantly over the last century
Irrigated agriculture generates substantial value for the broader U.S. agricultural economy. This report describes historical and emerging trends in irrigation use in the U.S. agricultural sector. In 2017, irrigated farms accounted for more than 54 percent of the total value of U.S. crop sales, while irrigated cropland constituted less than 17 percent of total harvested cropland. The expansion of irrigation in the United States has fostered the growth of a robust and diverse agricultural crop sector. However, the irrigated sector faces continued increases in water demand from competing users and increasingly constrained water supplies.
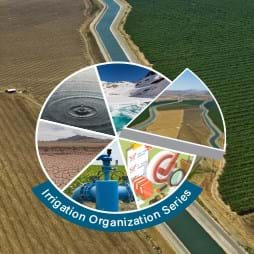 Fewer than 20 percent of organizations that deliver water directly to farmers own or operate their own storage reservoirs
This report summarizes information from the U.S. Department of Agriculture’s (USDA) 2019 Survey of Irrigation Organizations (SIO) about the water storage, conveyance, and metering infrastructure owned and managed by irrigation organizations. This infrastructure is vital in irrigation organizations’ ability to deliver water to farms and ranches. Large water delivery organizations, defined as those serving at least 10,000 irrigable acres, are more likely to own water storage infrastructure and tend to have greater storage capacity per irrigable acre.
 Producers’ net costs influence offers to USDA’s Conservation Reserve Program
To enroll in the USDA’s Conservation Reserve Program through its General Signup, cropland owners and producers offer to establish a specific cover practice on their fields in return for a rental rate at or below a maximum set by USDA’s Farm Service Agency (FSA). Every offer receives its own score using a ranking tool called the Environmental Benefits Index (EBI) that reflects differences in environmental characteristics, conservation cover quality, and cost. FSA ranks offers by EBI and accepts only those offers with an EBI greater than a threshold selected by the USDA. Cover practices with higher EBI points typically cost more to establish, creating a tradeoff between conservation benefits and cost for program participants and for USDA. Overall, producers are less likely to offer acreage in a cover practice as that practice becomes more expensive.