


Agricultural Economy
(Selected research findings from FY 22)
 Agricultural employment and total hours worked fell considerably in the last seven decades, while agricultural output nearly tripled during the same period
This report discusses the contribution of farm labor to U.S. agricultural growth over a seven-decade period between 1948 and 2017. It assesses the changing composition of the U.S. farm labor force with special attention to the changes in educational attainment among farm operators and other workers. The report finds that the negative effects of the decline in total labor hours worked toward agricultural output growth were partially offset by increasing labor quality, such as increased educational attainment. Increased labor quality accounts for about 0.11 percentage points of the 1.53-percent annual agricultural output growth. The average annual rates of labor productivity growth and total factor productivity growth would have been overstated by 13 percent and 8 percent, respectively, if labor quality changes were not accounted for in the measurement.
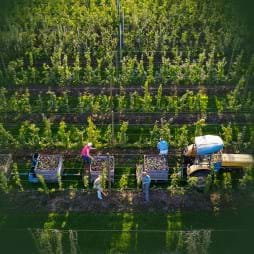
 Specialty growers increased the value of their crops insured by Federal Crop Insurance Program (FCIP) products from about $12 billion in 2011 to about $21 billion in 2020 (not adjusted for inflation)
This study looked at recent changes in how specialty crop farmers used the Federal Crop Insurance Program (FCIP) and Noninsured Crop Disaster Assistance Program (NAP). It compared differences among conventional and organic farms and investigated the reasons some farmers chose to participate in these programs. In 2017, FCIP or NAP insured a large portion of acreage for some crops: about 93 percent for dry peas, 92 percent for dry beans, 87 percent for plums and cherries, and 83 percent for tomatoes.
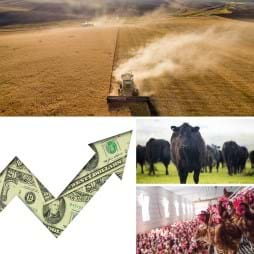
 Starting in June 2020, slaughter rates rebounded and were back to above 90 percent of 2019 weekly rates for cattle and hogs
This COVID-19 Working Paper described many of the ways that meat and poultry supply chains reacted and adapted to the COVID-19 crisis in 2020. The paper described the COVID-19 crisis as it related to the meat industry and then it explored how various supply chain actors responded to the onset of the pandemic. For each supply chain node, it explains the recovery trajectory through 2020. It examines meat processing, livestock producers, wholesale markets, the cold storage stocks of meat, and retail markets in the context of COVID-19.
 The H-2A Temporary Agricultural Worker Program expanded rapidly over the past decade, increasing from 75,000 H-2A workers in 2010 to 275,000 in 2020
Labor availability is an increasingly important issue for agricultural producers considering the evidence of recent tightening of U.S. farm labor markets. The H-2A Agricultural Guest Worker program allows U.S. agricultural employers that anticipate labor shortages to hire foreign workers on a temporary or seasonal basis. This report analyzed—by State, industry, and type of employer— the job offers of U.S. agricultural employers that sought U.S. Department of Labor certification in fiscal year 2020. The number of jobs certified to be filled with H-2A workers increased from around 75,000 in FY 2010 to around 275,000 in FY 2020. Six States accounted for 55 percent of H-2A jobs certified: Florida (14 percent), Georgia (10 percent), Washington (10 percent), California (9 percent), North Carolina (8 percent), and Louisiana (4 percent).
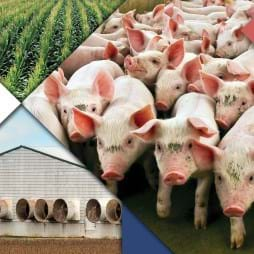 U.S. Hog Production has increased output and expanded exports since the early 1990s
This study examined changes in hog production from 1992 to 2017. During this period, production contracts became the most common business model in hog production, and hog farms grew larger and more specialized. Although the number of hog farms has declined over time, the typical farm has become larger, and the regional pattern of production has changed. Between 2012 and 2017, the number of hog farms increased after declining for 15 years. Also during this period, the average size of hog farms grew slightly larger, and the regional distribution of hog production continued to shift. Technological advancements improved productivity, though changes in production costs were mixed.
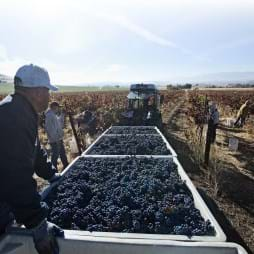
 Selected U.S. Fresh Fruit and Vegetable Industries are Adjusting to Higher Labor Costs
Farm labor is often a major cost of production for growers of fresh fruit and vegetables. This report examined how U.S. producers of selected labor-intensive fresh fruit and vegetables are addressing the rising costs of labor. Farm labor costs increased from 2010-19 for several reasons, including fewer newly arrived unauthorized workers, rising State minimum wages, and new requirements to pay overtime wages to some farm workers. Techniques to adjust to rising farm labor costs in fruit and vegetable production include labor-saving mechanization, such as harvesters, that replace labor; using H-2A workers to fill jobs when domestic workers cannot be found; and reducing domestic production of crops that are not competitive with imports.
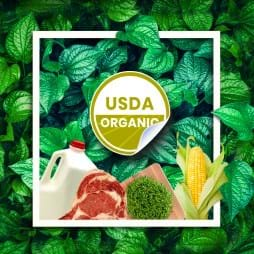 Despite an increase in organic production and market information, growers continue to face challenges related to thin markets
Many organic products are traded in thin markets that involve a small number of buyers and/or sellers, low liquidity, and fewer observable transactions compared with markets for conventional commodities. Longstanding concerns about pricing power have intensified as larger players have entered the market and as contracting relationships between buyers and sellers have grown more prevalent. According to USDA’s Organic Production Survey, in 2016 about 8.4 percent of vegetables and 4.3 percent of fruits and nuts were organic, but market shares for organic grains, dairy, and livestock remained very small, with dairy the highest at 2.9 percent.
This COVID-19 Working Paper compares 2020 values for farm sector financial ratios before and after the onset of the Coronavirus (COVID-19) pandemic. It categorizes sector-level ratios into four groups: solvency, efficiency, liquidity, and profitability. Results show the values for some financial ratios were worse in 2020 than forecast, while others were better in 2020 when compared with pre-pandemic expectations. All solvency, liquidity, and profitability ratios for 2020 were weaker than their respective average ratios obtained from 2000 to 2019.
This report provides statistics on U.S. farms, including production, financial performance, pandemic assistance, and farm household characteristics by farm size. It also contains a special section that explores changes in direct sales, pandemic-related off-farm job loss and furloughs, farm operating expenses, and the distribution of USDA and non-USDA pandemic assistance received in 2020. Small-farm households experienced the greatest job losses with 12 percent of households affected. On the other hand, 6 percent of households operating midsize and large-scale farms experienced a job loss or furlough.
 Net cash farm income for all farm operations from 2009 through 2019 endured a series of multi-year swings not seen since the 1970s
The agricultural economy experienced pronounced volatility over 2009–19, including strong periods of expansions in the first part of the decade followed by several years of contraction. This report, produced periodically since 1984, presents and assesses recent trends in three major areas of farm finance: farm income, Government payment programs, and Chapter 12 bankruptcy eligibility and rates.