Food, Nutrition, and Food Safety
(Selected research findings from FY 22)
ERS projects the food security situation in 77 low- and middle-income countries through 2032
ERS annually publishes the International Food Security Assessment (IFSA) to inform U.S. policymakers as well as international donor organizations of the food security situation in 77 low- and middle-income countries. The report provides projections of food demand and access based on ERS’s food security model, which allows for analysis of income and price changes on food security. This year’s report contained a special section that analyzes the potential implications of recent input price increases and Russia's military invasion of Ukraine on international food security. Food security in IFSA countries was projected to deteriorate in 2022 due to the continued effects of the COVID-19 pandemic and high input and commodity prices that have been intensified by the Russian military invasion of Ukraine.
This COVID-19 Working Paper complements existing macroeconomic projections of food insecurity, based on expected changes in income and prices, by providing discussions of local-level, microeconomic differences in food insecurity. The review focuses on studies conducted in low- and middle-income countries that include household survey data, measuring food insecurity, collected both before and after the onset of the COVID-19 pandemic. In total, eight studies were reviewed—seven from countries in Sub-Saharan Africa and one from India.
Most U.S. households have consistent, dependable access to enough food for active, healthy living—they are food secure. However, some households experience food insecurity at times during the year, meaning their access to adequate food is limited by a lack of money and other resources. In 2021, 89.8 percent of U.S. households were food secure. The remaining 10.2 percent (13.5 million households) were food insecure. Children were food insecure at times during 2021 in 6.2 percent of U.S. households with children (2.3 million households), down from 7.6 percent in 2020 and not significantly different from the 6.5 percent in 2019.
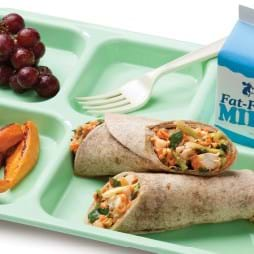
Nutrition standards for the USDA’s National School Lunch Program were updated in 2012, with changes requiring more fruit and vegetables. In the years following implementation of updated nutrition standards, foods made available to schools through the USDA Foods Program included more products that supported achievement of the standards, such as dark green vegetables and whole grains. Product offerings were also included with reduced fat, sodium, and sugar content. The percent of fruits and vegetables distributed through the USDA Department of Defense Fresh Fruit and Vegetable Program rose sharply, from 6 percent of total USDA Foods distributed in 2012 to 15 percent of total USDA Foods entitlement funds used in 2017.
This report updates estimates of low-income and low-foodstore-access census tracts listed in the USDA, Economic Research Service’s Food Access Research Atlas, using a 2019 directory of foodstores and 2014–18 American Community Survey data on household vehicle access and family income. Low-income status is given to census tracts that have a poverty rate of at least 20 percent or a median family income at or below 80 percent of the metropolitan area or State median income level. The number of census tracts classified as low income decreased from 30,870 in 2015 to 30,287 in 2019—by approximately 2 percent.
The U.S. Department of Agriculture (USDA) administers 15 domestic food and nutrition assistance programs that together affect the lives of millions of people and account for roughly two-thirds of USDA’s annual budget. Spending on USDA’s domestic food and nutrition assistance programs in FY 2021 reached a historic high of $182.5 billion, 43 percent greater than the previous inflation-adjusted high of $127.5 billion in FY 2020. The increase in spending was primarily driven by increases in USDA’s Supplemental Nutrition Assistance Program (SNAP) and Pandemic Electronic Benefit Transfer (P-EBT) spending. On average, 41.5 million people participated in SNAP each month. A temporary benefit increase, the expansion of emergency allotments, and higher participation contributed to a historic high in Federal SNAP spending of $113.8 billion, 44 percent more than in FY 2020.
While the U.S. food system has been largely able to maintain operations and provide consumers with the variety of foods they desire since the COVID-19 pandemic began, U.S. households faced sharply higher food prices for many staple items, especially meat in 2020. In this study, ERS researchers examined U.S. households’ meat purchases at retail stores for at-home consumption during the pandemic and compared them to before the virus outbreak. Retail food prices rose about 3.4 percent during 2020, almost twice their usual rate. Meat prices increased at a faster rate, with retail beef and pork prices rising 25 percent and 12 percent, respectively, in June 2020, year-over-year.
Identifying contaminants in imported foods and refusing contaminated shipments help minimize the risk of foodborne illness from foreign products and are essential to keeping U.S. consumers safe. This report uses import refusal data from the U.S. Food and Drug Administration (FDA) from 2002 to 2019 to explore import refusals based on contamination with pathogens and toxins. After Salmonella, Listeria violations accounted for 11 percent. Annually, the number of violations for Salmonella peaked in 2011, then declined.
 The economic cost of foodborne illness was about $17.6 billion in 2018
This report updates 2013 estimates of the economic burden of the 15 leading foodborne pathogens for inflation and income growth. ERS estimates of the economic burden of foodborne disease include the social costs of medical care, lost productivity, and premature death. Due to inflation, the cost of foodborne illness rose from $15.5 billion in 2013 to $17.6 billion in 2018. The top five pathogens—Salmonella, Toxoplasma, Listeria, norovirus, and Campylobacter— accounted for 90 percent of 2018 costs. Increases in the price of hospital care drove 74 percent of the increase in the total cost of medical treatment for foodborne illnesses from all 15 pathogens.
Using household-level data collected by the World Bank, this COVID-19 Working Paper shows differences in food security over time during the pandemic between rural and urban areas as well as between female- and male-headed households in Burkina Faso, Ethiopia, Malawi, and Nigeria. Analysis of data collected during the pandemic showed a sharp increase in food insecurity in the early months of the pandemic with a subsequent gradual decline. Additionally, this report finds that a larger increase in food insecurity occurred in rural areas relative to urban areas within each of these countries.
 Prior to 2020, total food expenditures had been increasing for two decades
ERS analysis shows that during the COVID-19 Recession, while total food expenditures fell, food spending at places like grocery stores and supercenters increased. This increase in food-at-home spending was mostly driven by a shift away from food spending at places like restaurants and fast-food places. After adjusting for inflation, total food expenditures per capita in 2019 were up 25.2 percent since 1997, rising each year except for the recession years of 2008 and 2009. By contrast, total food expenditures per capita in 2020 were down 8.8 percent compared with 2019.
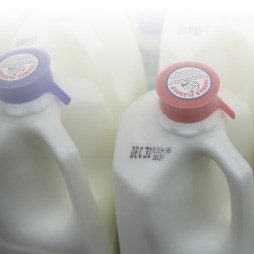
 Milk consumption decreased among children, teenagers, and adults between 2003-18
ERS researchers examined how consumption among children, teenagers, and adults changed over the years from 2003 through 2018, including changes in the amounts of milk that each group consumed as a beverage, added to cereal, and added to other types of beverages like coffee and tea. In 2003–04, individuals drank about 0.57 cup-equivalents of milk and milk drinks per person, per day. That number fell to 0.53 cup-equivalents in 2009–10 and to 0.33 cup-equivalents in 2017–18.
The three most frequently redeemed food instruments (FIs) in California account for over 30 percent of total WIC food costs in the State. Together they cover combinations of many of the most common food items provided to participants nationally, specifically low-fat milk, cheese, eggs, 100-percent fruit juice, ready-to-eat breakfast cereals, and whole grains. In this report, ERS researchers found that restricting participant product selection to the least expensive brand (LEB) of low-fat milk, cheese, eggs, 100-percent fruit juice, and whole grains led to food-cost savings for the three most frequently redeemed FIs—ranging between 4.6 percent and 18.2 percent compared with a baseline of random shopping among eligible products and brands.
This COVID-19 Working Paper assesses the extent to which the child nutrition infrastructure was able to rapidly adapt to meet the needs of children after the Coronavirus pandemic unexpectedly forced the closure of schools and childcare providers. It examines the extent to which USDA waivers and the expansion of free meal sites helped to compensate for the unexpected disruption to meal provision through the National School Lunch Program, School Breakfast Program, and Child and Adult Care Food Program from March through May 2020.


 ERS researchers reviewed emerging microeconomic literature on observed changes in food insecurity associated with COVID-19
 ERS examines changes in food choices in the USDA Foods program during 2006–17 in response to revised nutrition standards
 The number of census tracts classified as low income decreased by about 2 percent between 2015 to 2019
 During 2020, U.S. households increased their spending on meat for at-home consumption by 14.5 percent
 From 2002 to 2019, Salmonella violations accounted for 79.8 percent of pathogen/toxin violations for imported food
 Estimated food-cost savings at large WIC-authorized food retailers in California ranged from $16.1 million to $30.5 million annually from implementing least expensive brand requirements