


Resources and Environment
(Selected research findings from FY18)
Conservation tillage practices vary widely across crops and regions.
Reducing tillage and increasing soil cover of farm fields can enhance soil health and lead to improved agricultural productivity, greater drought resilience, and better environmental outcomes. ERS researchers used field-level data to estimate tillage, residue and cover practice adoption. Almost 50 percent of corn, soybean, wheat, and cotton acreage was in no-till or strip-till at some time over a 4-year period but only about 20 percent of these acres were in no-till or strip-till all 4 years. For individual crops, the rate of no-till varies by region. Adoption of residue and cover practices also varies across crops and, to some extent, across tillage practices.
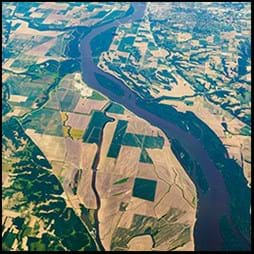 Simulated strategies for cost-effective nutrient reductions in the Mississippi-Atchafalaya River Basin involve a mix of practices.
The Gulf of Mexico’s summer hypoxic zone, extending up to nearly 6,000 square miles, is fueled by nitrogen and phosphorus runoff from the Mississippi/Atchafalaya River Basin (MARB), a region with 73% of U.S. cropland. A recent ERS report assessed the most cost-effective way of achieving a 45-percent reduction in cropland nutrient loads to the Gulf, which would significantly reduce the average size of the hypoxic zone. The study found that reductions are achievable using a mix of strategies, including onfield management practices, off-field practices such as wetlands and buffers, a shift in crops, and cropland retirement. Meeting the intended goal of reducing nutrient discharge, regardless of region of origin, focuses efforts in the Lower Mississippi sub-basin. A broader approach that requires regional nutrient reductions to be proportional to baseline contributions to the Gulf runoff spreads the conservation effort more widely across the MARB. Adopting such practices to meet water quality goals also increases commodity prices, resulting in more intensive production outside the MARB, and increased nutrient and sediment loadings to water in other watersheds.
Most farm operators and landlords do not own the oil and gas rights associated with their land.
With the shale revolution, oil and gas production in the United States grew by 69 percent from 2005 to 2014, and almost 67 percent of the production occurred on farmland in 2014. ERS research examined the extent to which farm operators and landlords own the rights to the oil and gas beneath their land, which affects their ability to benefit financially from development and to shape the terms on which it occurs. In the counties with oil and gas production in 2014, only 13 percent of non-operator landlords and 10 percent of farm operators (including both owner-operators and renters) reported receiving payments from gas or oil production. Recipients owned $32.9 billion in oil and gas rights that generated $7.4 billion in payments through leases with energy firms—almost 17 percent of total net cash farm income for operators and non-operator landlords with land in these counties.
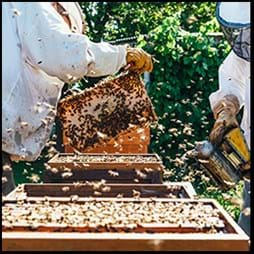 Despite higher winter loss rates, U.S. honey bee colony numbers have remained stable or risen since 1996.
This ERS research provided an overview of the pollination services market and the mechanisms by which beekeepers, farmers, and retail food producers adjust to increasing scarcity in the pollination services market. It also examined the evidence on pollinated crop production, pollination service fees, and annual numbers of honey bee colonies. Among pollinated crops, almonds and plums have had the largest increases in pollination service fees, rising about 2.5 and 2.4 times, respectively, in real (inflation-adjusted) terms since the early 1990s. For other pollinated crops, pollination service fees have risen at an average annual rate of 2-3 percent, and have not shown a marked increase since Colony Collapse Disorder appeared in 2006.