
Key Statistics
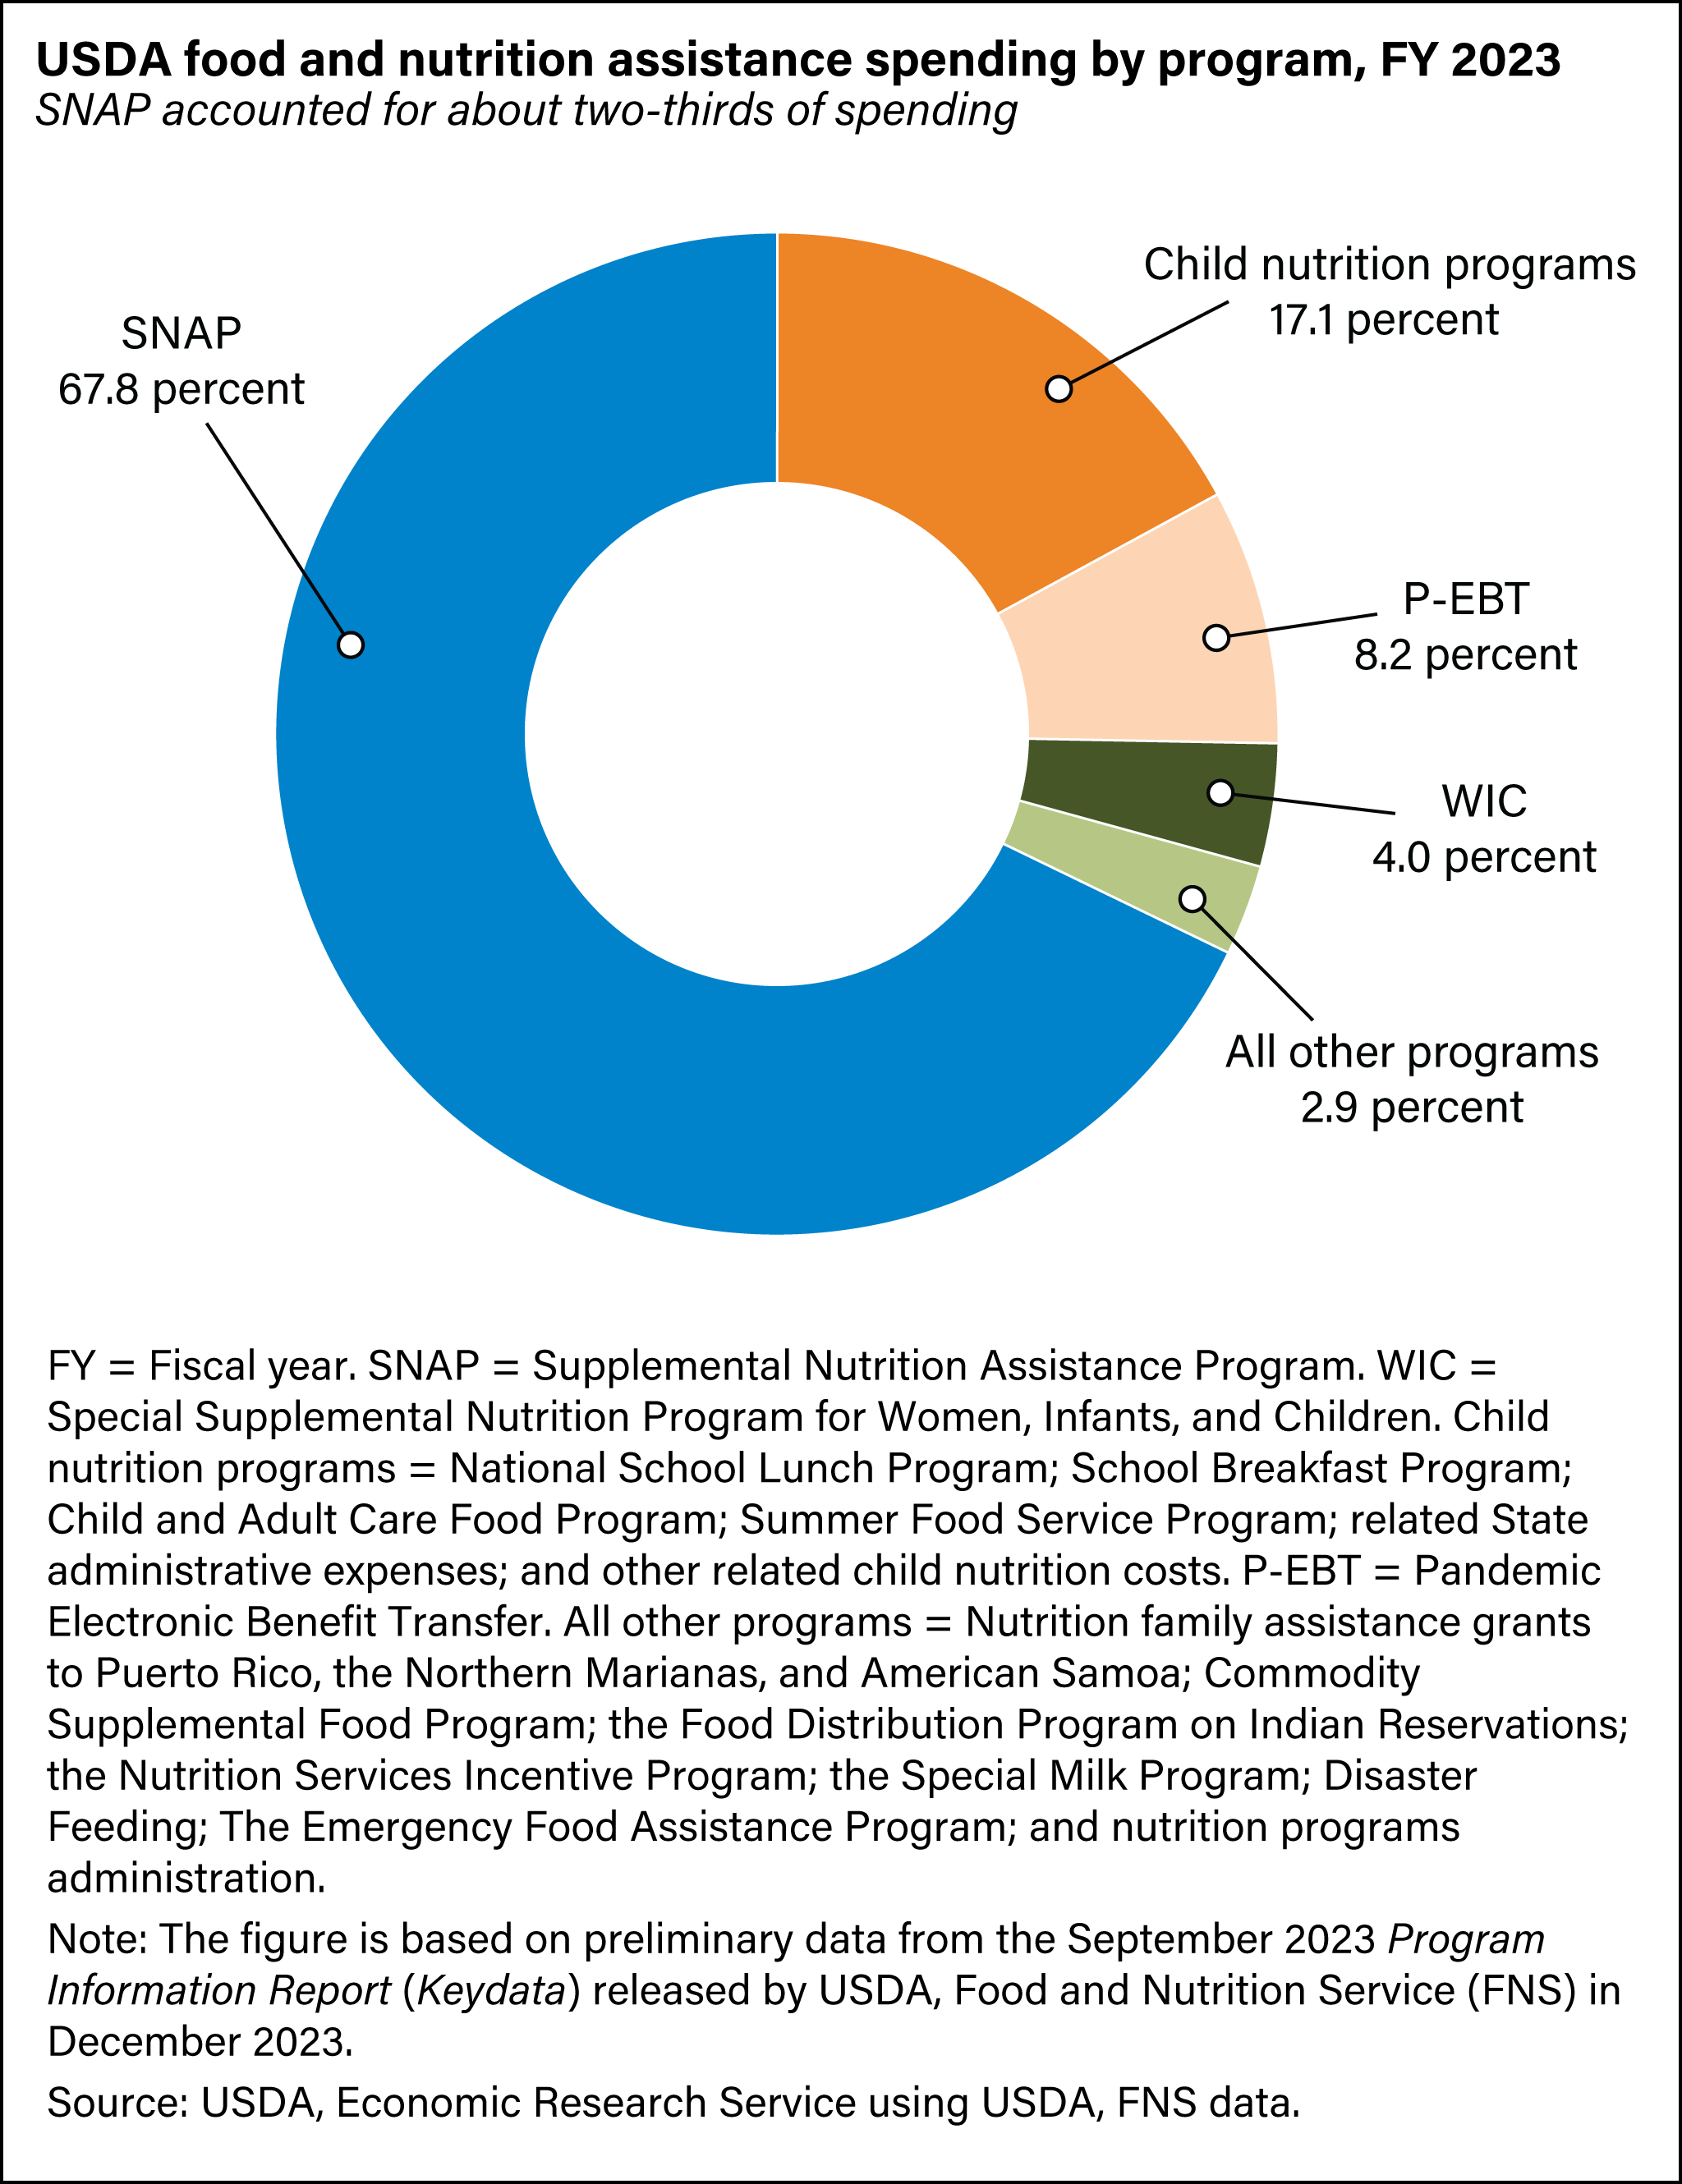
The Supplemental Nutrition Assistance Program (SNAP) is the Nation's largest nutrition assistance program, accounting for about 68 percent of USDA nutrition assistance spending in fiscal year (FY) 2023.
Download chart data in Excel format.
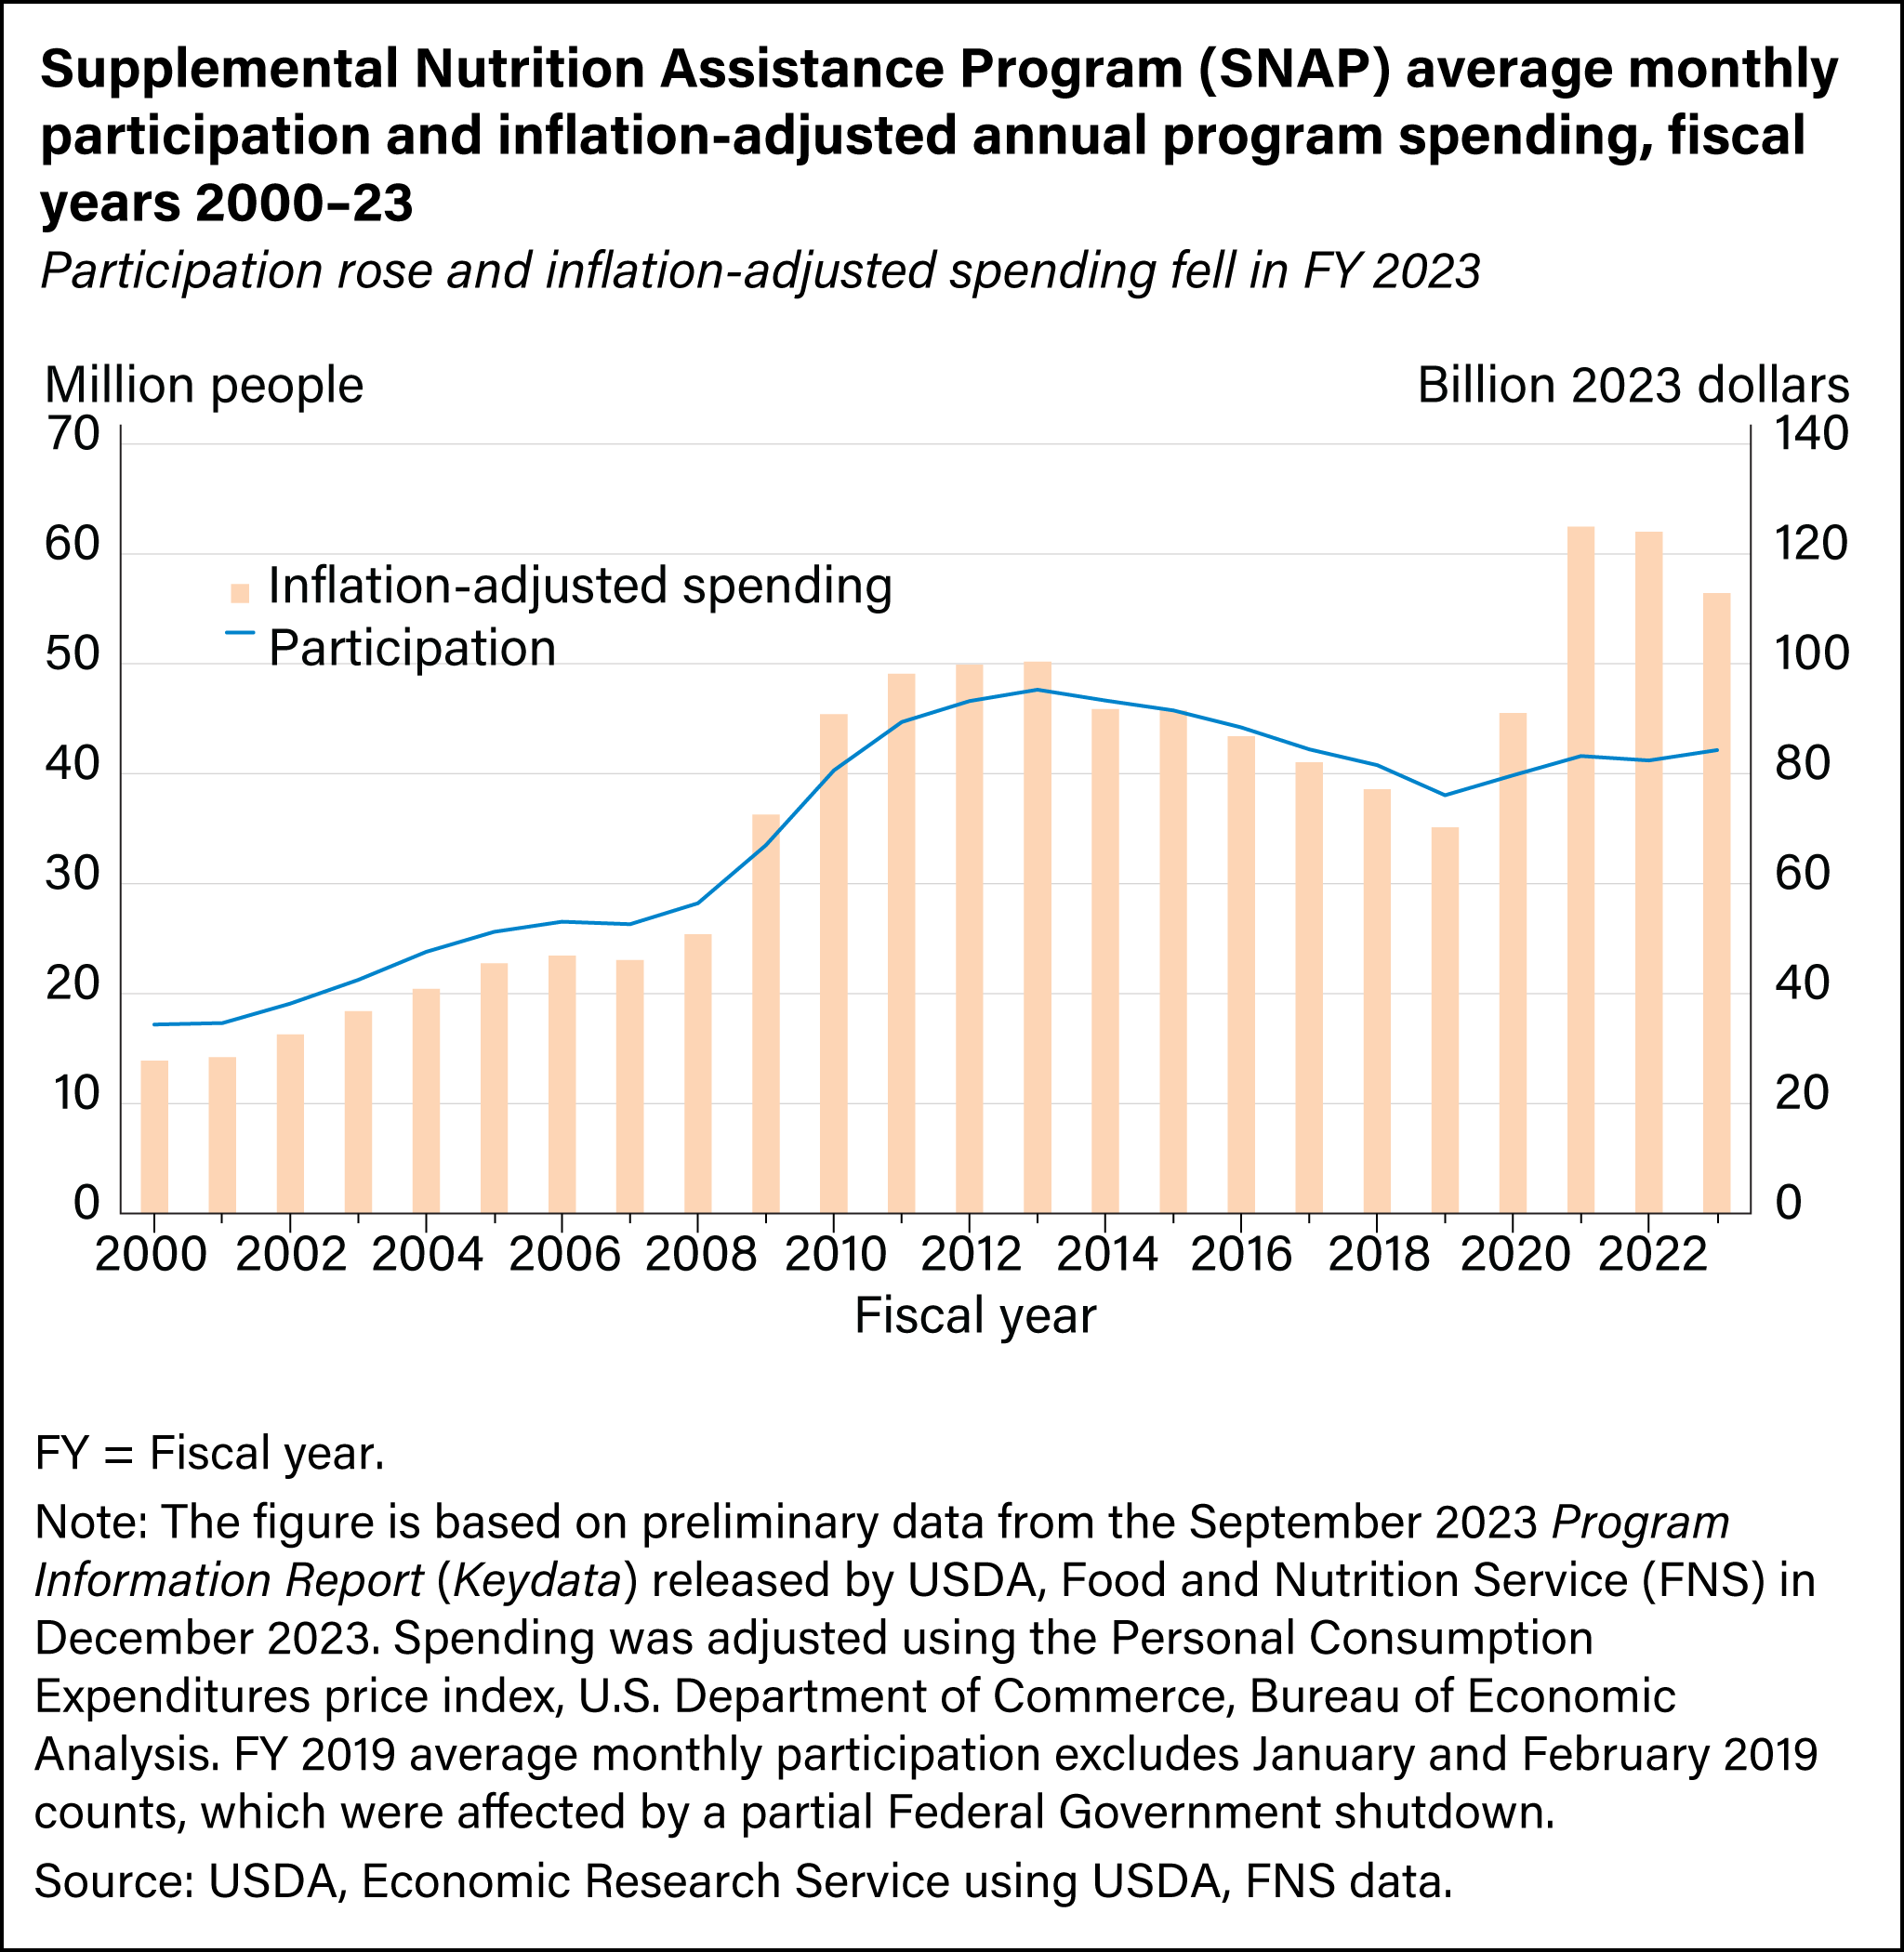
In FY 2023, SNAP served an average of 42.1 million participants per month. Federal SNAP spending totaled $112.8 billion and benefits averaged $211.93 per participant per month.
Download chart data in Excel format.
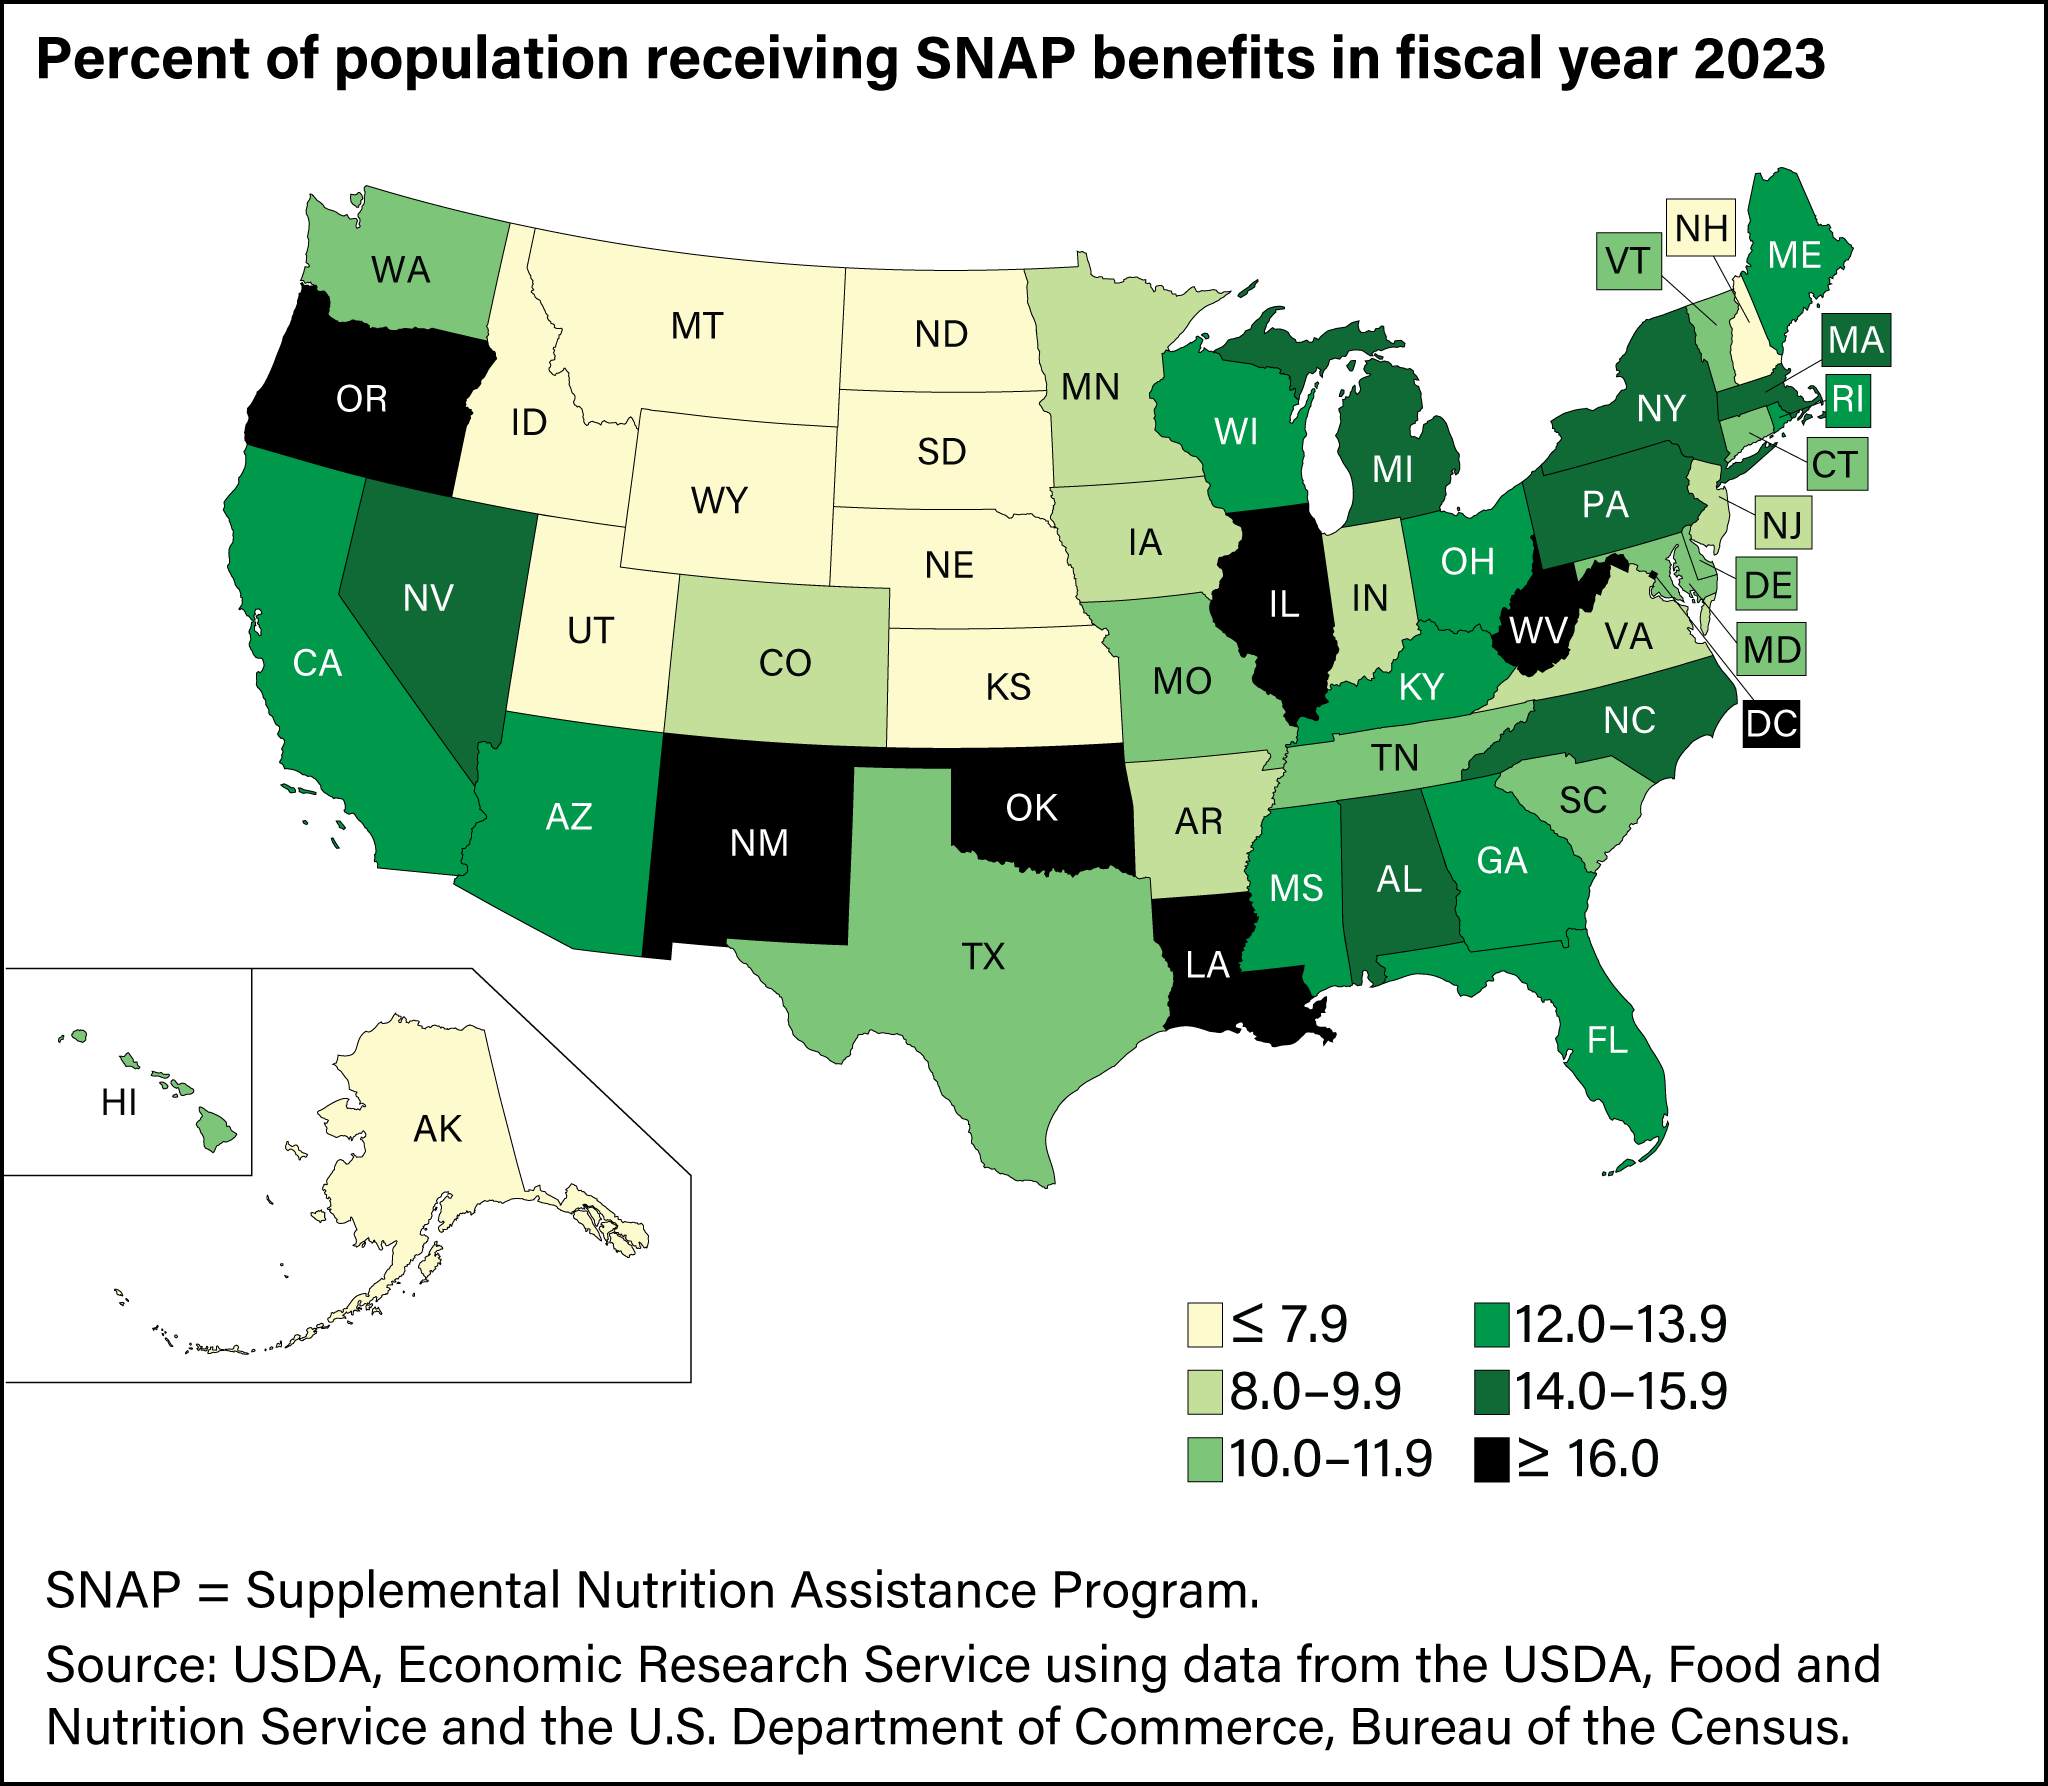
The share of U.S. residents who received SNAP benefits in FY 2023 was 12.6 percent. The percent of residents who received SNAP benefits varied by State, ranging as high as 23.1 percent to as low as 4.6 percent.
Download chart data in Excel format.
SNAP benefits are available to low-income households meeting income and other eligibility criteria. Unlike the Special Supplemental Nutrition Program for Women, Infants, and Children (WIC) or child nutrition programs, SNAP is not targeted to specific subgroups. SNAP households are diverse. In FY 2022, 26 percent of SNAP households had earned income; among households with children, 50 percent had earned income. In addition, 62 percent of households received unearned income from one or more sources (e.g., Social Security, Supplemental Security Income, Temporary Assistance for Needy Families, and/or State General Assistance); and 21 percent received no income from earned or unearned sources. Lastly, 37 percent of households received the maximum benefit for their size, whereas 10 percent received the minimum benefit.
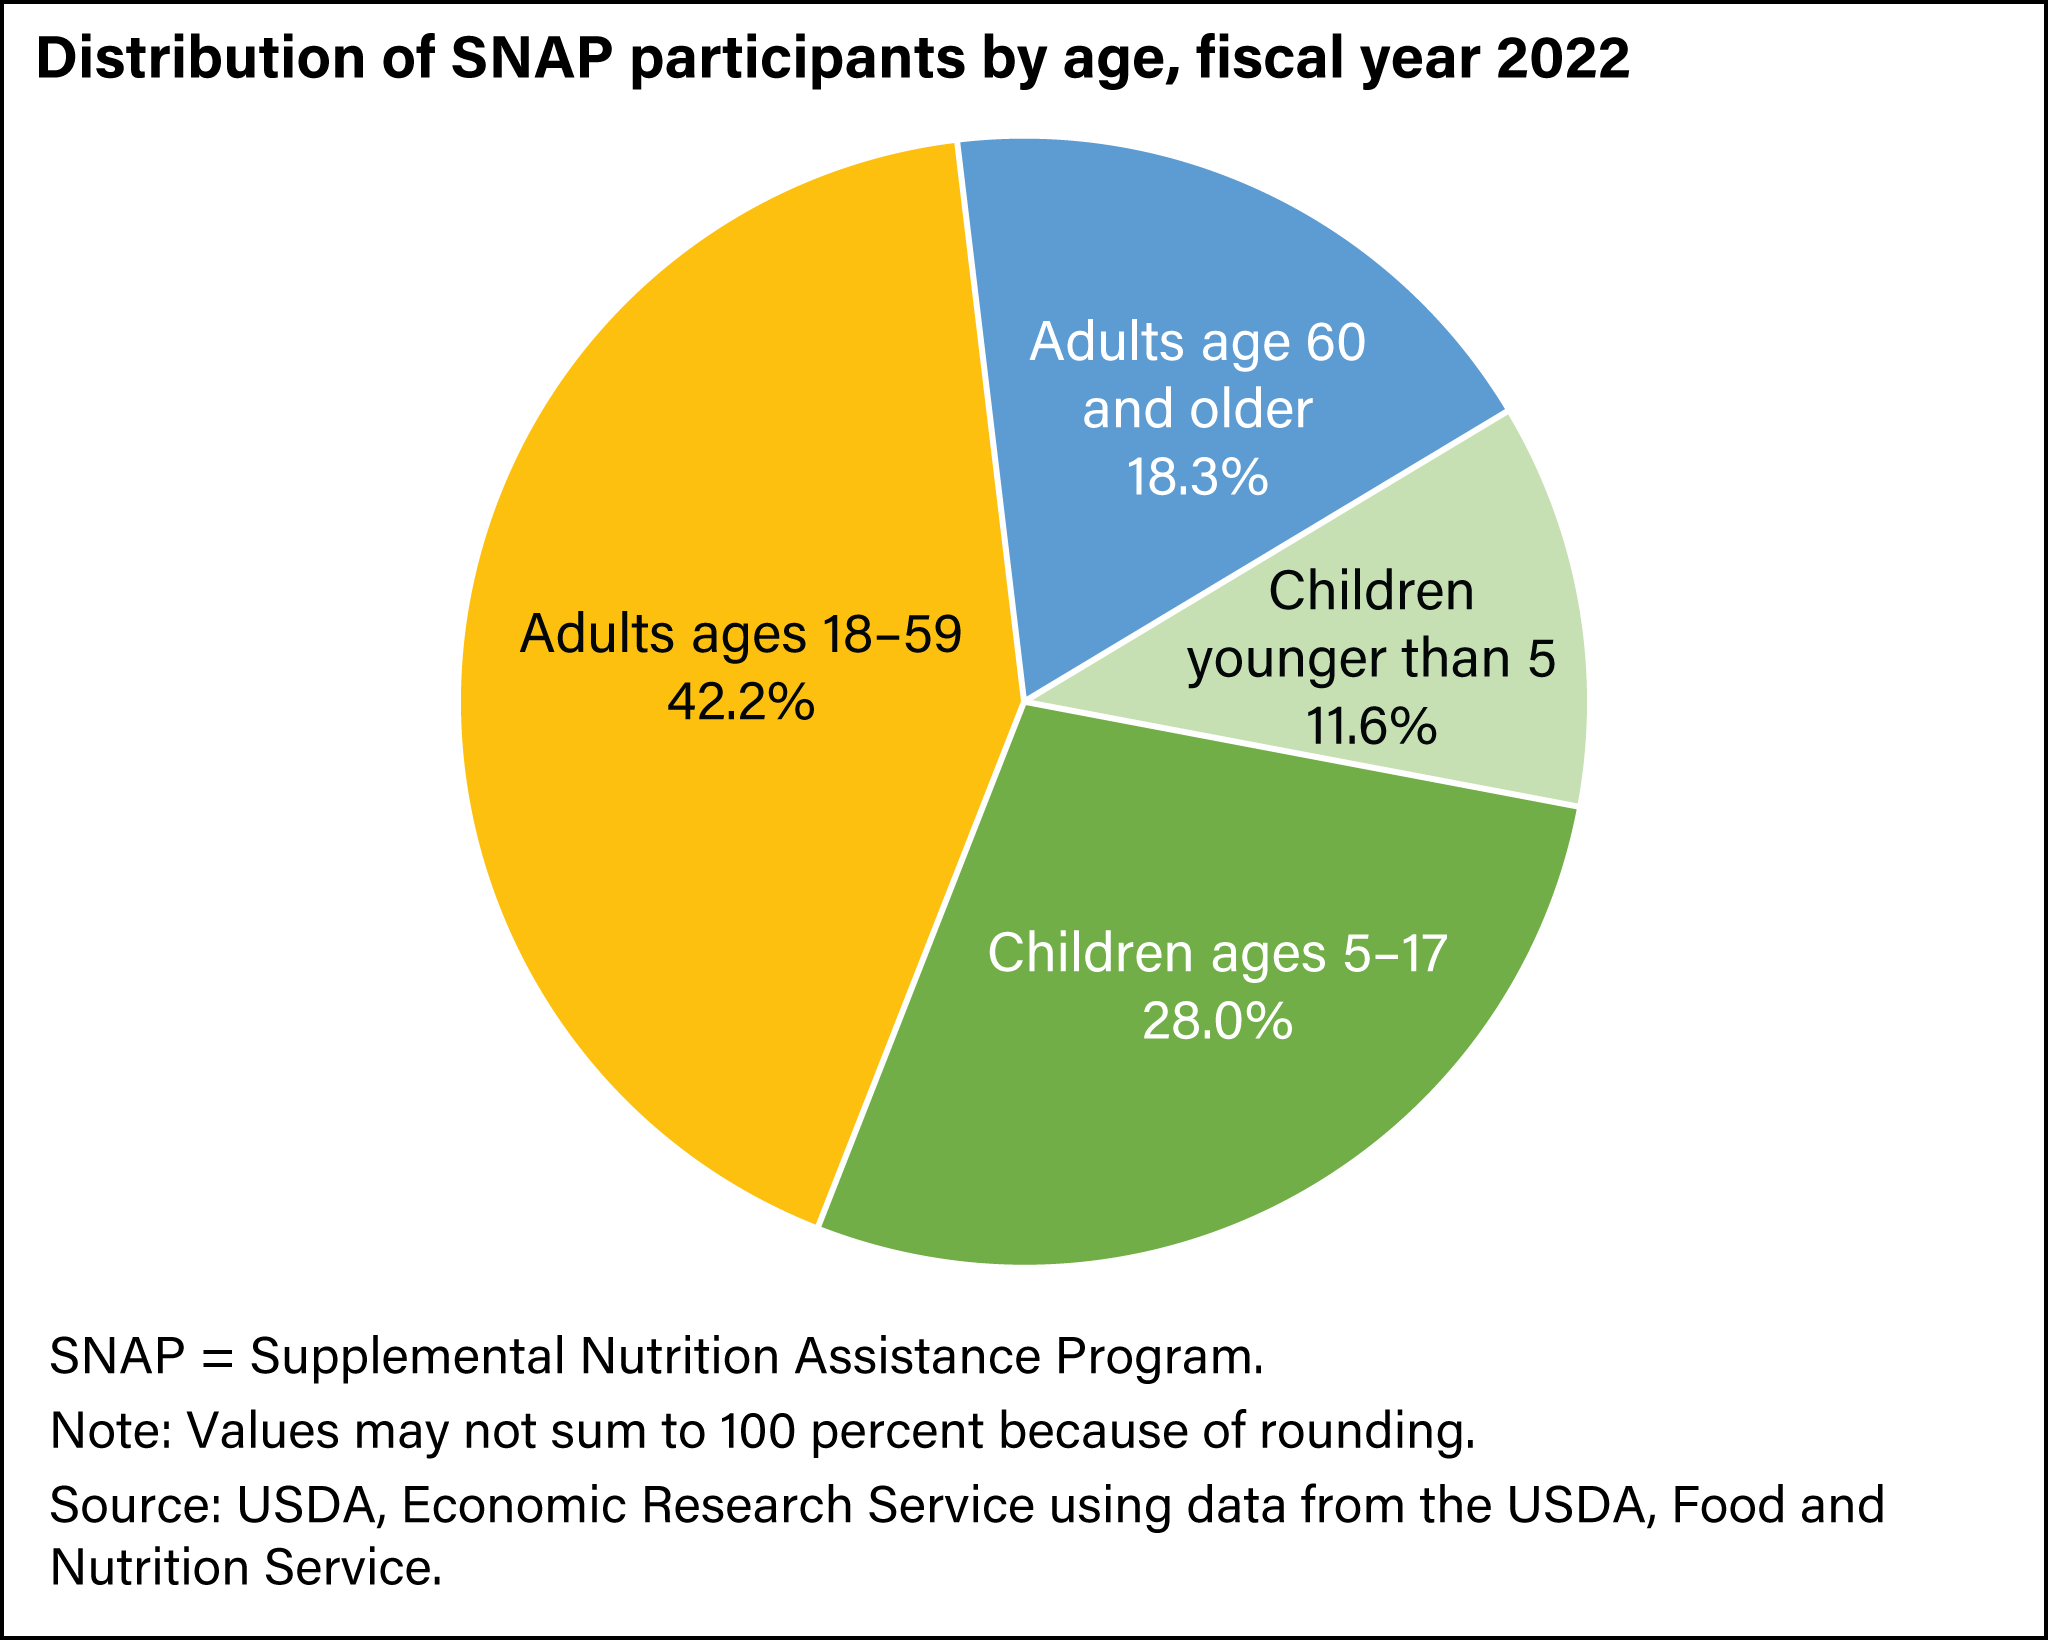
In FY 2022, adults aged 18–59 made up the largest share of SNAP participants (42 percent), followed by children (about 40 percent) and seniors aged 60 and older (18 percent).
Download chart data in Excel format.
More information on annual SNAP participation, spending, and program developments can be found in USDA, ERS’ Food and Nutrition Assistance Landscape report series. For a recent edition, see:
More information on the characteristics of SNAP participants and households can be found in USDA, Food and Nutrition Service’s Characteristics of SNAP Households report series. For a recent edition, see:
Participation Outcomes
USDA, Economic Research Service (ERS) research investigates how SNAP benefit receipt impacts households along various dimensions.
Food security, defined as households’ access to enough food for their members to have active, healthy lives, is a leading indicator of well-being among vulnerable households. USDA, ERS studies have found that SNAP improves household food security in several ways. Household food security deteriorates leading up to the date of SNAP receipt and improves afterward. Past SNAP benefit increases reduced food insecurity among low-income households; subsequent benefit decreases reduced food spending and led to higher rates of food insecurity and very low food security. Research employing instrumental variables methods has found that SNAP receipt reduces the likelihood of being food insecure or very food insecure.
- Does SNAP Decrease Food Insecurity? Untangling the Self-Selection Effect
- Food Security Improved Following the 2009 ARRA Increase in SNAP Benefits
- Effects of the Decline in the Real Value of SNAP Benefits From 2009 to 2011
- How Much Does Snap Reduce Food Insecurity?
USDA, ERS research also has found that SNAP alleviates poverty. SNAP benefits reduced the depth and severity of poverty experienced by recipient households, especially among children, who experience higher poverty rates than the population at large.
USDA, ERS studies have investigated the links between SNAP receipt, diet, and nutrition. Evidence is inconclusive as to whether SNAP participation is beneficial or adverse regarding diet quality. For most participants, SNAP receipt does not increase the likelihood of being overweight or obese.
- Supplemental Nutrition Assistance Program (SNAP) Participation Leads to Modest Changes in Diet Quality
- Food Stamps and Obesity: What Do We Know?
USDA, ERS research has found that SNAP households spend less on average on food and spend relatively more on food-at-home compared with nonparticipating households. SNAP benefits account for more than two-thirds of food spending among households with income below the poverty live. Past benefit increases led SNAP households to increase spending on both food and nonfood goods.
- The Stimulus Act of 2009 and Its Effect on Food-At-Home Spending by SNAP Participants
- The Food-Spending Patterns of Households Participating in the Supplemental Nutrition Assistance Program: Findings From USDA's FoodAPS
Economic Linkages
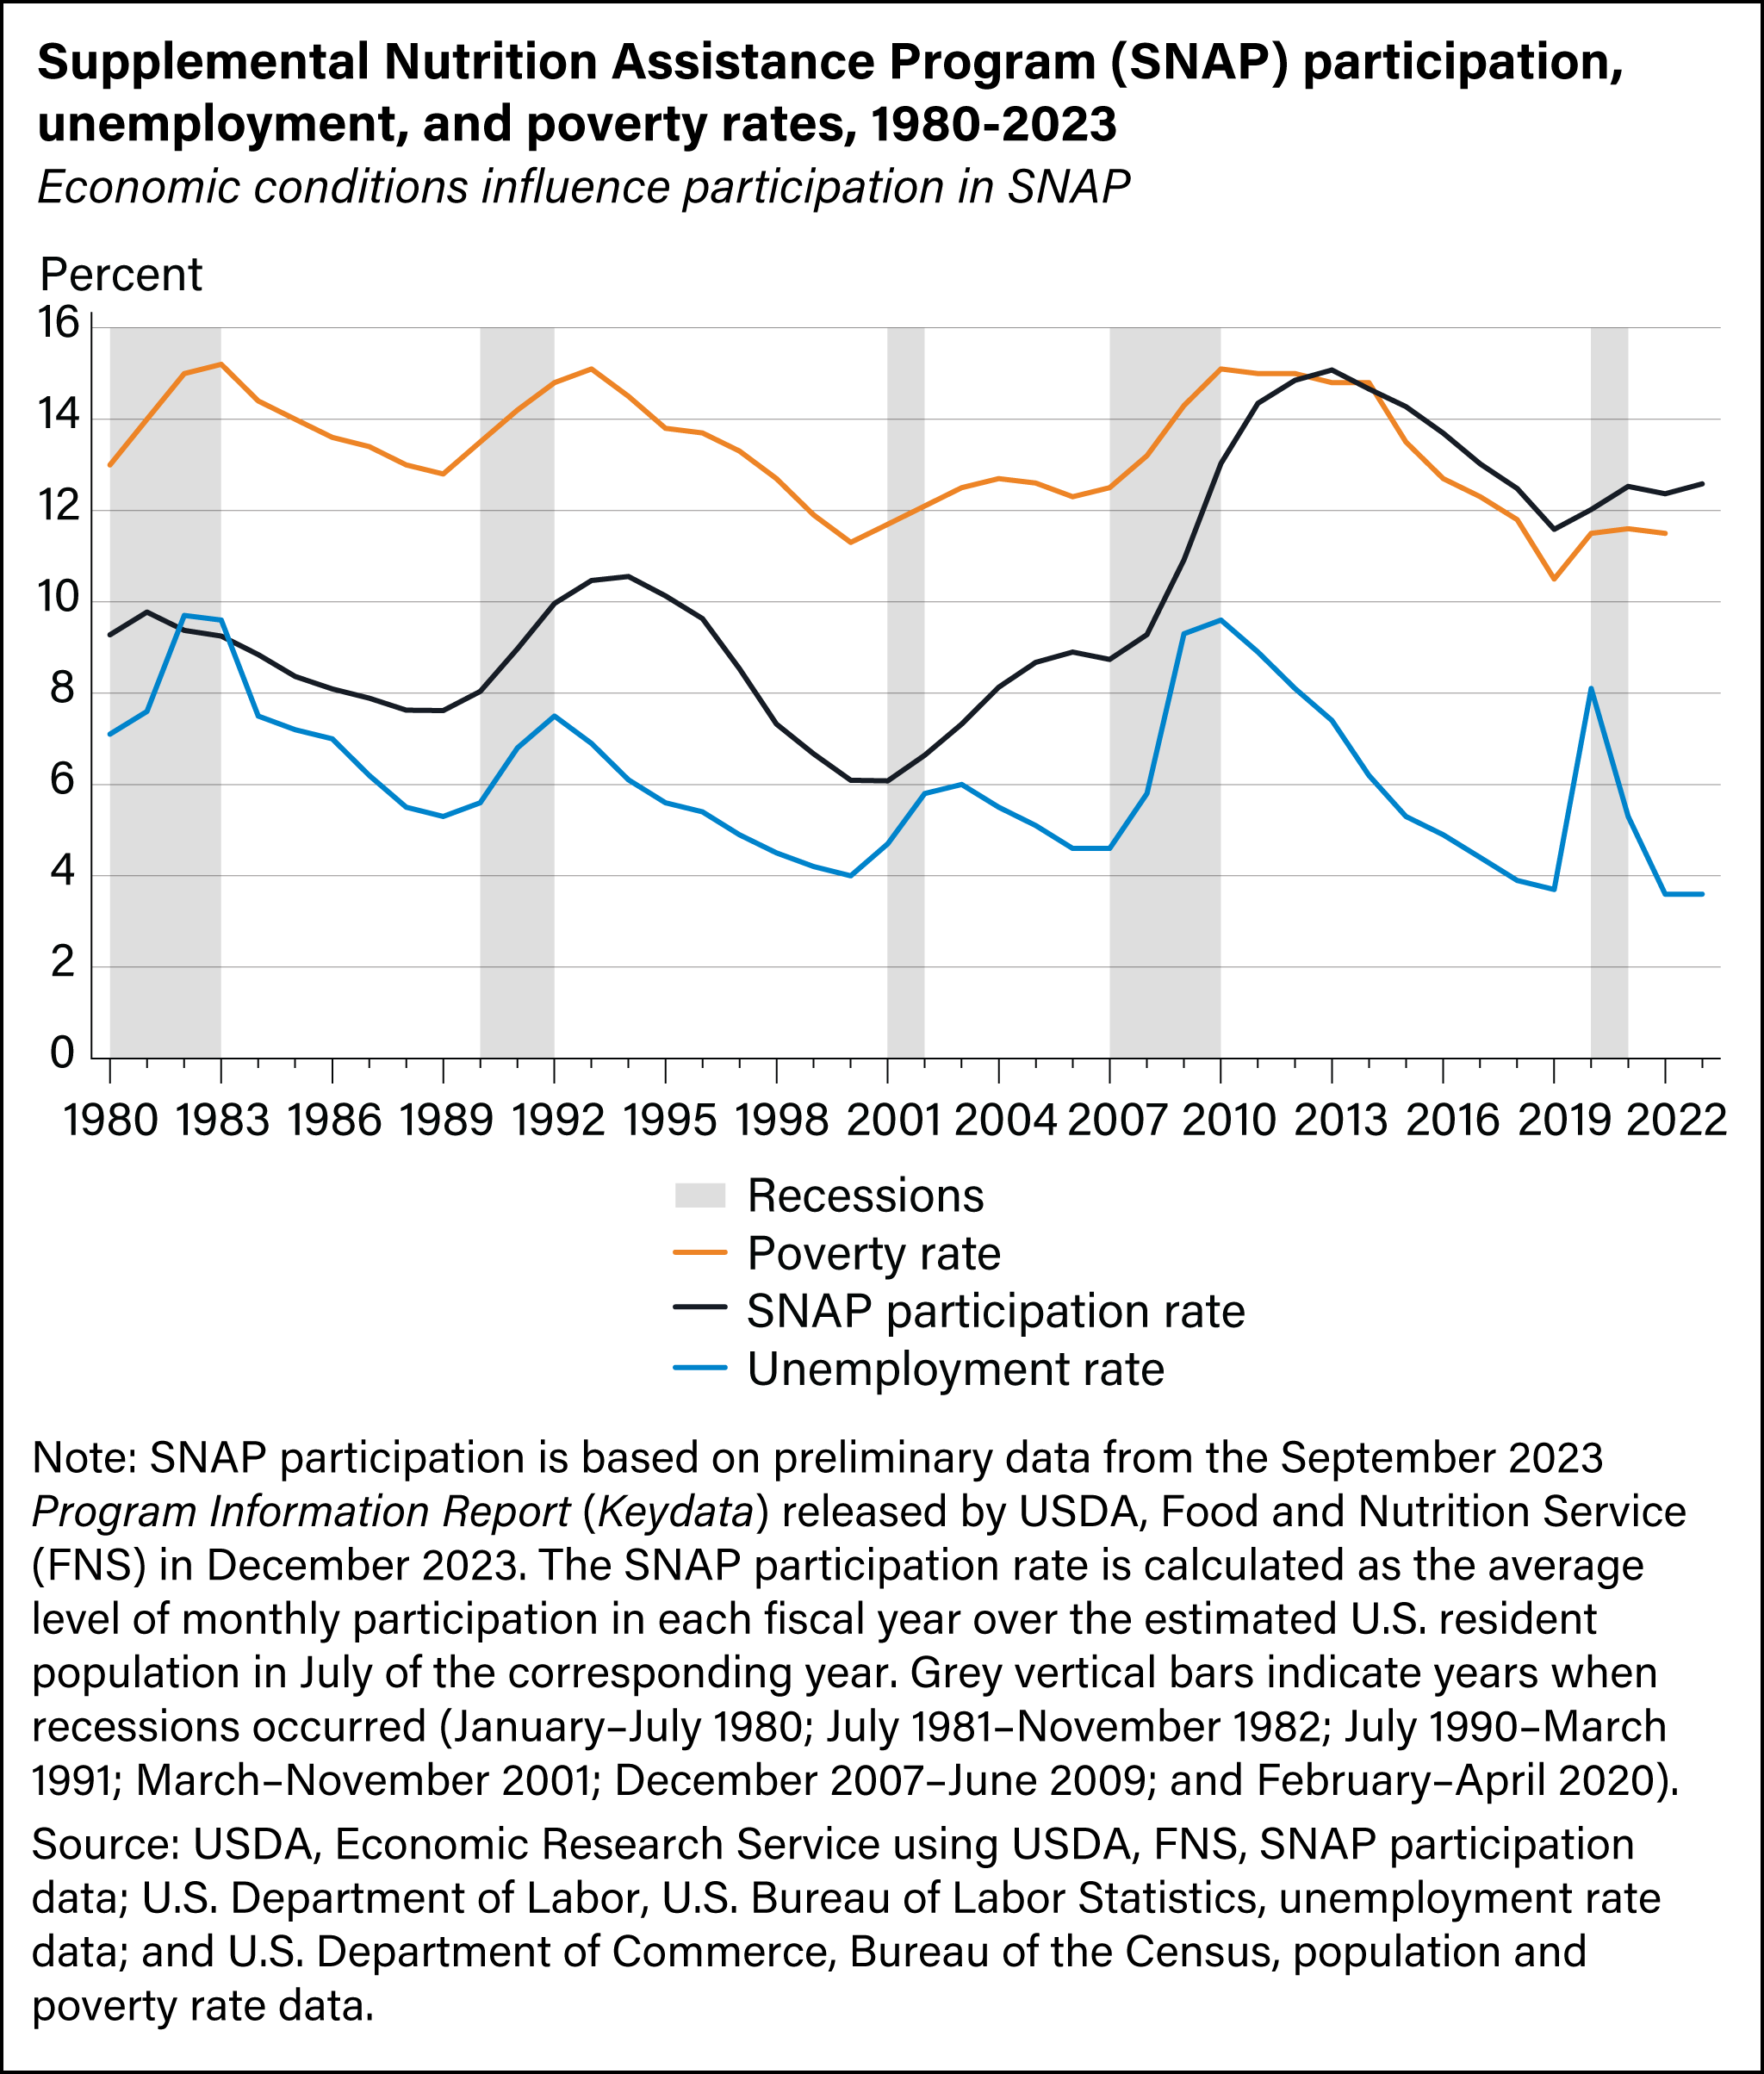
SNAP is one of the Nation’s primary countercyclical Government assistance programs. Because SNAP is an entitlement program and benefits are means-tested, it provides assistance to more low-income households during an economic downturn or recession and fewer households during an economic expansion, serving as an automatic stabilizer to the economy. Historically, SNAP spending and the participation rate tend to track the unemployment rate and poverty rate.
Download chart data in Excel format.
USDA, ERS research investigates how economic downturns contribute to SNAP participation, as well as the role of policy changes and other factors in this relationship. A 1-percentage point increase in the unemployment rate is associated with an additional 2 million–3 million additional SNAP participants. Changes in program policy and administrative practices tend to augment the rise in SNAP participation during economic downturns and contribute to the continued rise in participation during the early stages of economic recovery.
The rise in SNAP participation and benefit sizes during an economic downturn result in greater SNAP spending which, in turn, stimulates the economy. During a recession, some households that lose part or all of their income become eligible and participate in SNAP. For households that were already participating before a recession, SNAP benefits increase if their income falls. SNAP benefits support households’ food spending and nonfood spending (by freeing up money that households would otherwise need to spend on food). This, in turn, augments the income and spending of producers, processors, distributors, retailers, and their employees. Thus, SNAP benefits start a multiplier process that supports macroeconomic spending and production. SNAP participation and benefits can automatically expand when the economy weakens and contract when it strengthens.
USDA, ERS research has estimated a multiplier of SNAP benefits on U.S. Gross Domestic Product (GDP) of 1.54 during a slowing economy. This means an increase of $1 billion in SNAP benefits increases the GDP by $1.54 billion. Additionally, the same increase supports 13,560 additional jobs. From 2009–14, SNAP benefit outlays increased rural industry output and urban output by 1.25 percent and 0.53 percent, respectively; outlays also increased rural and urban employment and household incomes, with relatively larger increases for rural areas.
- The Supplemental Nutrition Assistance Program (SNAP) and the Economy: New Estimates of the SNAP Multiplier
- Impact of USDA's Supplemental Nutrition Assistance Program (SNAP) on Rural and Urban Economies in the Aftermath of the Great Recession
Note: USDA, ERS is a Federal statistical agency that conducts research and analysis and produces data on agriculture, food, the environment, and rural America. USDA, ERS does not process SNAP applications. If you are looking for information about eligibility for SNAP benefits, applying for benefits, or your personal SNAP case, please contact your local SNAP office.