



The Economic Research Service (ERS) conducts research on foodservice outlets—facilities that serve meals and snacks for immediate consumption onsite (also referred to as food away from home (FAFH)). ERS examines the size of this growing market and its major market segments, including limited-service and full-service outlets.
A Large and Growing Market
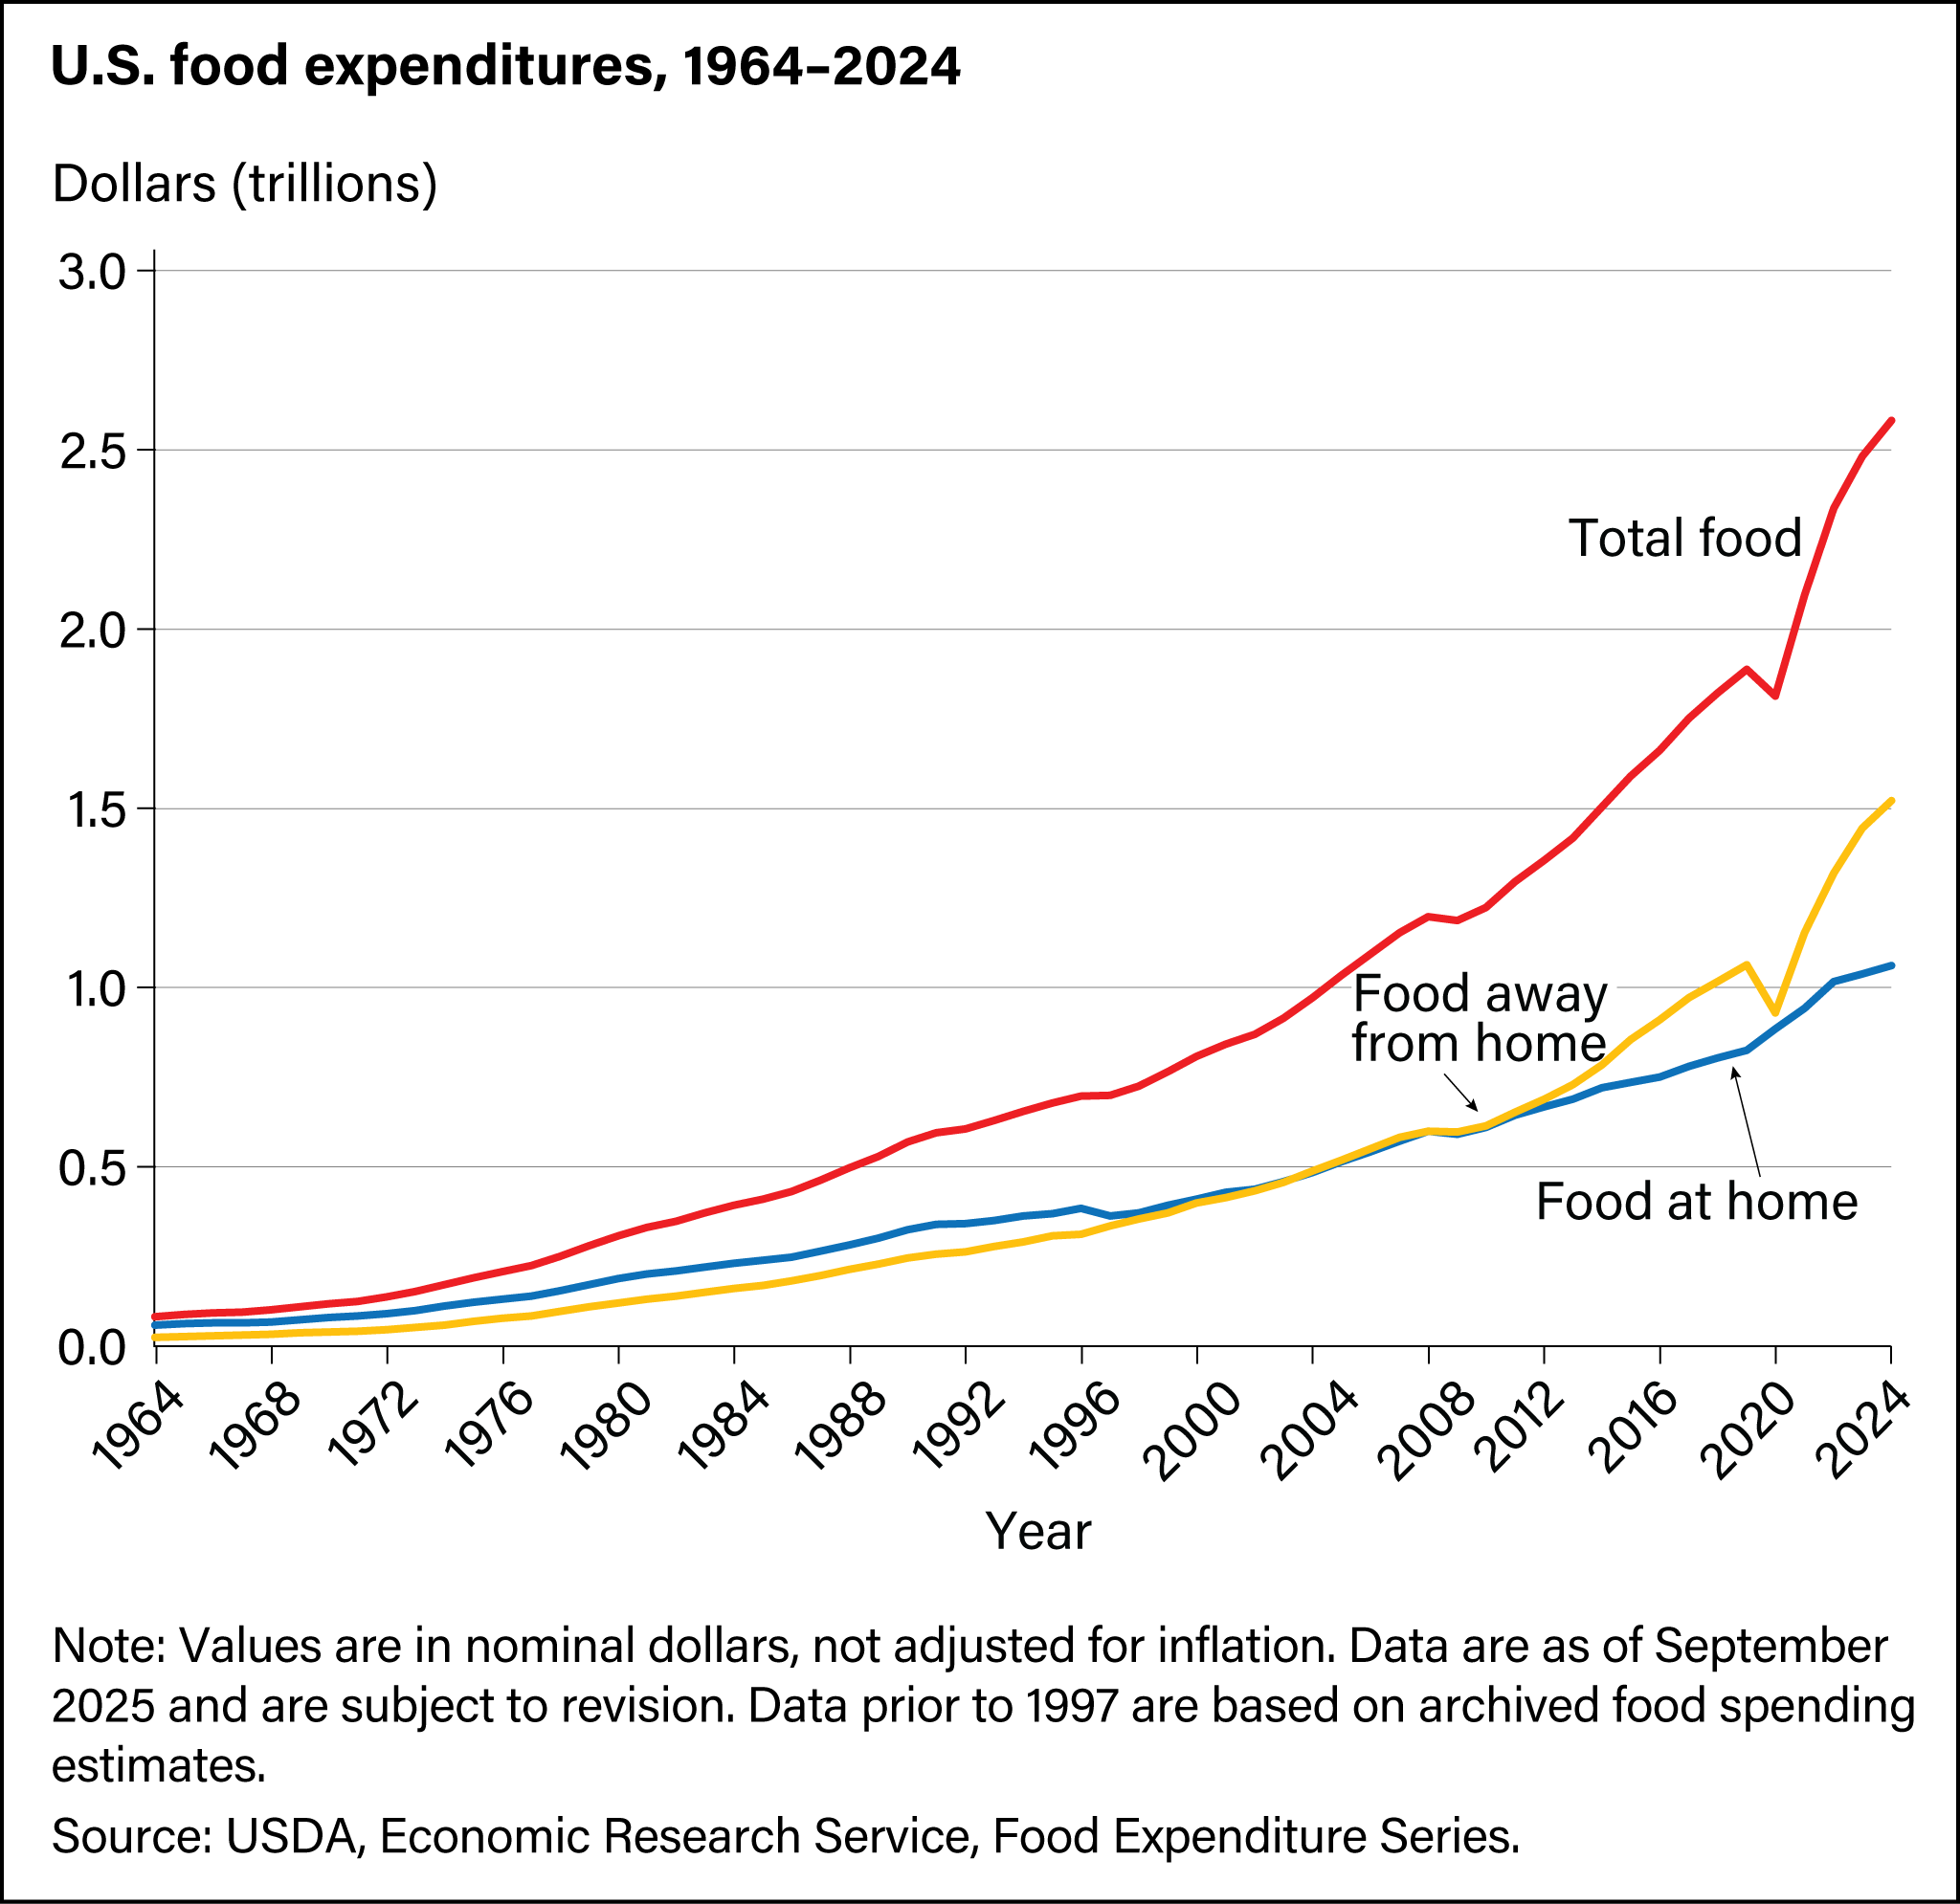
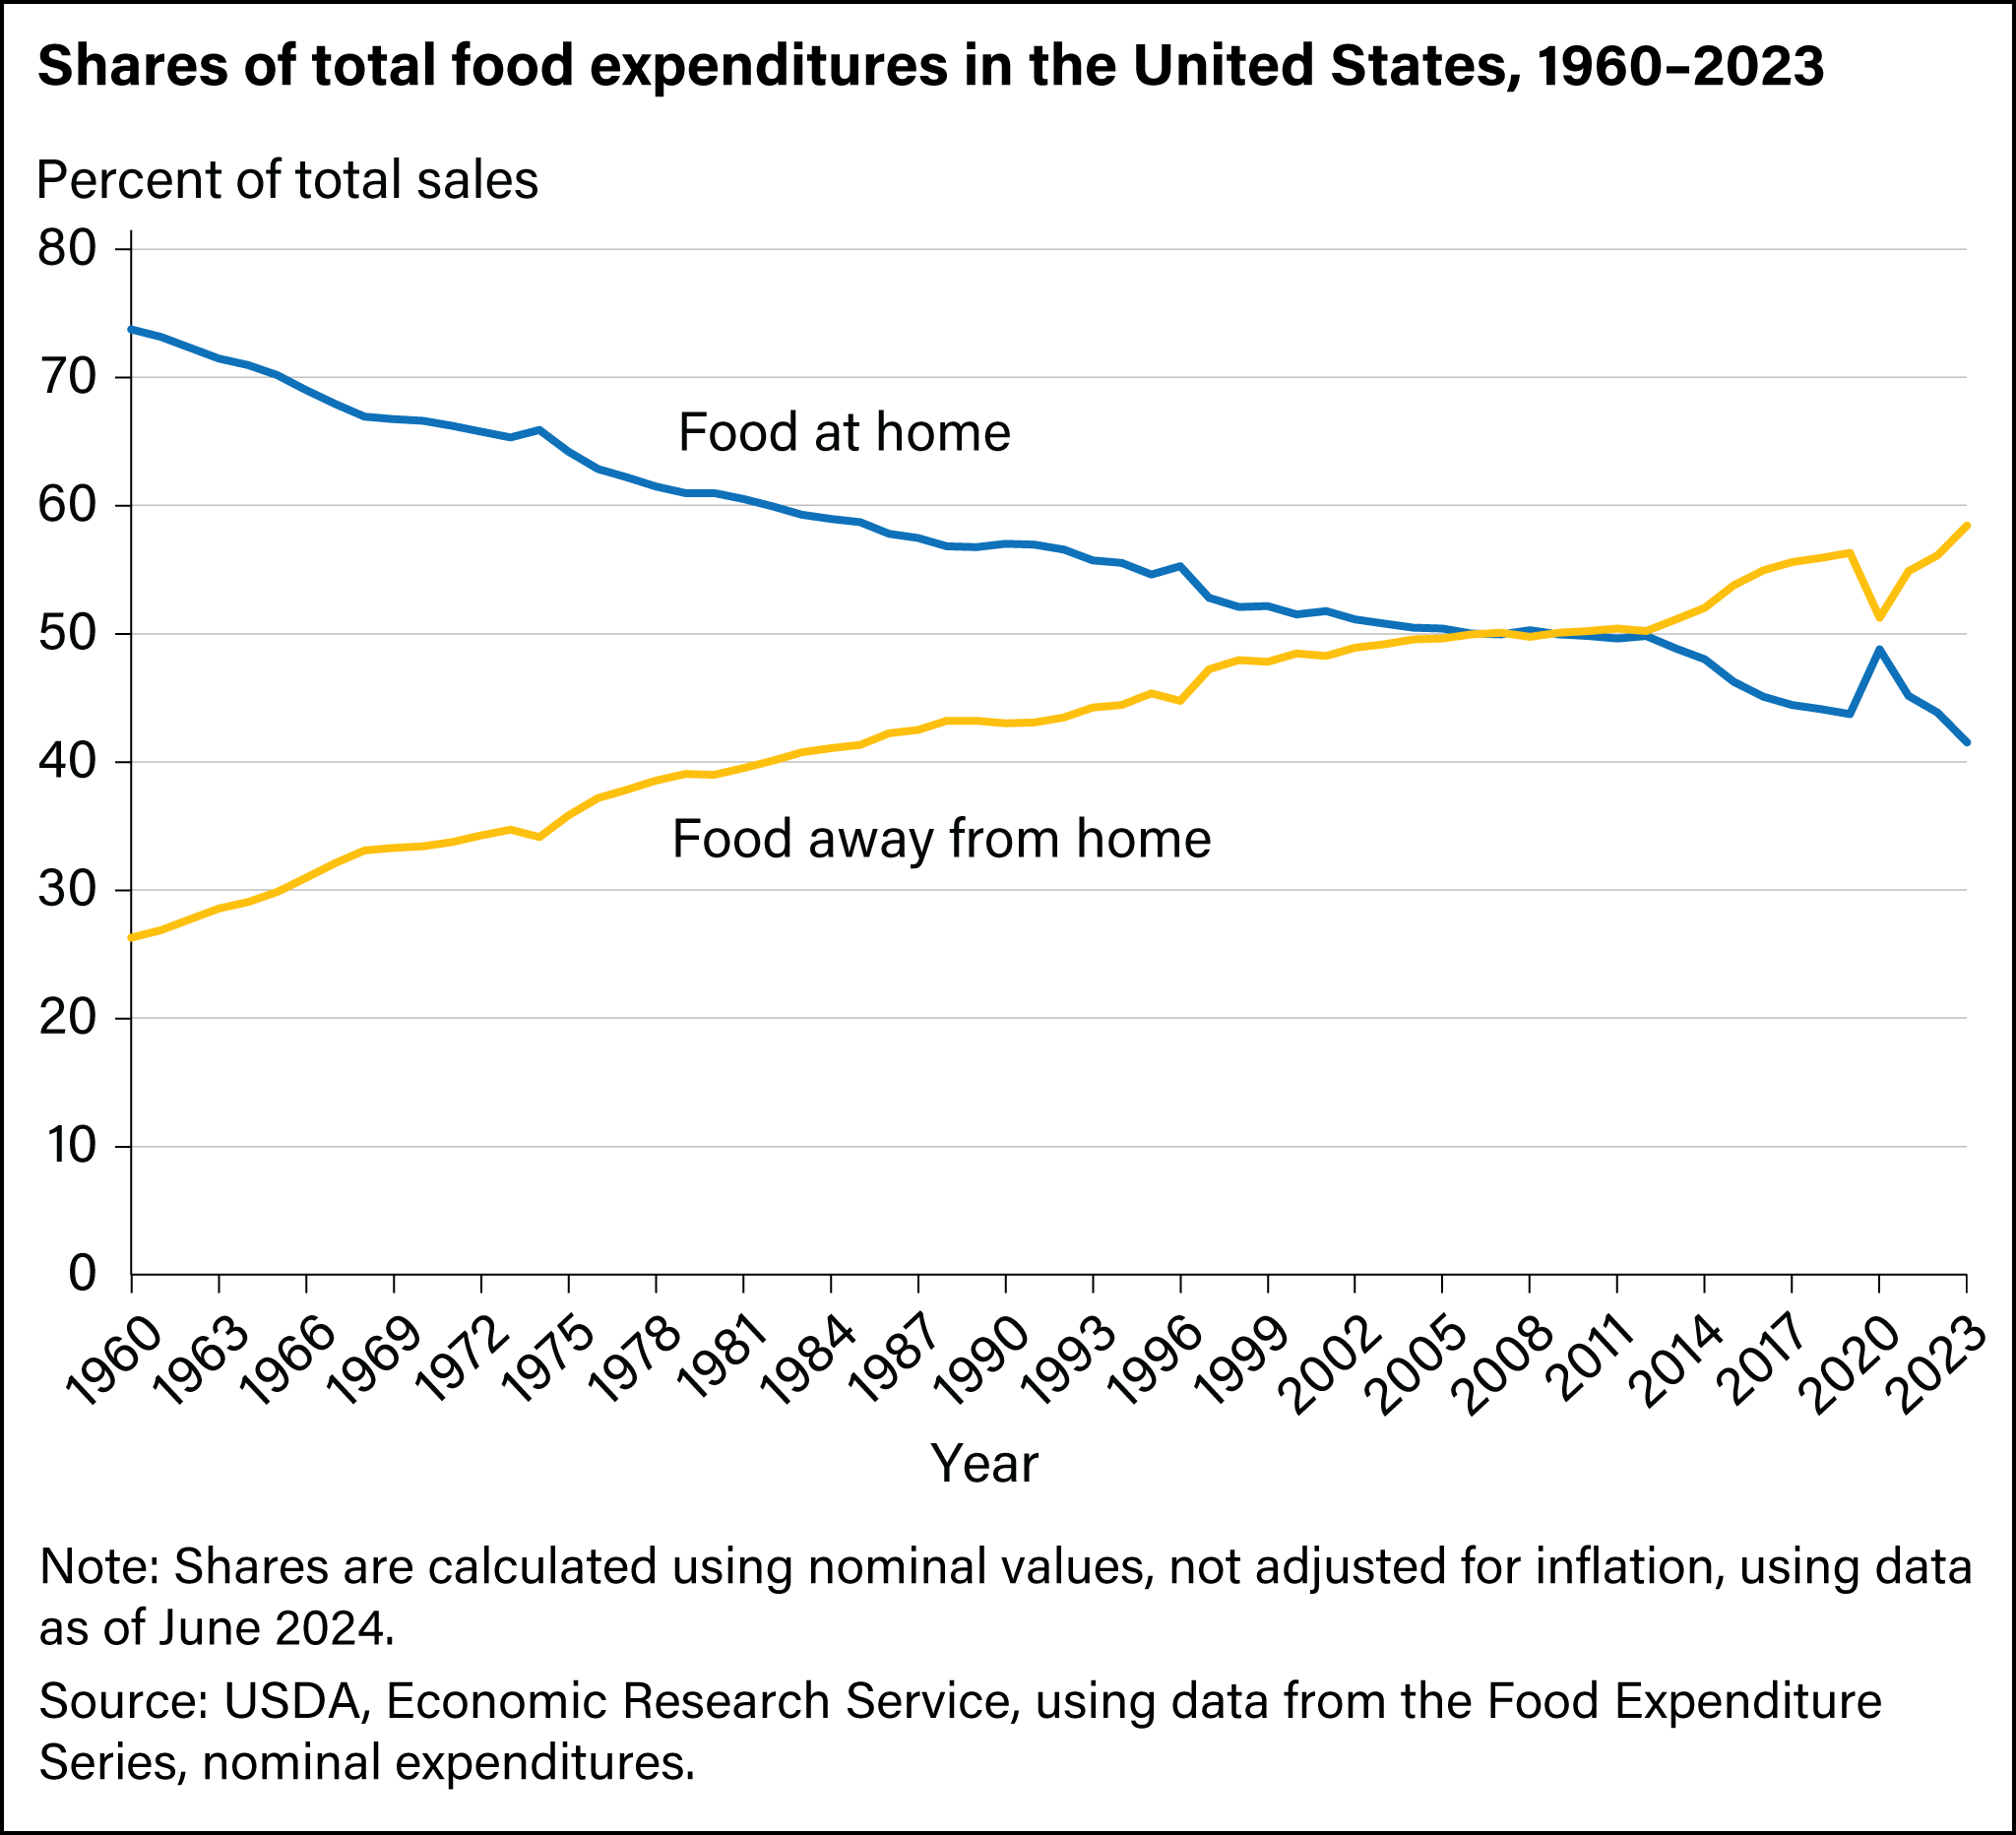
Spending at foodservice outlets (FAFH) has outpaced spending at food retailing outlets (also referred to as food at home (FAH)) since 2004:
- In 2019, total food sales at foodservice and food retailing outlets were approximately $1.89 trillion.
- Foodservice facilities contributed $1.06 trillion of this total, with full-service and limited-service establishments each accounting for about $360 million.
However, in 2020, spending at foodservice outlets had the sharpest decline in history. This decline is partly due to the Coronavirus (COVID-19) pandemic, mobility restrictions affecting FAFH establishments, and the subsequent recession:
- In 2020, total food sales at foodservice and food retailing outlets were approximately $1.81 trillion.
- Food sales at foodservice outlets were $928.9 billion, with full-service establishments supplying $274.6 billion and limited-service establishments supplying $351.0 billion.
Spending in the foodservice and food retailing industries has surpassed prepandemic levels since 2021:
- Total food sales at foodservice and food retailing outlets were more than $2.00 trillion each year since 2021, reaching $2.58 trillion in 2024.
- Food sales at foodservice outlets were $1.52 trillion in 2024, with full-service establishments supplying $552.7 billion and limited-service establishments supplying $550.7 billion.
Download chart data in Excel file
In 2024, the share of total food expenditures on FAH was 41.1 percent and 58.9 percent was spent on FAFH—a new record high for the FAFH share.
Download chart data in Excel format
Food-Away-from-Home Industry by Outlet Type
Commercial foodservice establishments account for the bulk of food-away-from-home (FAFH) spending. This category includes full-service restaurants, limited-service outlets, caterers, cafeterias, and other places that prepare, serve, and sell food to the general public for a profit. Some establishments are located within facilities that are not primarily engaged in dispensing meals and snacks, such as lodging places, recreational facilities, and retail stores. Schools and nursing homes are types of non-commercial foodservice establishments, often referred to as "institutional" foodservice facilities.
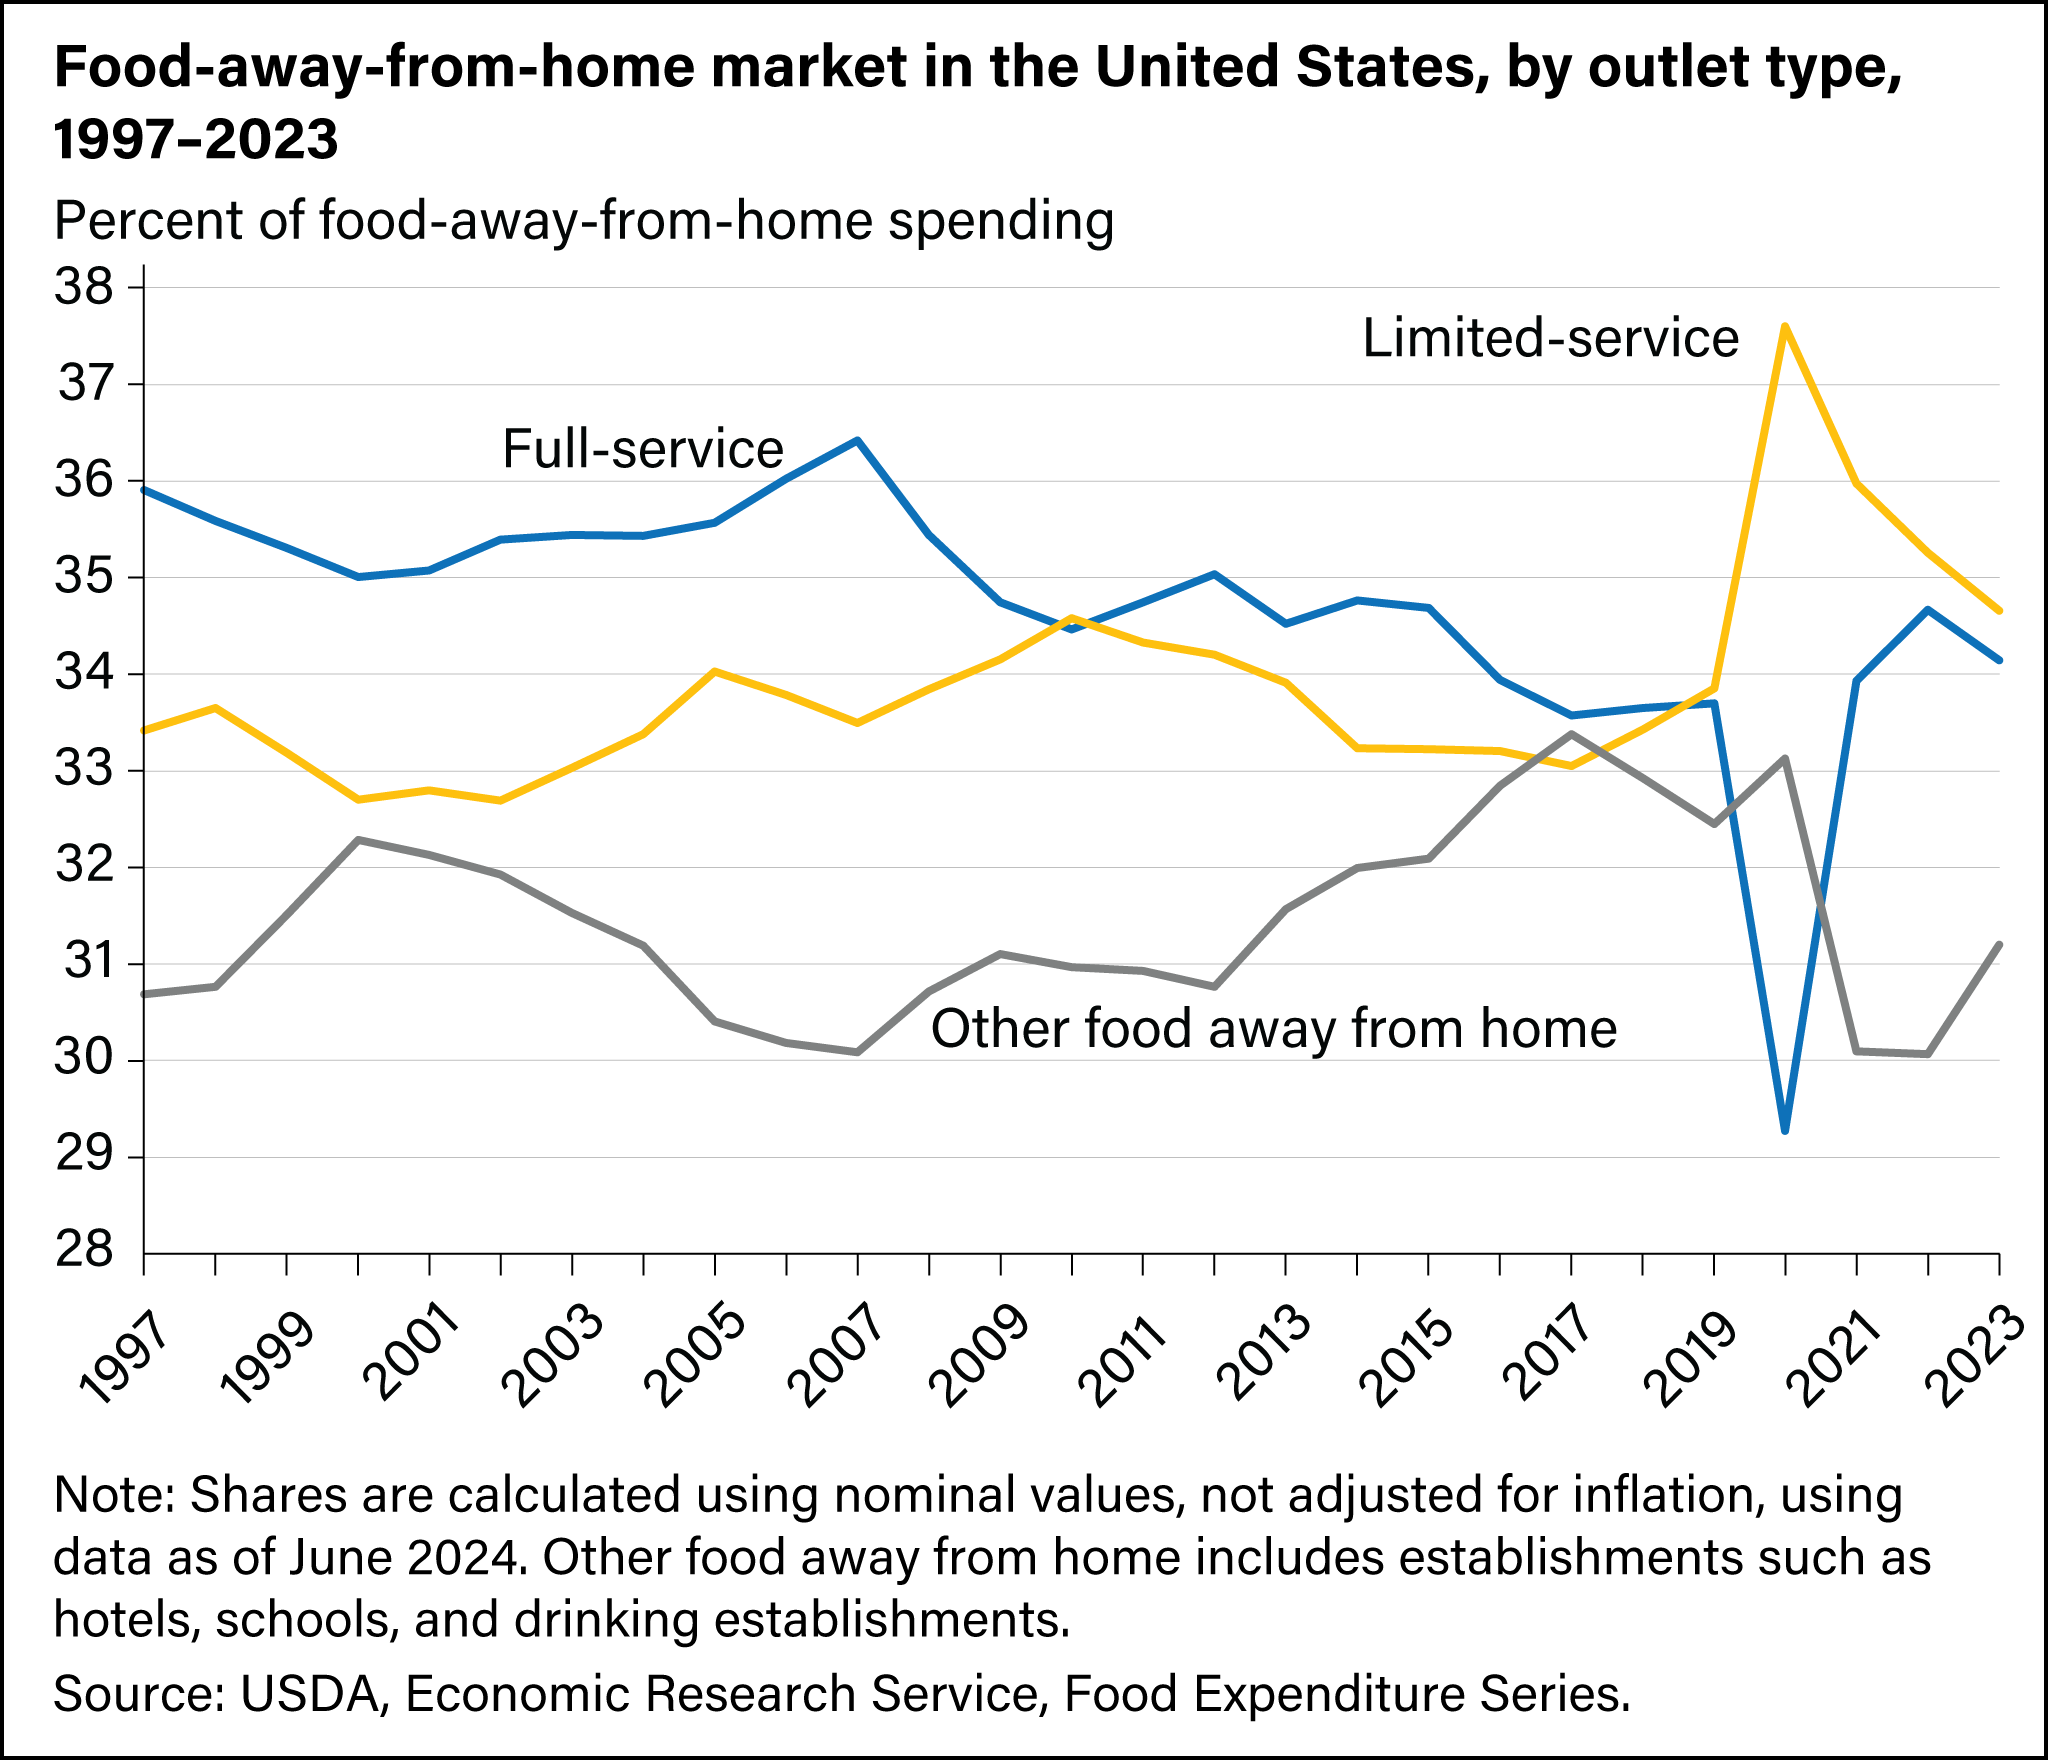
Full-service and limited-service restaurants, the two largest segments of the commercial foodservice market, accounted for 72.6 percent of all FAFH spending in 2024. At full-service establishments, customers typically order, are served while seated, and pay after eating. In contrast, limited-service outlets use convenience as a selling point; customers generally order and pay before eating and meals may be consumed on premises, taken out, or delivered to a specific location. Other FAFH outlets include hotels, schools, and drinking establishments, among others.
- In 2020, food spending decreased at both full-service and limited-service restaurants, as well as other FAFH outlets. Full-service restaurants experienced the sharpest decline in spending as a share of the FAFH market.
- In 2024, spending at limited-service restaurants and at full-service restaurants represented 36.3 percent and 36.4 percent of the FAFH market, respectively, while spending at other FAFH establishments represented 27.4 percent of the FAFH market.
As part of their growth strategy, limited-service restaurant companies have built more outlets closer to consumers' homes and workplaces, enhancing convenience for purchasing meals and snacks. Many of these companies have opened outlets in nontraditional locations, such as department stores. Besides convenience, a household's demand for FAFH is affected by its income and demographic characteristics, as seen in the ERS report:
The Demand for Food Away from Home: Full-Service or Fast Food?
Any shift in the market share between limited-service and full-service restaurants could influence the mix of foods and services offered by both types of establishments. For example, if trends favor full-service restaurants, the market could shift to more full-service restaurants offering a wider range of menu selections and dining amenities. In response, limited-service outlets might introduce comparable foods and services.
Download chart data in Excel format
Food-Away-From-Home Demand is Seasonal
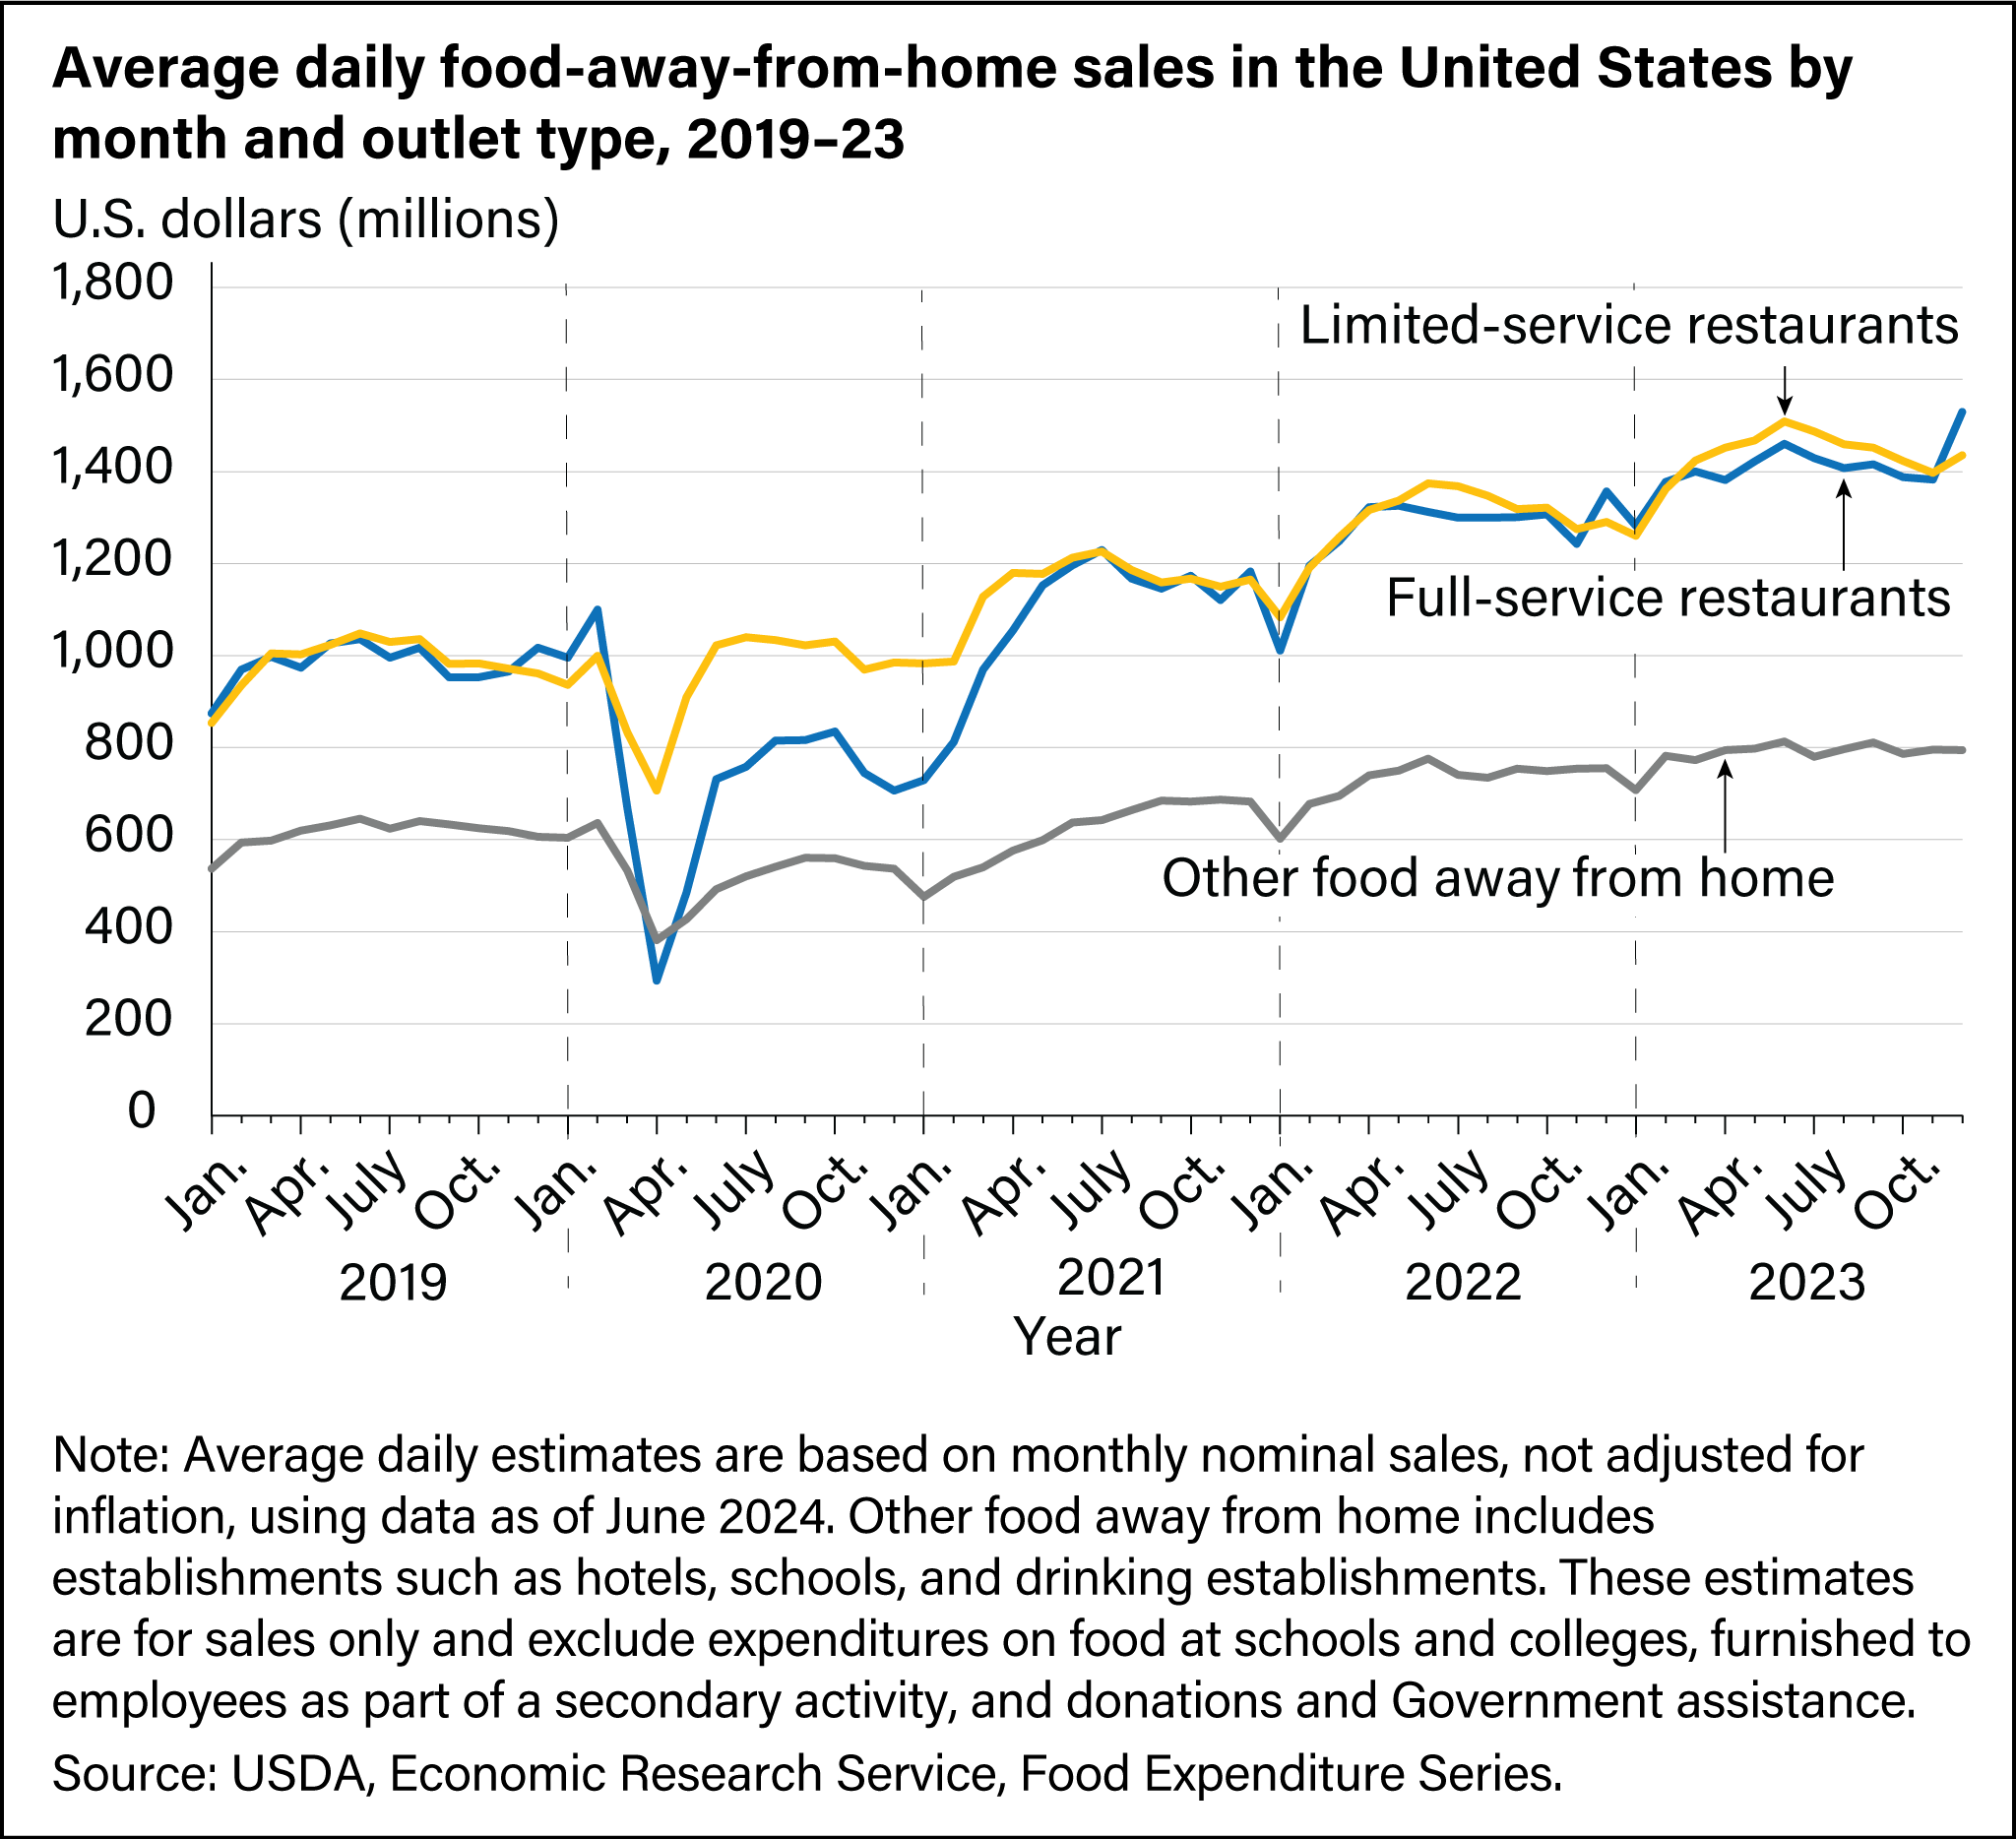
Variations in consumer demand for food away from home (FAFH) can be studied in greater detail by observing average daily sales at FAFH outlets. Sales at full- and limited-service outlets follow similar patterns year after year. Sales typically increase the most during the spring and continue to increase more slowly during the summer. While sales at limited-service restaurants peak in the summer, sales at full-service restaurants see a boost in December. However, when the calendar flips to January, a noticeable downturn in FAFH sales typically occurs.
- In 2024, the average daily full-service sales were the lowest in January ($1,307 million) and peaked in December ($1,584 million).
- The average daily limited-service sales were the lowest in January ($1,337 million) but peaked in June ($1,584 million) in 2024.
- In 2024, the average daily sales at all other FAFH outlets were also the lowest in January ($679 million) and the highest in February ($760 million).
Download chart data in Excel format
Food Away From Home at the U.S. State Level
In 2024, per capita food-away-from-home (FAFH) purchases were higher nationally than any year on record at $4,275. However, per capita FAFH sales were uneven across States.
- In 2024, Louisiana had per capita FAFH sales at $3,900, which was the median value across all States.
- In 2024, Washington, DC ($11,364), Hawaii ($7,131), and Nevada ($7,007) had the highest per capita FAFH sales in the United States, each more than 27 percent higher than the fourth highest State (California) at $5,504. Possible factors for these outliers include tourism for all three areas, as well as interstate-commuting employees in Washington, DC. Tourists and commuters tend to spend more on FAFH, a relatively more costly form of food purchases, than on food at home (FAH) in the States they are visiting.
- In 2024, West Virginia had the lowest per capita FAFH purchases at $2,885, followed by Iowa ($3,078), Wisconsin ($3,099), Idaho ($3,153), and North Dakota ($3,262).
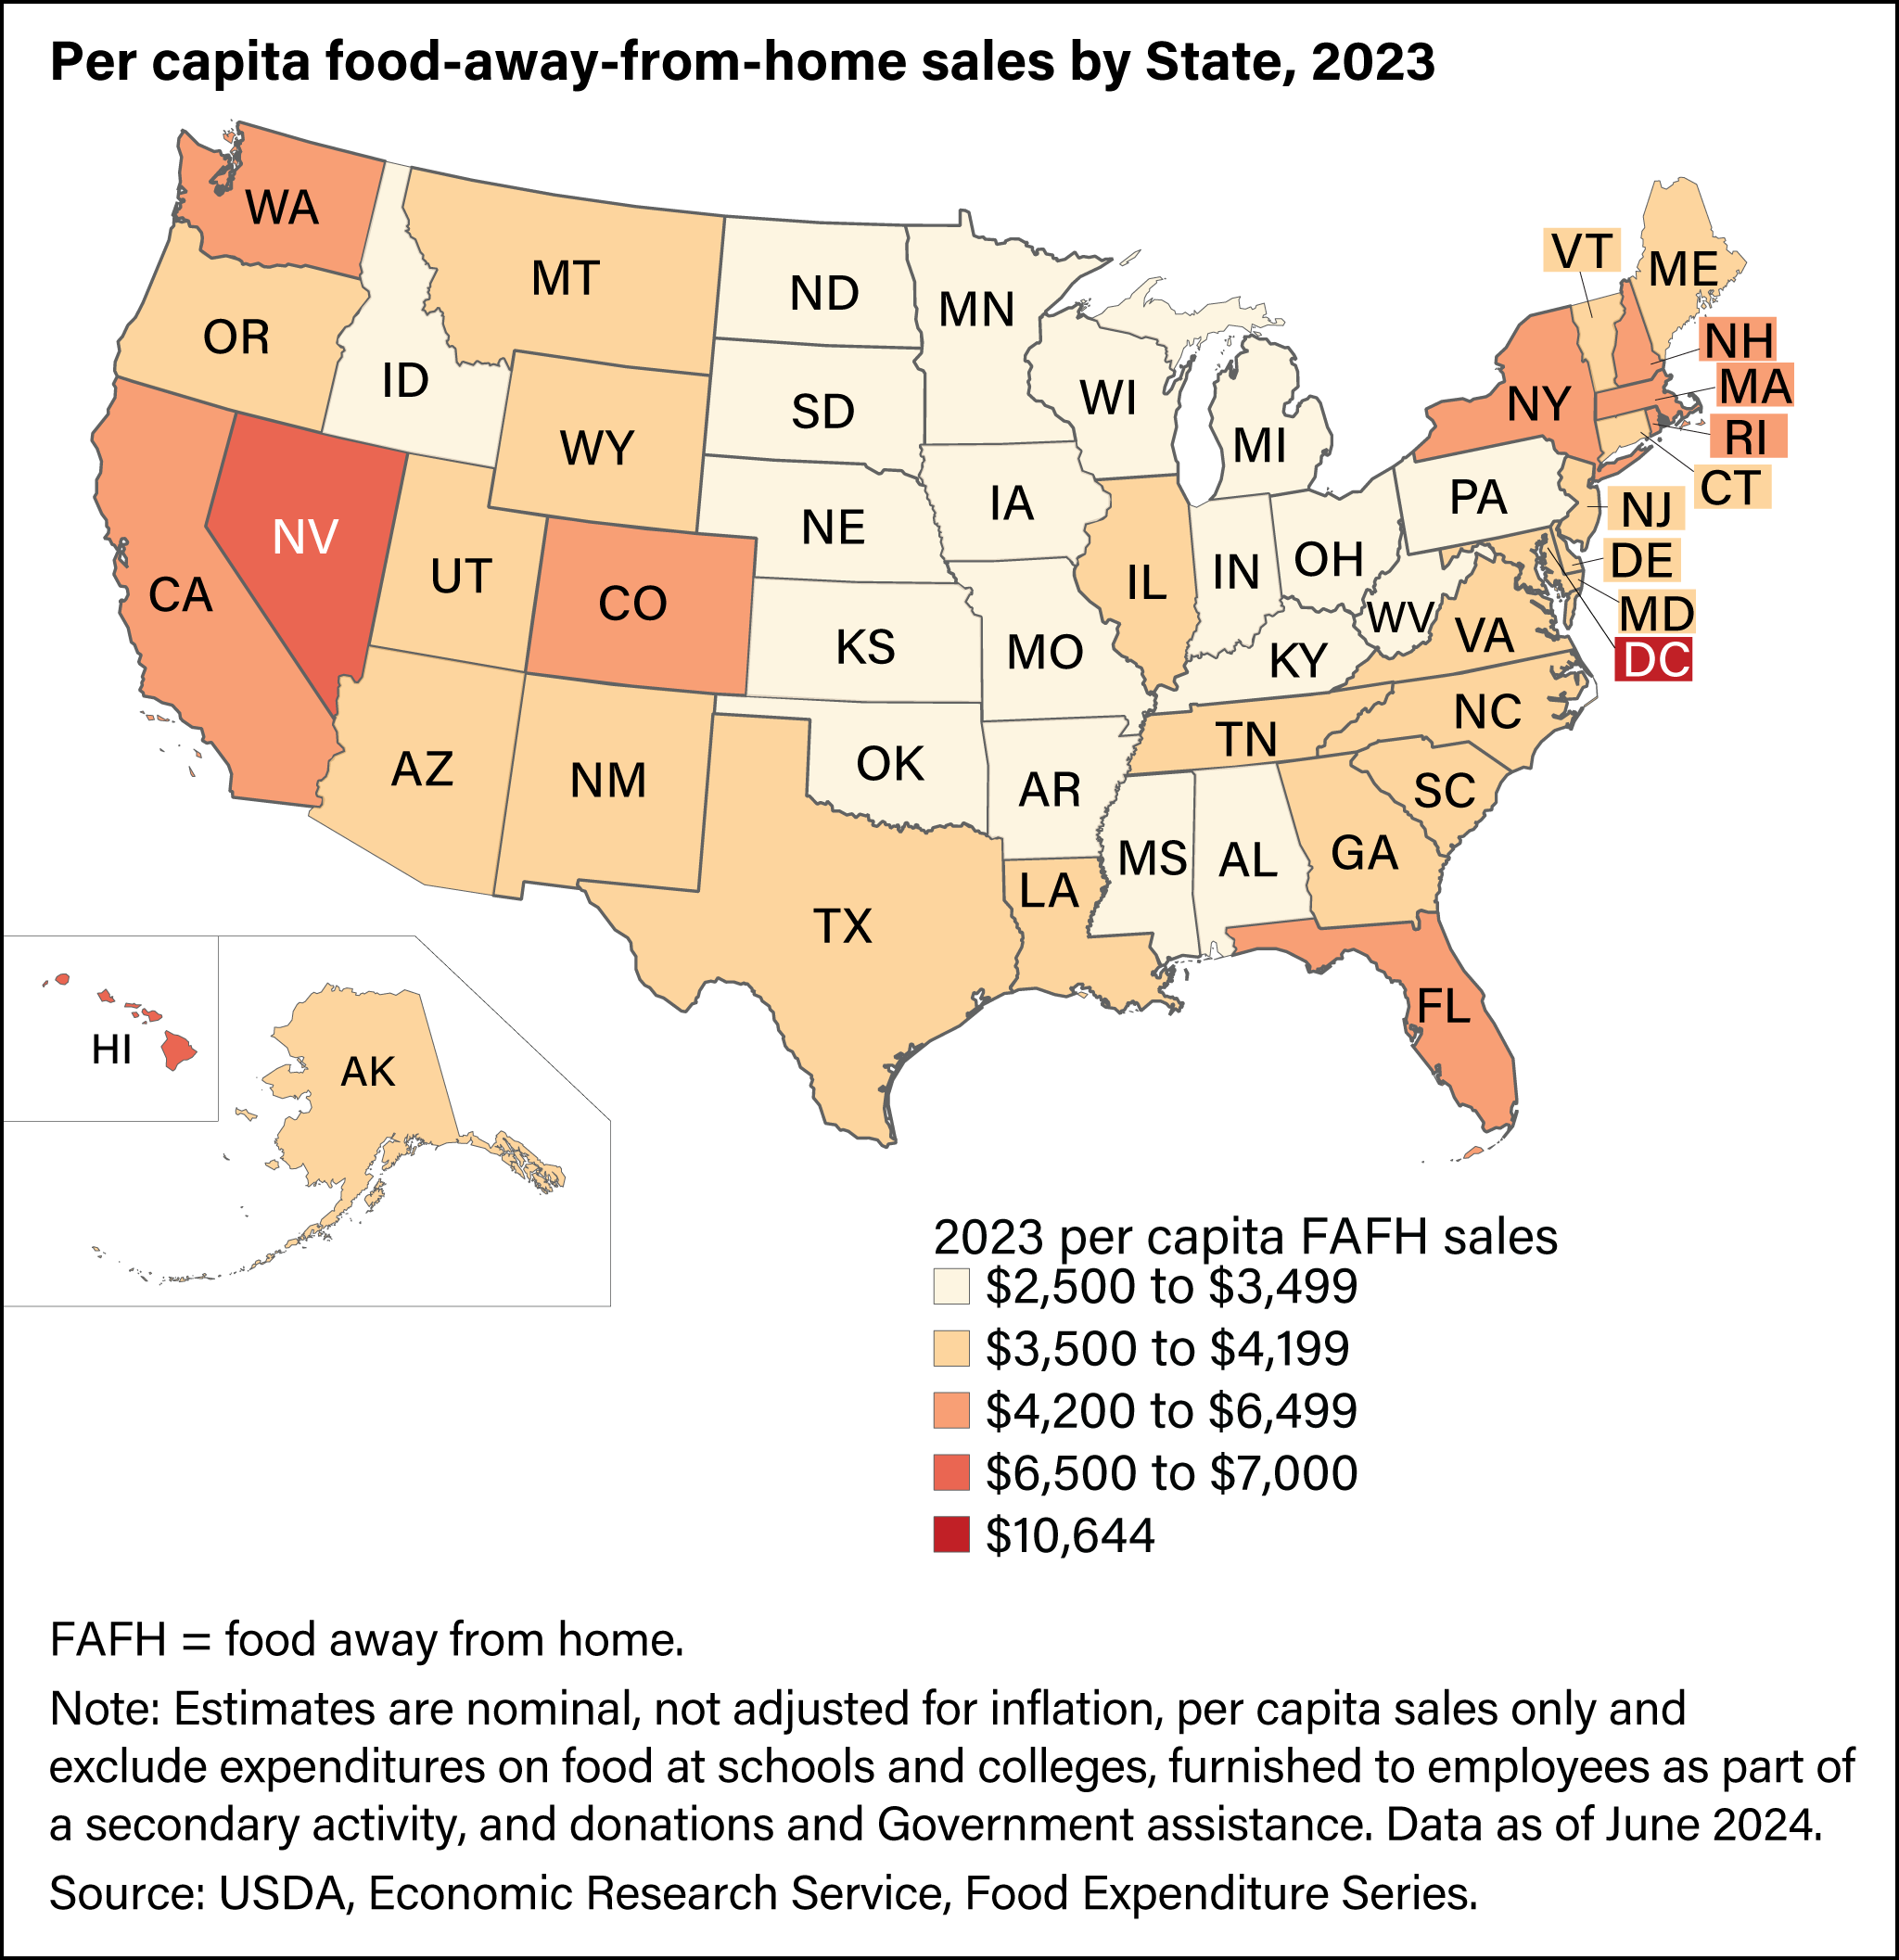
Download chart data in Excel format
Information used in this topic page is drawn from the Economic Research Service’s Food Expenditure Series data product.