ERS provides information on a range of farm labor issues, including:
- Size and composition of the U.S. agricultural workforce (self-employed versus hired)
- Recent trends in the employment of hired farmworkers
- Demographic characteristics of hired farmworkers – including age, sex, and nativity
- Wages of hired farmworkers
- Labor cost share of total gross revenues
- H-2A temporary agricultural program
- Adverse Effect Wage Rate (AEWR)
- Legal status and migration practices of hired farmworkers (crop agriculture only)
Finally, we provide links to key data sources with summaries.
Size and Composition of the U.S. Agricultural Workforce
The U.S. agricultural workforce has long consisted of two groups of workers: (1) self- employed farm operators and their family members, and (2) hired workers. From 1950 to 1990, employment in both groups of workers was in long-term decline, as mechanization contributed to rising agricultural productivity, thereby reducing the need for labor. Since 1990, however, employment levels have stabilized.
The reduction in self-employed and family labor through 1990 was more rapid than the decline in hired labor. According to the Farm Labor Survey (FLS) of USDA's National Agricultural Statistical Service (NASS), the number of self-employed and family farmworkers declined from 7.60 million in 1950 to 2.06 million in 2000, a 73-percent reduction. Over this same period, the average annual employment of hired farmworkers (including on-farm support personnel and those who work for farm labor contractors) declined from 2.33 million to 1.13 million, a 51-percent reduction. As a result, the proportion of hired workers increased over this period.

The rest of this page describes the employment, earnings, demographic characteristics, and other information for the hired farm labor force only. Information on the well-being of self-employed farmers and their families may be found on the ERS topic page on Farm Household Well-being.
Hired farmworkers play an essential role in U.S. agriculture, especially in labor-intensive agricultural industries, even though farmworkers make up less than 1 percent of all U.S. wage and salary workers. According to the 2022 Census of Agriculture, wages and salaries (plus contract labor costs) represented 42 percent of production expenses for greenhouse and nursery operations, and 40 percent for fruit and tree nut operations, compared with 12 percent for all farms.
Hired farmworkers are found in a variety of occupations—including field crop workers, nursery workers, livestock workers, graders and sorters, agricultural inspectors, supervisors, and hired farm managers. Most farmworkers are wage and salary workers, hired directly by farmers. However, some are employees of agricultural service companies—including farm labor contractors, custom harvest providers, and management service providers. Some industrywide employment estimates also include support personnel on farms—such as human resource managers, sales agents, and truck drivers.
Many hired farmworkers in the United States were born in Mexico or Central America, with many lacking authorization to work legally in the United States. In recent years, farmworkers have become more settled, traveling shorter distances from home to work and are less likely to participate in seasonal, “follow-the-crop” migration. The number of young, recent immigrants working in agriculture has fallen, and as a result, the farm workforce is aging. Over the past 30 years, wages for hired farmworkers have gradually risen, both in real terms and in relation to wages for the average nonsupervisory worker in a nonfarm occupation.
Hired farmworkers are employed in both metropolitan (urban) and nonmetropolitan (rural) counties. The statistics presented here refer to farmworkers nationwide, unless otherwise indicated.
Recent Trends in the Employment of Hired Farmworkers
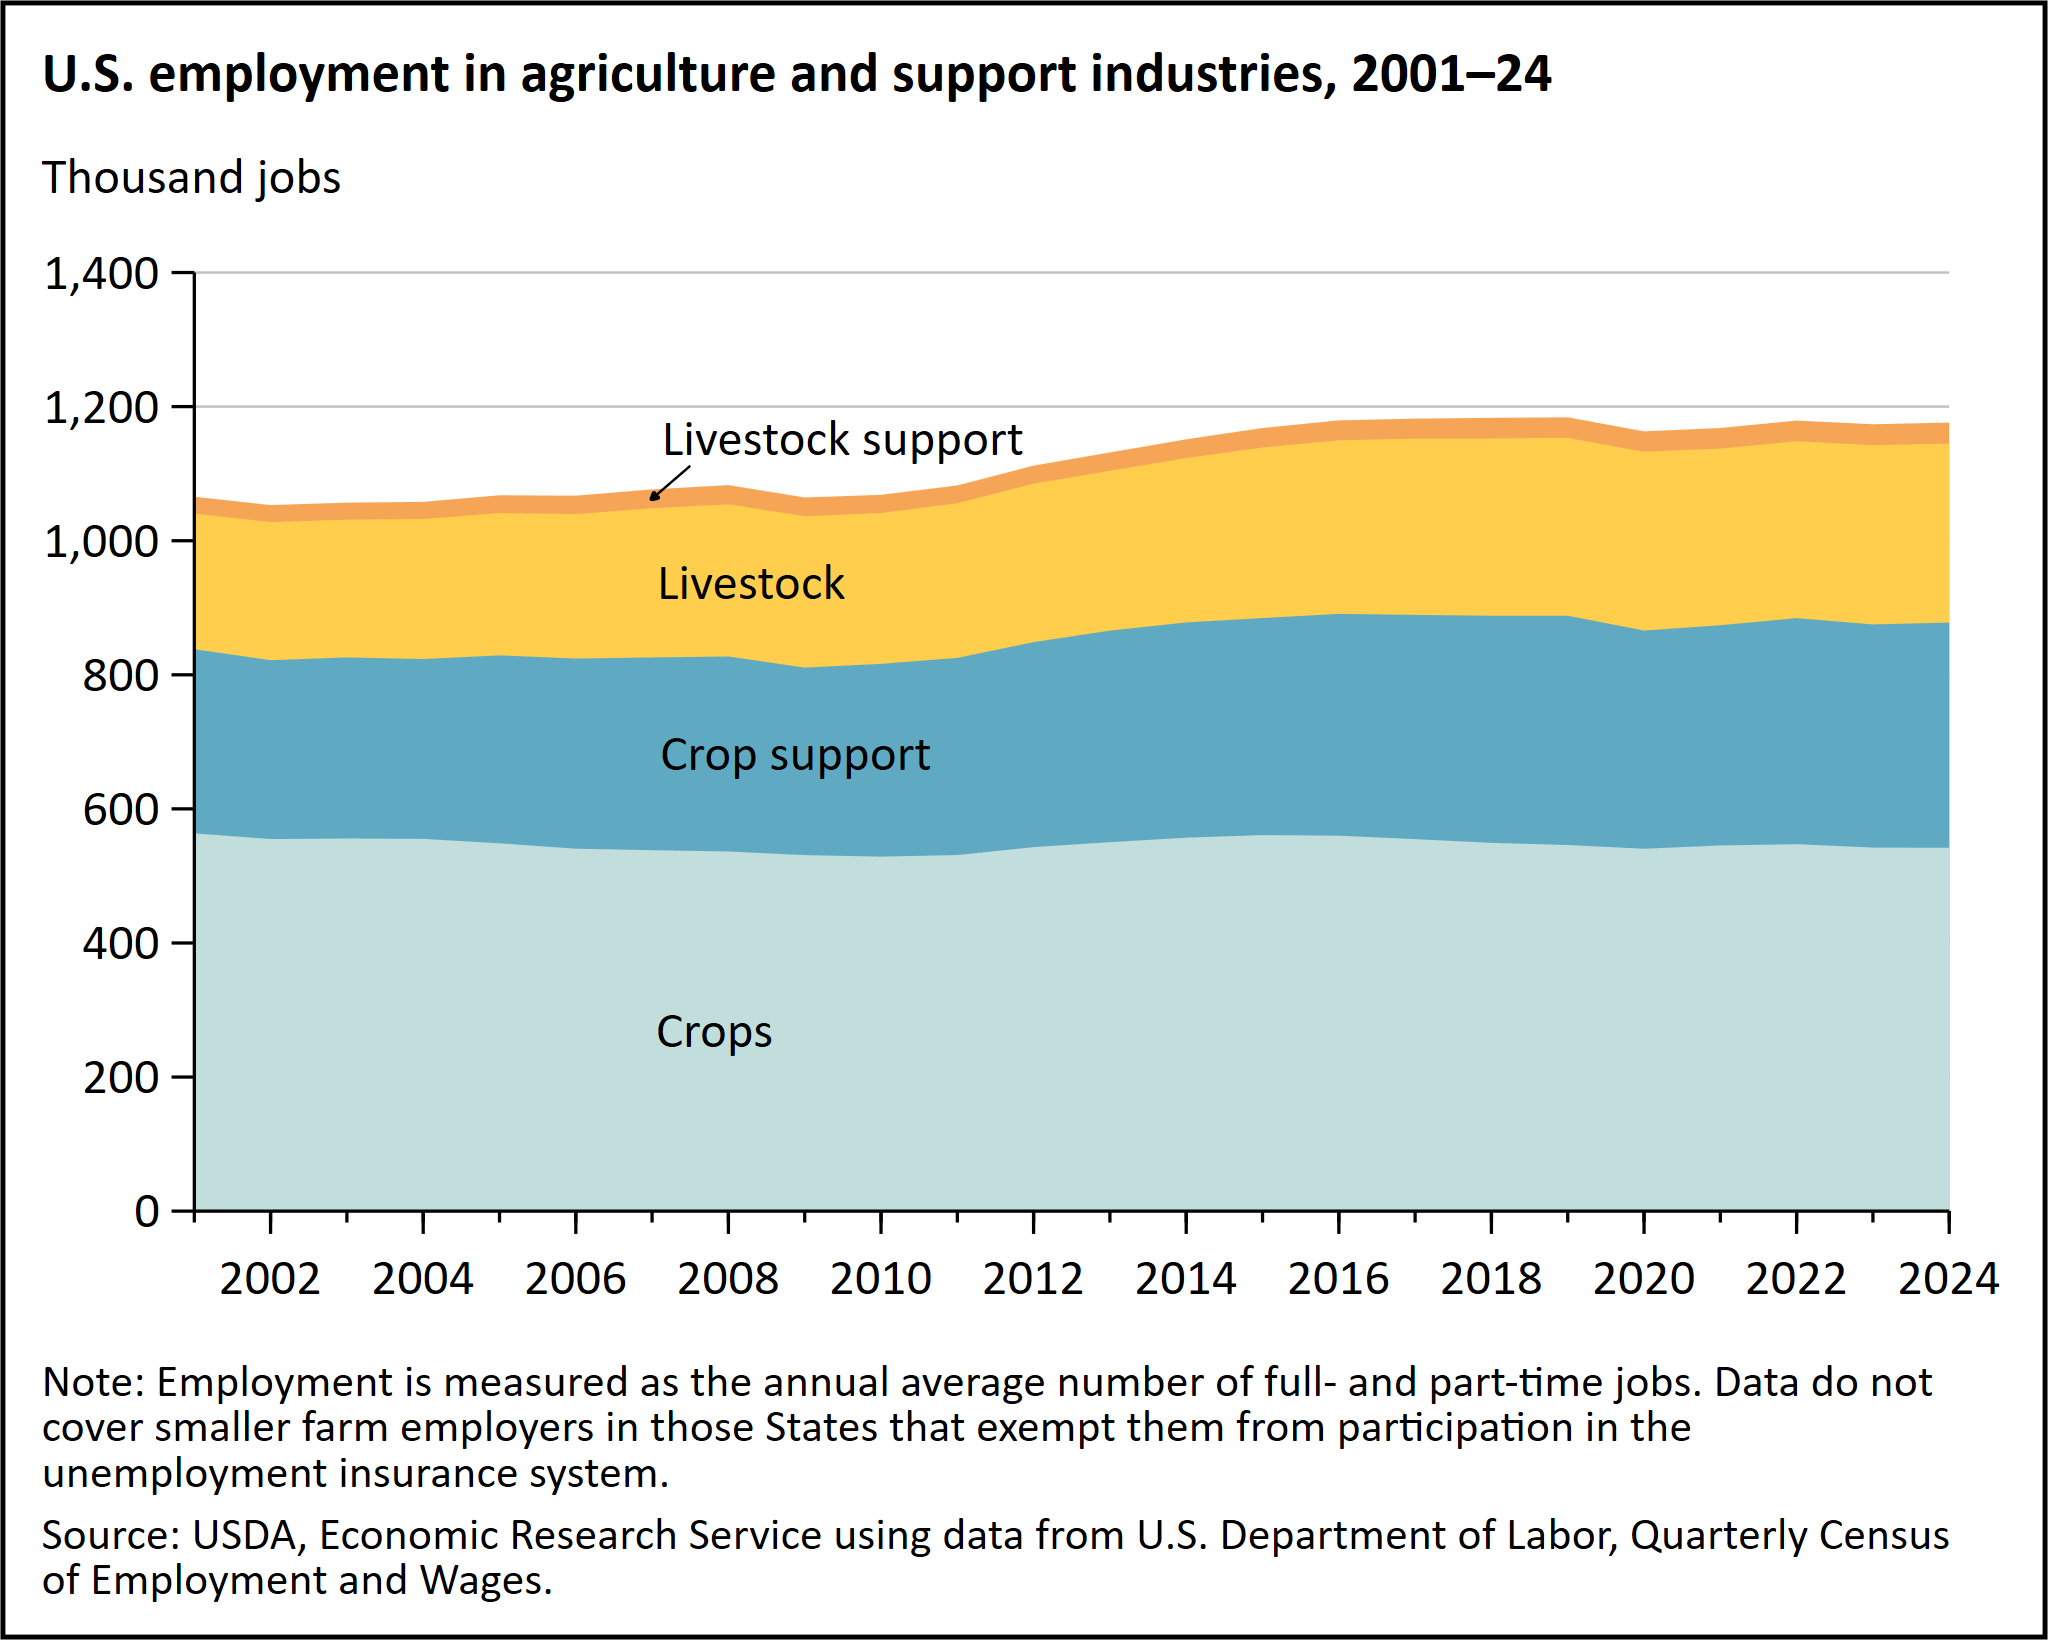
According to the Quarterly Census of Employment and Wages (QCEW) conducted by the U.S. Department of Labor’s Bureau of Labor Statistics (BLS), wage and salary employment in agriculture stabilized in the first decade of the 21st century and has gradually increased since 2010 (measured as the annual average number of full- and part-time jobs). Notably, QCEW employment includes support industries such as farm labor contracting. Employment rose from 1.07 million in 2010 to 1.18 million in 2024, a gain of 10 percent.
From 2010 to 2024, employment increases were highest in crop-support services (which added about 48,400 jobs, a 17-percent increase) and the livestock sector (which added about 42,000 jobs, a 19-percent increase). It should be noted that the QCEW is based on unemployment insurance records, not on surveys of farms or households. As a result, the QCEW does not cover smaller farm employers in those States that exempt such employers from participating in the unemployment insurance system. However, other data sources (such as the American Community Survey and the Current Population Survey) also find rising farm employment since the turn of the 21st century.
Demographic Characteristics of Hired Farmworkers
Demographic information on farmworkers can be found in the American Community Survey (ACS) from the U.S. Department of Commerce, Bureau of the Census. These data allow us to distinguish among farm laborers, managers/supervisors, and other occupations. Farm laborers have lower levels of educational attainment, are slightly younger, are more likely to be Hispanic of Mexican origin, and are less likely to be U.S. citizens than both workers in other agricultural occupations and the U.S. wage and salary workforce as a whole.
| Item | Farm laborers, graders and sorters | Farm managers, inspectors, and supervisors | All other occupations in agriculture | Agriculture: All occupations | All U.S. private wage and salary workers |
|---|---|---|---|---|---|
| Percent female | 26 | 17 | 35 | 27 | 44 |
| Average age in years | 39.6 | 42.4 | 42.3 | 40.8 | 40.5 |
| Percent under age 25 | 20 | 11 | 15 | 17 | 18 |
| Percent over age 44 | 39 | 43 | 45 | 41 | 41 |
| Percent married | 48 | 64 | 55 | 53 | 48 |
| Race/Ethnicity/Ancestry | |||||
| Percent White, not Hispanic | 31 | 63 | 62 | 46 | 57 |
| Percent Black, not Hispanic | 3 | 2 | 4 | 3 | 11 |
| Percent other, not Hispanic | 4 | 6 | 6 | 5 | 11 |
| Percent Hispanic: Mexican origin | 55 | 23 | 23 | 40 | 12 |
| Percent Hispanic: Other | 8 | 6 | 5 | 7 | 8 |
| Percent born in U.S. (includes Puerto Rico) | 46 | 76 | 79 | 61 | 81 |
| Percent U.S. citizens | 56 | 83 | 87 | 70 | 91 |
| Education | |||||
| Percent lacking high school diploma | 44 | 17 | 15 | 31 | 8 |
| Percent with high school diploma (includes equivalency) | 33 | 33 | 32 | 33 | 29 |
| Percent with at least some college | 22 | 50 | 52 | 36 | 63 |
| Note: This table counts all private sector wage and salary workers employed in the crop, livestock, and agricultural support industries. Source: USDA, Economic Research Service analysis of data from U.S. Department of Commerce, Bureau of the Census, American Community Survey, 2022. |
|||||
Differences in demographics are also evident between crop and livestock workers (not shown in the table). A larger share of laborers in crops and related support industries are female (28 percent versus 20 percent in livestock). Crop laborers are also less likely to be non-Hispanic White (26 percent versus 49 percent for livestock) and less likely to have been born in the United States (41 percent for crop workers in manual labor occupations versus 65 percent for manual labor livestock workers). Finally, crop laborers have lower levels of educational attainment: 47 percent lack a high school degree, compared with 34 percent in livestock.
Notably, the U.S. Department of Labor’s National Agricultural Workers Survey (NAWS) (discussed below) finds larger shares of foreign-born, Hispanic, and less-educated employees among crop and support workers than does the ACS (livestock workers are not surveyed in NAWS). For example (according to NAWS estimates spanning fiscal years 2020–22), just 32 percent of crop farmworkers in manual labor occupations were U.S. born, compared with 41 percent in the 2022 ACS.
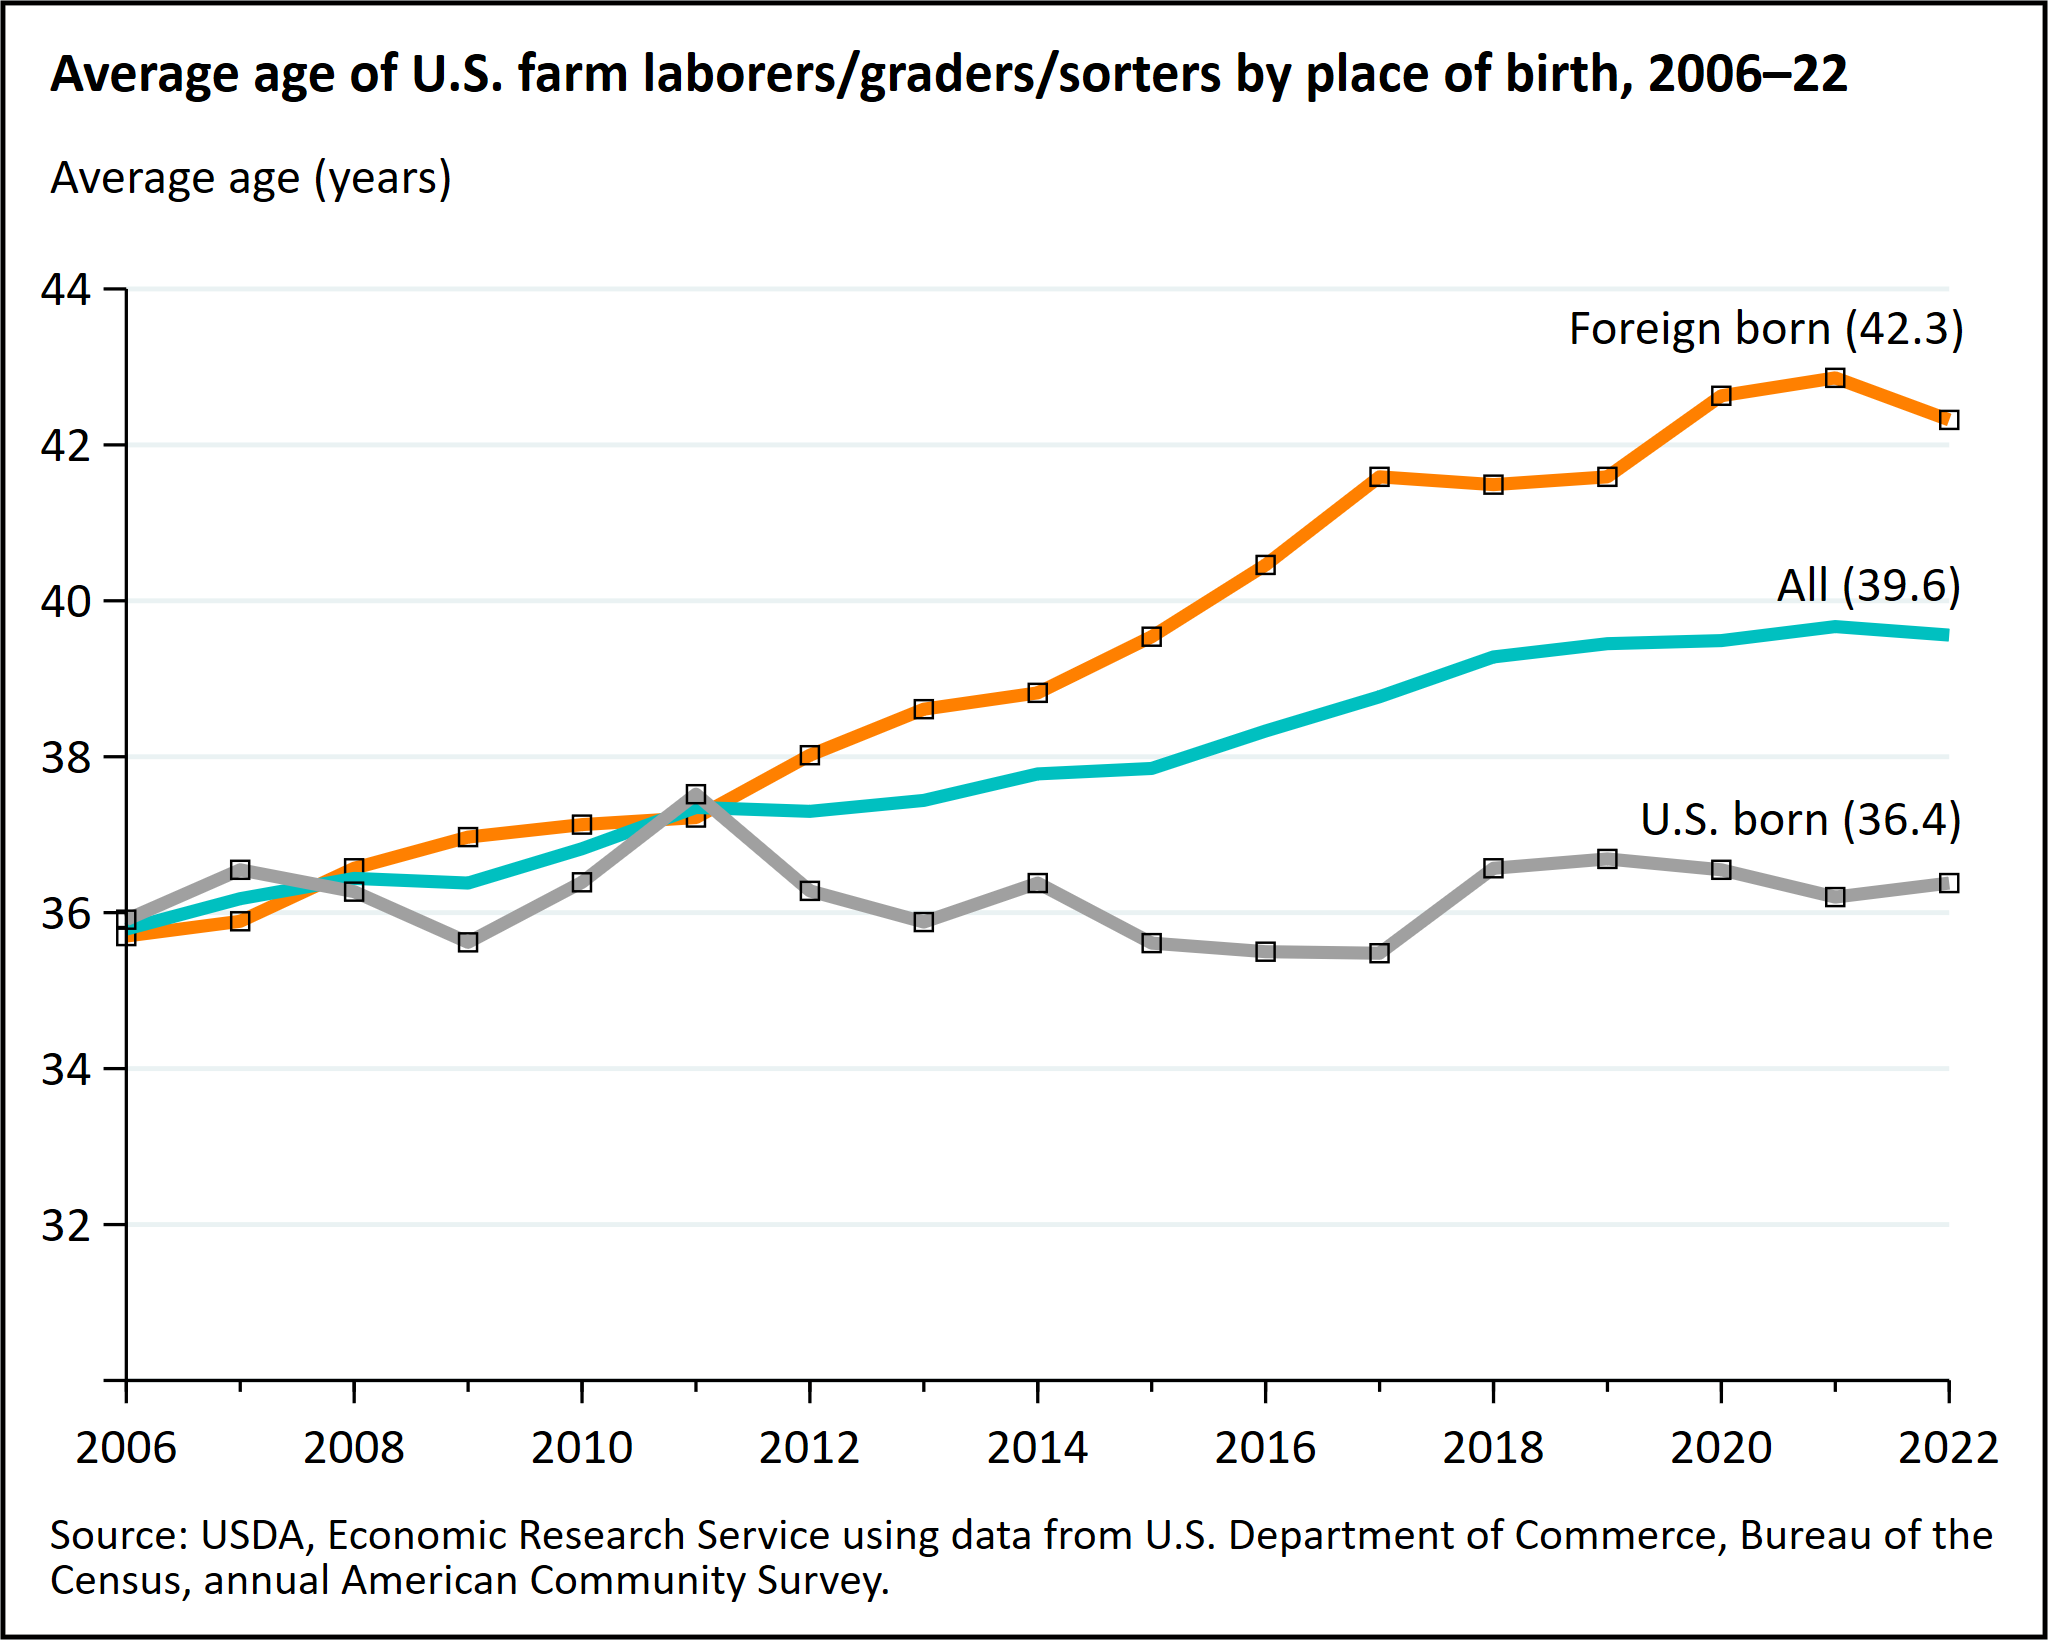
The Hired Farm Workforce Is Aging
As fewer young immigrants are entering into agriculture, the average age of foreign-born farmworkers has risen, pulling up the average for the farm workforce as a whole. Between 2006 and 2022, the average age of foreign-born farmworkers rose by close to 7 years. In contrast, the average age for U.S.-born farmworkers remained roughly constant over this period.
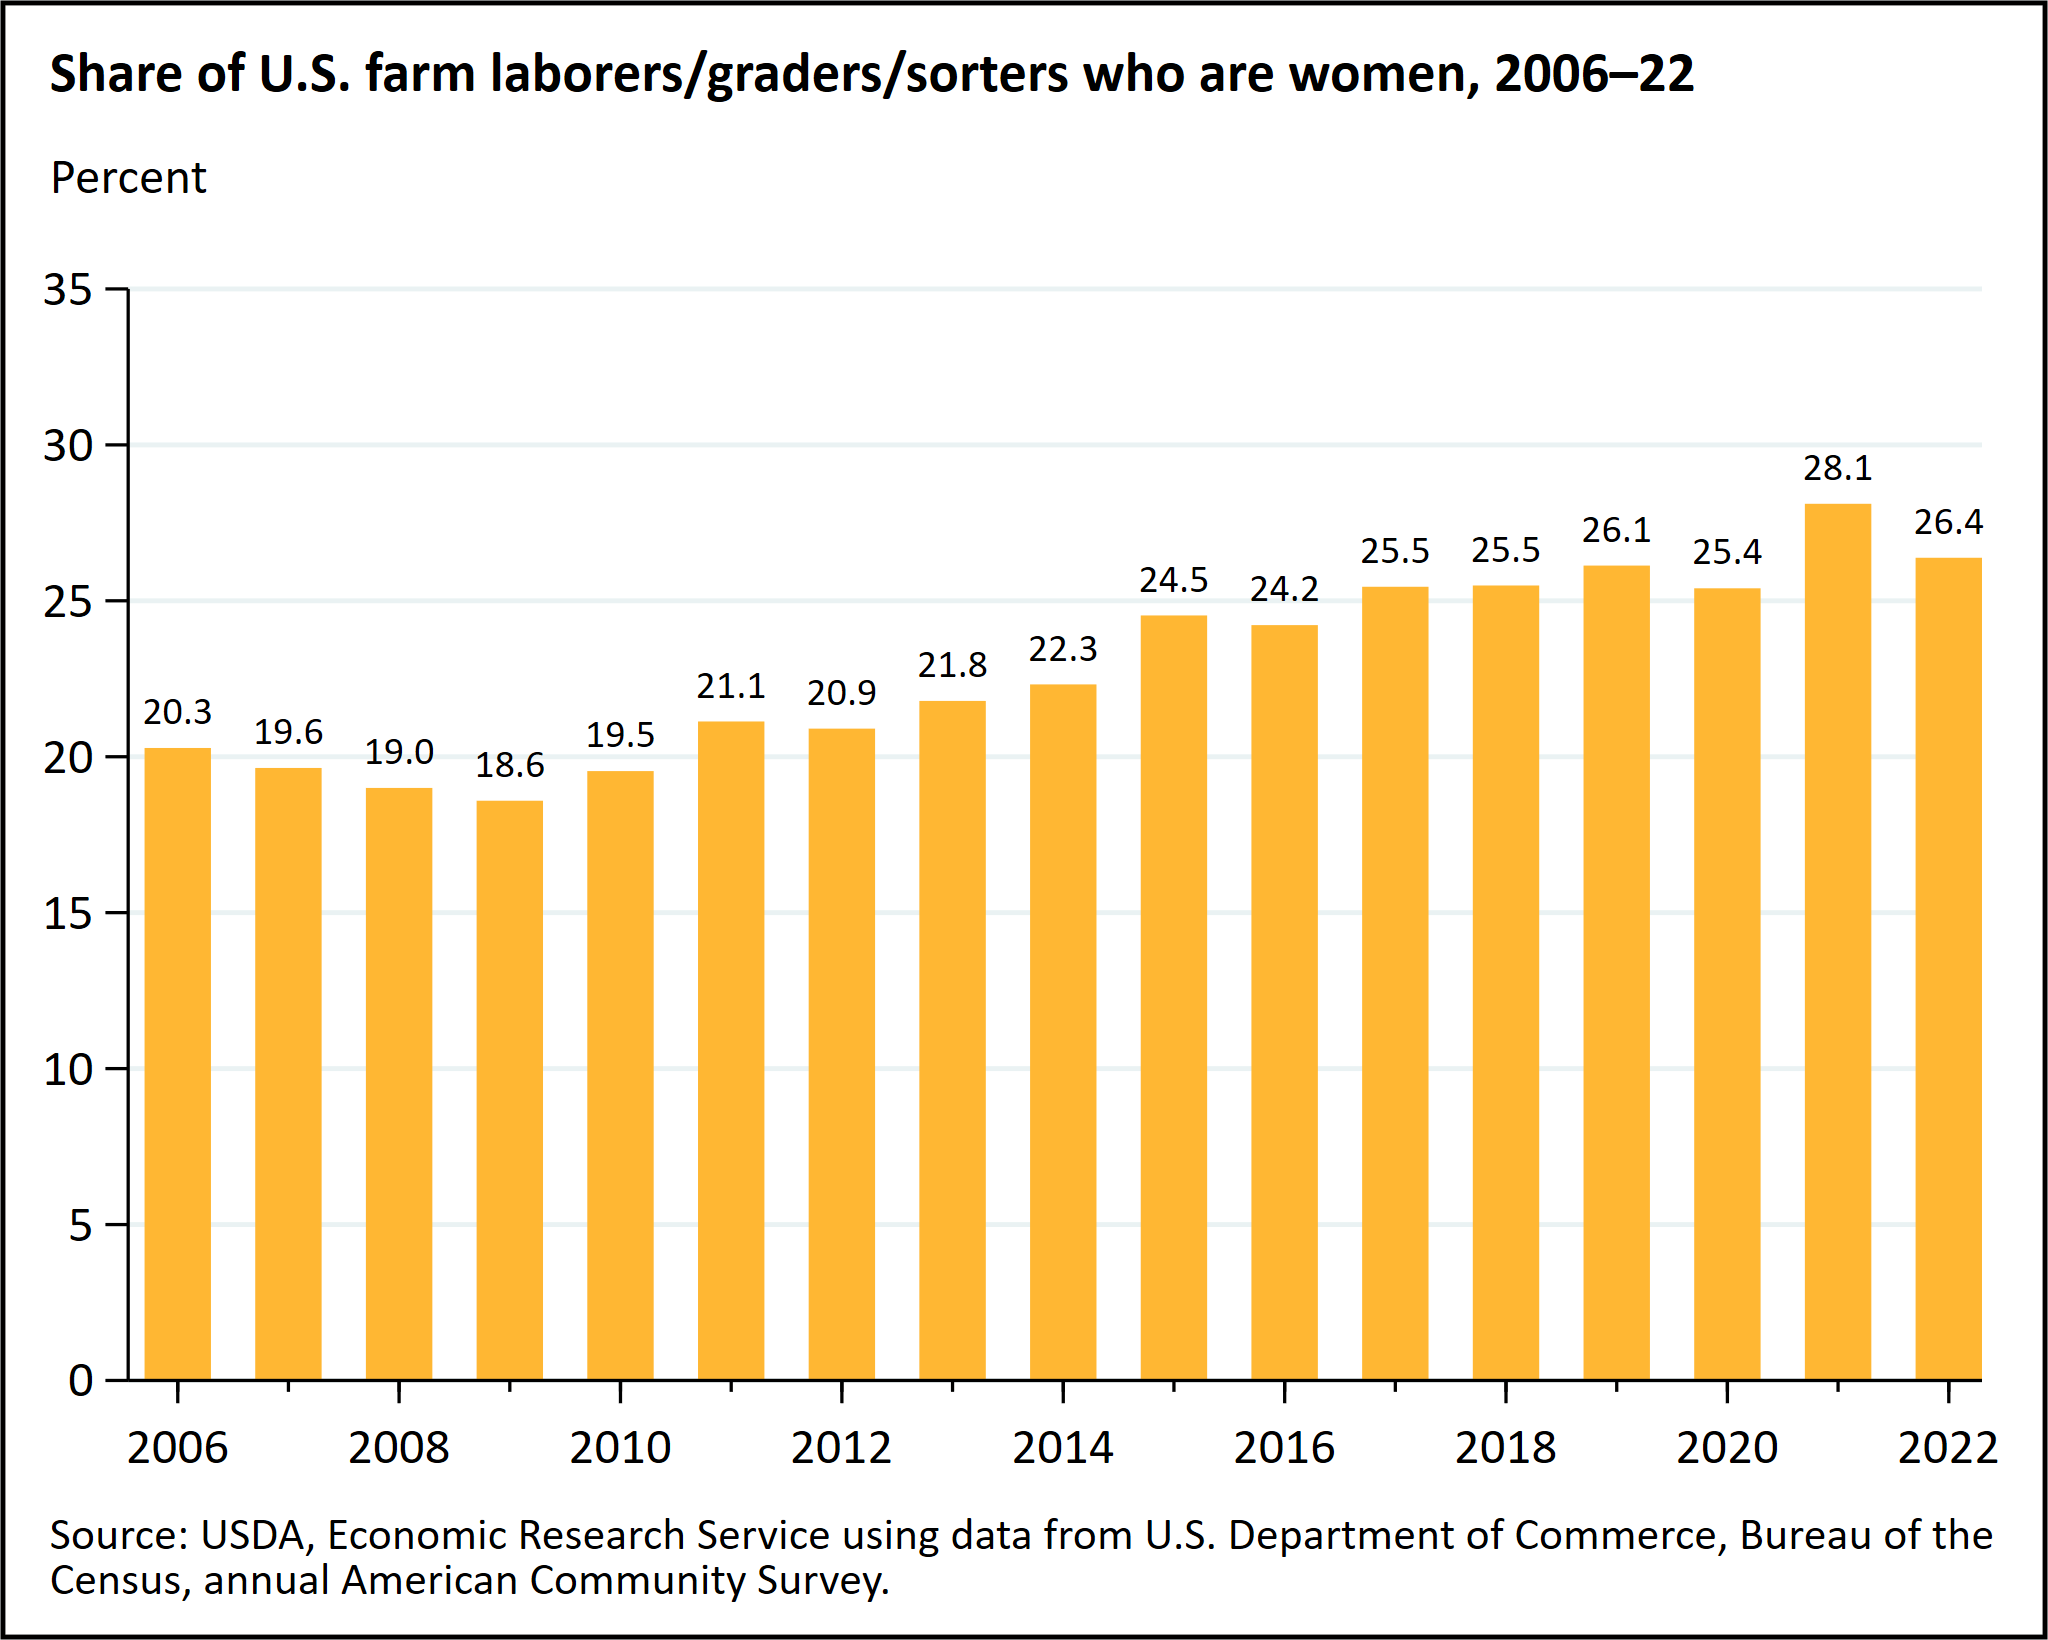
Women Are an Increasing Share of the Hired Farm Workforce
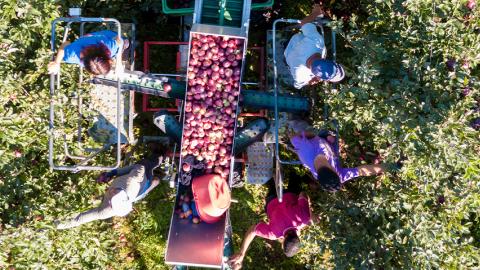
The share of farmworkers who are women declined from 20.3 percent to 18.6 percent between 2006 and 2009 and then climbed to 26.4 percent in 2022. The fact that the female share fell during the Great Recession and has risen during the economic recovery is consistent with men moving into agriculture as employment in the nonfarm economy declines and out of agriculture as nonfarm job prospects improve. The rising female share is also consistent with the fact that, as labor costs rise, some growers are adopting mechanical aids which facilitate more women and older workers in performing tasks that traditionally have been performed by younger men. Examples of such mechanical aids include hydraulic platforms that replace ladders in tree-fruit harvesting, and mobile conveyor belts that reduce the distance heavy loads must be carried.
Wages of Hired Farmworkers
According to data from the FLS, real (inflation-adjusted) wages for nonsupervisory crop and livestock workers (excluding contract labor) rose at an average annual rate of 1.2 percent per year between 1990 and 2024. In the past 10 years, however, real farm wages grew at 1.9 percent per year, consistent with growers' reports that workers had become harder to find.
In 1990, the average real-farm wage for nonsupervisory crop and livestock workers was just over half the average real wage in the nonfarm economy for private-sector, nonsupervisory occupations ($12.05 versus $23.87, in 2024 dollars). By 2024, the farm wage equaled about 60 percent of the nonfarm wage ($18.12 versus $30.13). In other words, the gap between farm and nonfarm wages is still substantial, but it is slowly shrinking.

Wages for nonsupervisory occupations ranged from $17.23 for farm, ranch, and aquacultural farmworkers to $19.07 for equipment operators. For five out of the six nonsupervisory occupations, wages were more than 3 percent higher in 2024 than in 2023 (not adjusted for inflation).
Average hourly wages for hired agricultural managers stood at $30.70 in 2024, up 6.6 percent from the year before. Supervisor wages averaged $26.83 per hour, up 4.8 percent from 2023 (not adjusted for inflation).
| Occupation | SOC code | Employment share 2024 (percent) | Average hourly wage 2024 | Nominal wage growth, 2023-24 (percent change) |
|---|---|---|---|---|
| Graders and sorters, agricultural products | (45-2041) | 2 | 18.31 | 10.45 |
| Agricultural equipment operators | (45-2091) | 17 | 19.07 | 3.24 |
| Farmworkers, crop, nursery, and greenhouse | (45-2092) | 44 | 18.24 | 3.61 |
| Farmworkers, farm, ranch, and aquacultural | (45-2093) | 22 | 17.23 | 4.33 |
| Agricultural workers, all other | (45-2099) | 1 | 18.14 | 1.78 |
| Packers and packagers, hand | (53-7064) | 3 | 17.57 | 7.38 |
| Subtotal, nonsupervisory farmworkers | 88 | 18.13 | 3.89 | |
| Farmers, ranchers, and agricultural managers | (11-9013) | 3 | 30.70 | 6.64 |
| First-line supervisors | (45-1011) | 3 | 26.83 | 4.78 |
| Subtotal, supervisory and nonsupervisory occupations | 94 | 18.81 | 3.74 | |
| All other farm occupations | 6 | 23.70 | -2.86 | |
| All farm occupations | 100 | 19.10 | 3.09 | |
| Note: SOC = Standard Occupational Classification (SOC). Components may not sum to 100 percent because of independent rounding. Source: USDA, Economic Research Service using data from USDA, National Agricultural Statistics Service, Farm Labor Survey. |
||||
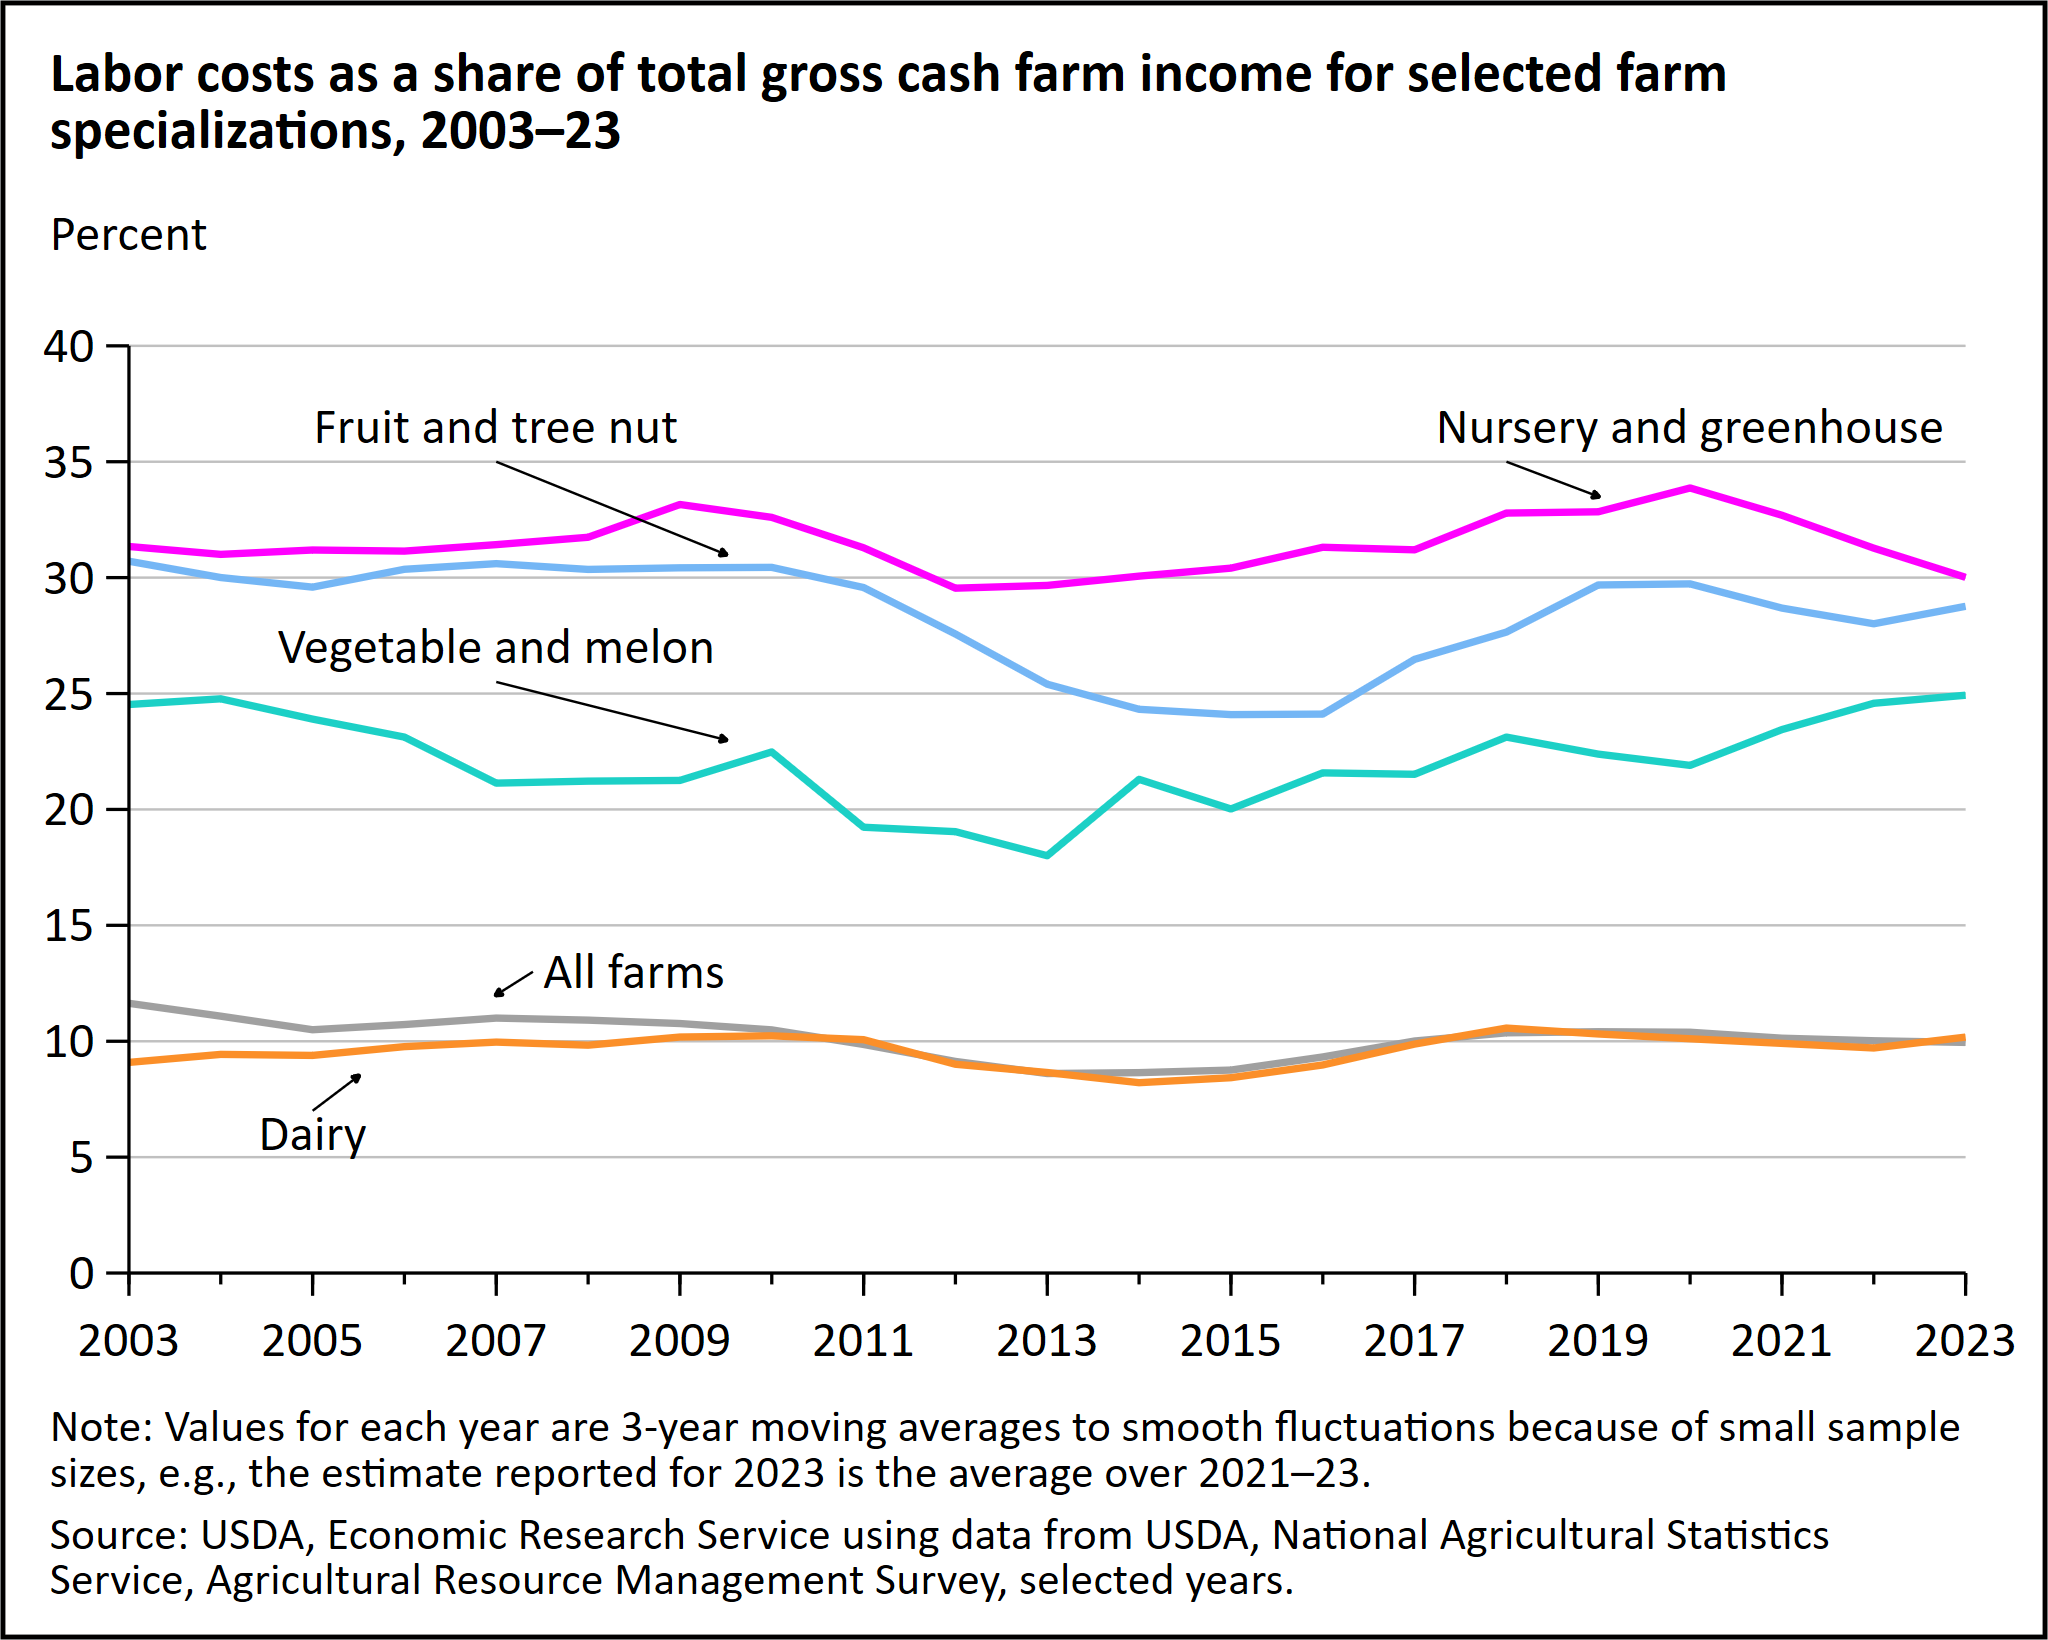
Labor Cost Share of Total Gross Revenues
Although farm wages are rising in both nominal and real terms, increases in productivity and/or output prices appear to have offset the impact of rising labor costs on farm incomes. As a result, labor costs as a share of gross cash farm income have not shown an upward trend for the sector (as a whole) over the past 20 years. For all farms, labor costs (including contract labor, and cash-fringe benefit costs) averaged 10.4 percent of gross cash income during 2021–23, compared with 11.0 percent during 1998–2000.
However, these trends in labor cost shares differ by commodity. For the fruit and vegetable industries, which tend to be more labor-intensive, labor-cost shares have generally increased in recent years. For the dairy industry, which relies heavily on foreign-born labor, labor costs as a share of income have remained relatively stable over the past 20 years.
H-2A Temporary Agricultural Program
The H-2A Temporary Agricultural Program—often called the H-2A visa program—provides a legal means to bring foreign-born workers to the United States to perform seasonal farm labor on a temporary basis (for a period of up to 10 months). Crop farmers can use this program to meet their seasonal labor needs, but most livestock producers—such as ranches, dairies, and hog and poultry operations—are not legally allowed to use the program to meet year-round labor needs. An exception to this restriction is made for producers of livestock on the range, such as sheep and goat operations, who can use H-2A workers year-round.
Employers in the H-2A program must demonstrate, and the U.S. Department of Labor must certify, that efforts to recruit U.S. workers were not successful.
Employers must also pay H-2A workers a minimum wage, which may not be lower than a rate established by the Department of Labor, known as the Adverse Effect Wage Rate (AEWR) (see next section for details). In addition, employers must provide housing for their H-2A workers and pay for their domestic and international transportation.
One of the clearest indicators of the scarcity of farm labor is the fact that the number of H-2A positions requested and approved has increased more than sevenfold in the past 19 years, from just over 48,000 positions certified in fiscal year (FY) 2005 to around 385,000 in FY 2024. The average duration of an H-2A certification in FY 2024 was 5.75 months, implying that the 385,000 positions certified represented around 184,000 full-year equivalents. A certified job does not necessarily result in the issuance of a visa. This is partly because some employers do not follow through on hiring H-2A workers, and some workers may fill more than one certified job. In fact, in recent years, only about 80 percent of jobs certified as H-2A have resulted in visas. Around 315,500 visas were issued in FY 2024 by the U.S. Department of State.

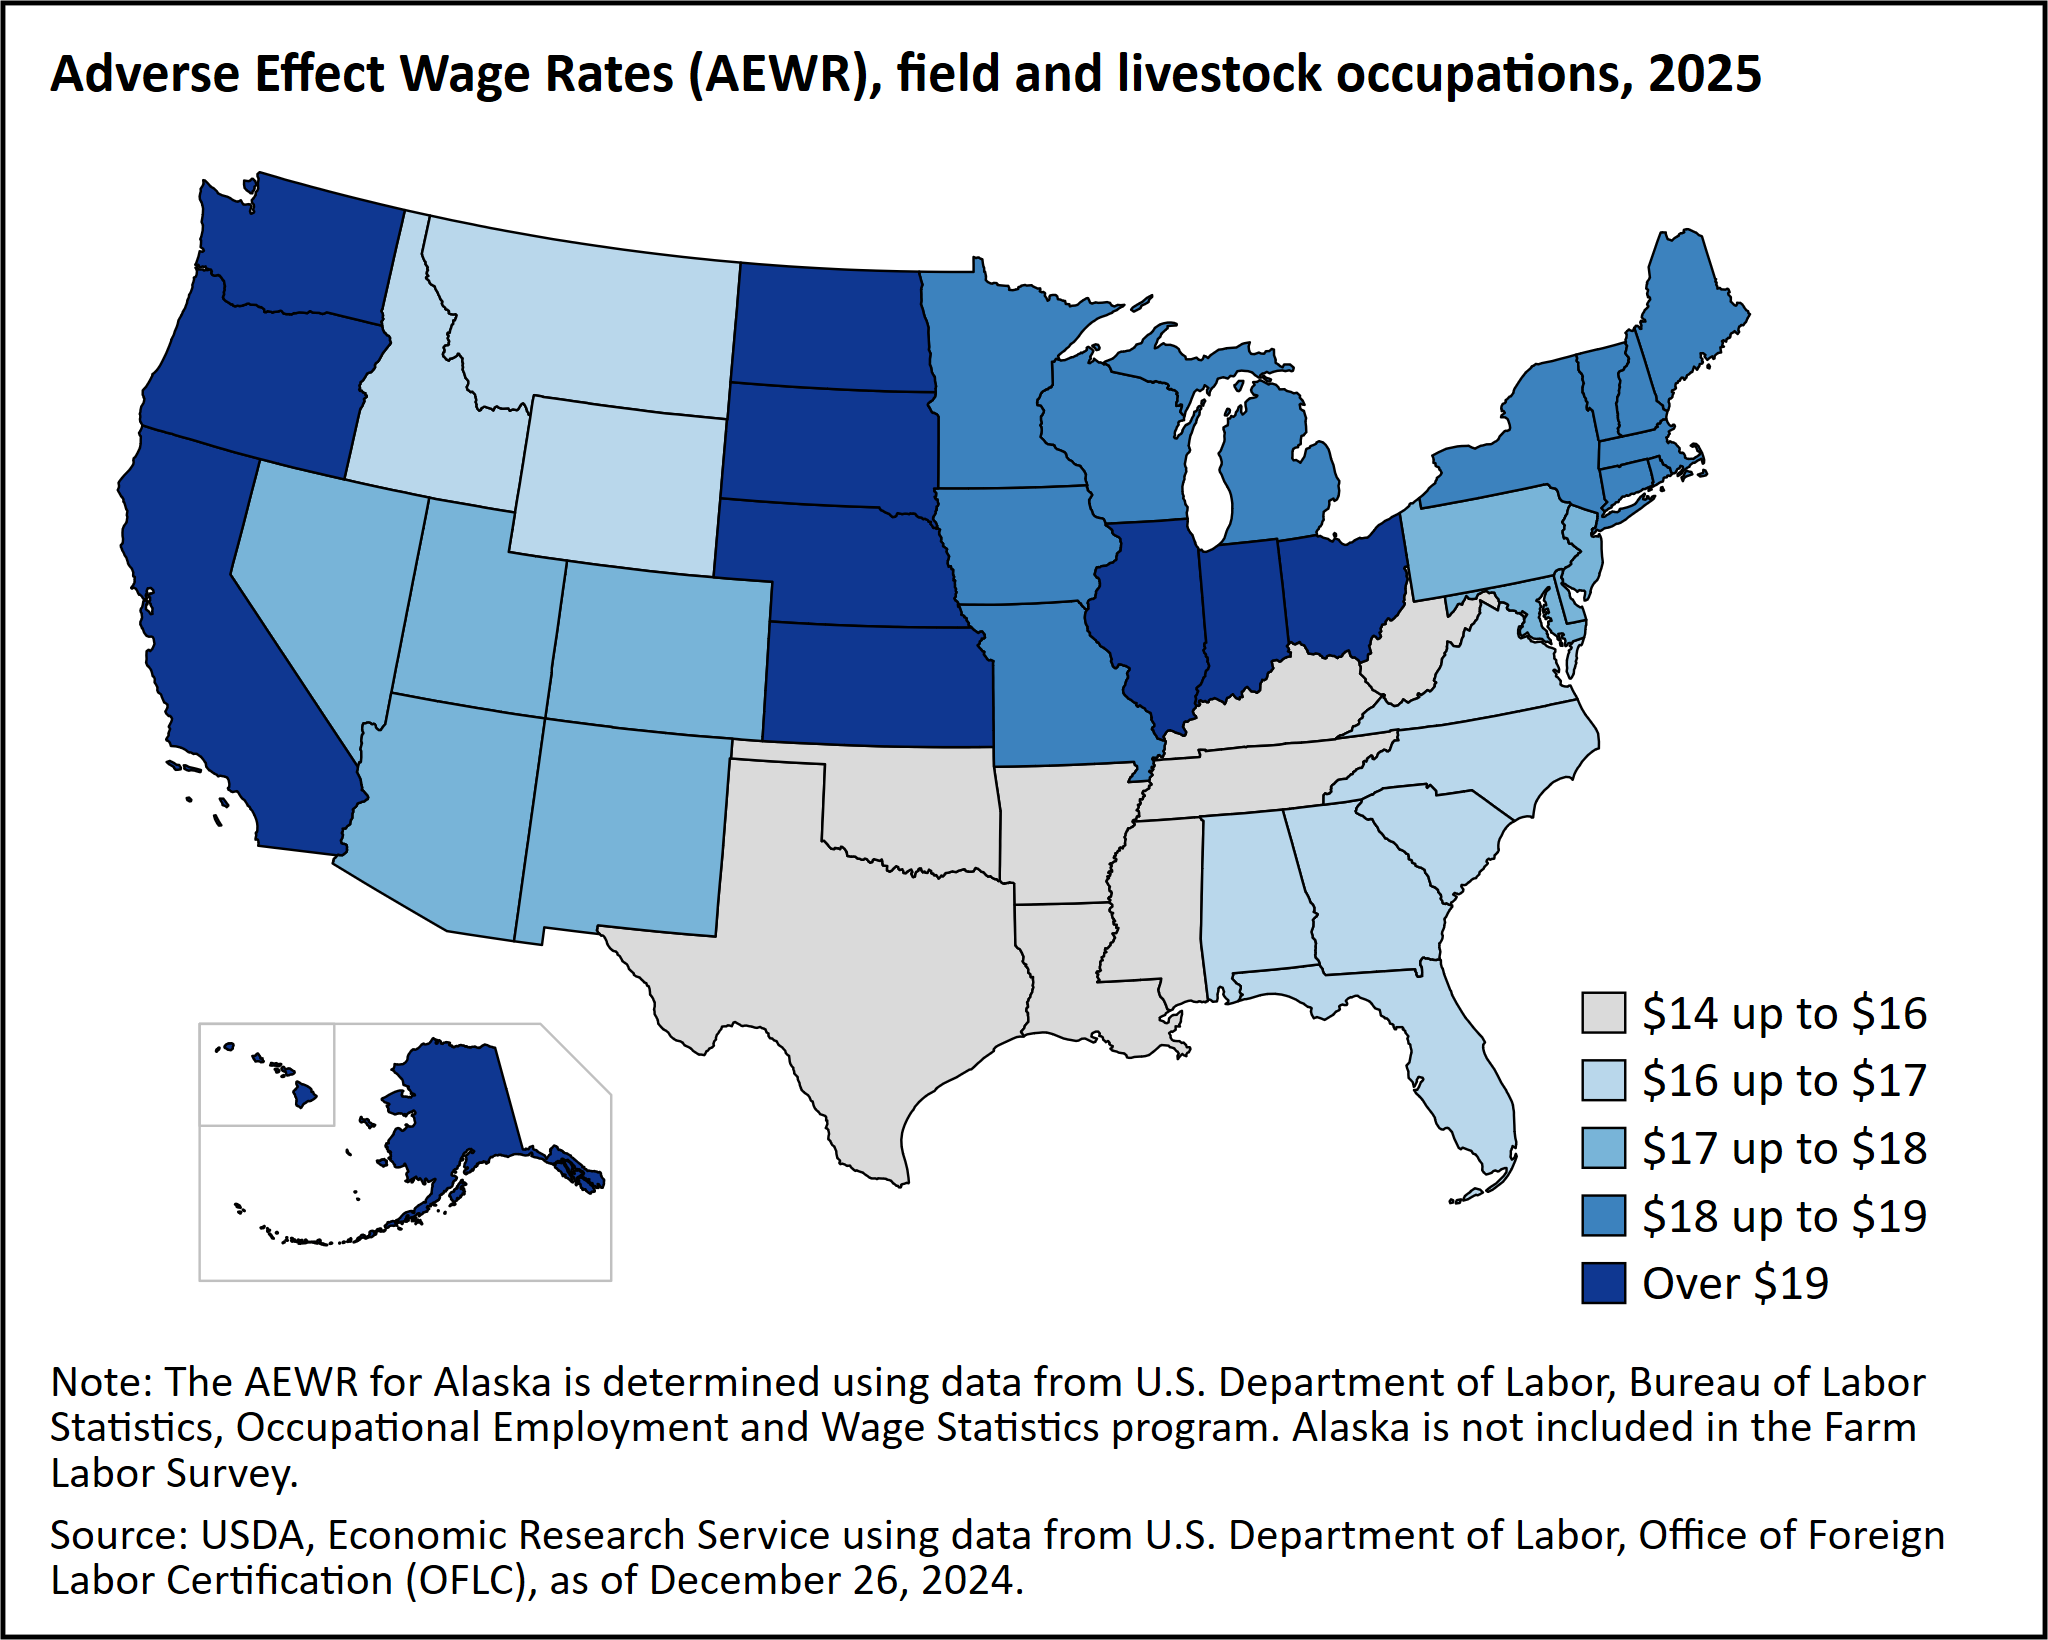
Adverse Effect Wage Rate
H-2A employers must pay no less than the higher of the applicable State or Federal minimum wage, the prevailing wage in that region and occupation, or the Adverse Effect Wage Rate (AEWR) specified by the U.S. Department of Labor. For field and livestock (non-range) jobs, which make up the vast majority of H-2A positions, the U.S. Department of Labor determines the AEWR using the regional average farm wage observed in the NASS FLS. For FY 2025, this minimum hourly wage ranged from $14.83 (Arkansas, Louisiana, and Mississippi) to $19.97 (California), $20.08 (Hawaii), and $22.23 (District of Columbia).
Legal Status and Migration Practices of Hired Crop Farmworkers
the legal immigration status of farmworkers is difficult to measure. Not many surveys ask workers about their legal immigration status, and unauthorized respondents may be reluctant to answer truthfully if asked. The U.S. Department of Labor’s National Agricultural Workers Survey (NAWS) provides data on farmworkers’ legal immigration status. NAWS data, believed to be of high quality, are gathered by trained and trusted enumerators who conduct face-to-face interviews with workers at their job sites and with their employers’ permission. NAWS also queries workers on their inter- and intranational-migration patterns. One limitation of the NAWS, however, is that NAWS excludes H-2A workers, as well as livestock workers.
Over Forty Percent of Hired Crop Farmworkers Lack Legal Immigration Status
The share of hired crop farmworkers who were not legally authorized to work in the United States grew from roughly 14 percent in 1989–91 to almost 55 percent in 1999–2001. In recent years, however, the share has declined to about 40 percent. In 2020–22, 32 percent of crop farmworkers were U.S. born, 7 percent were immigrants who had obtained U.S. citizenship, 19 percent were other authorized immigrants (primarily permanent residents or green-card holders), and the remaining 42 percent held no work authorization. The share of workers who are U.S. born is highest in the Midwest, while the share who are unauthorized is highest in California.

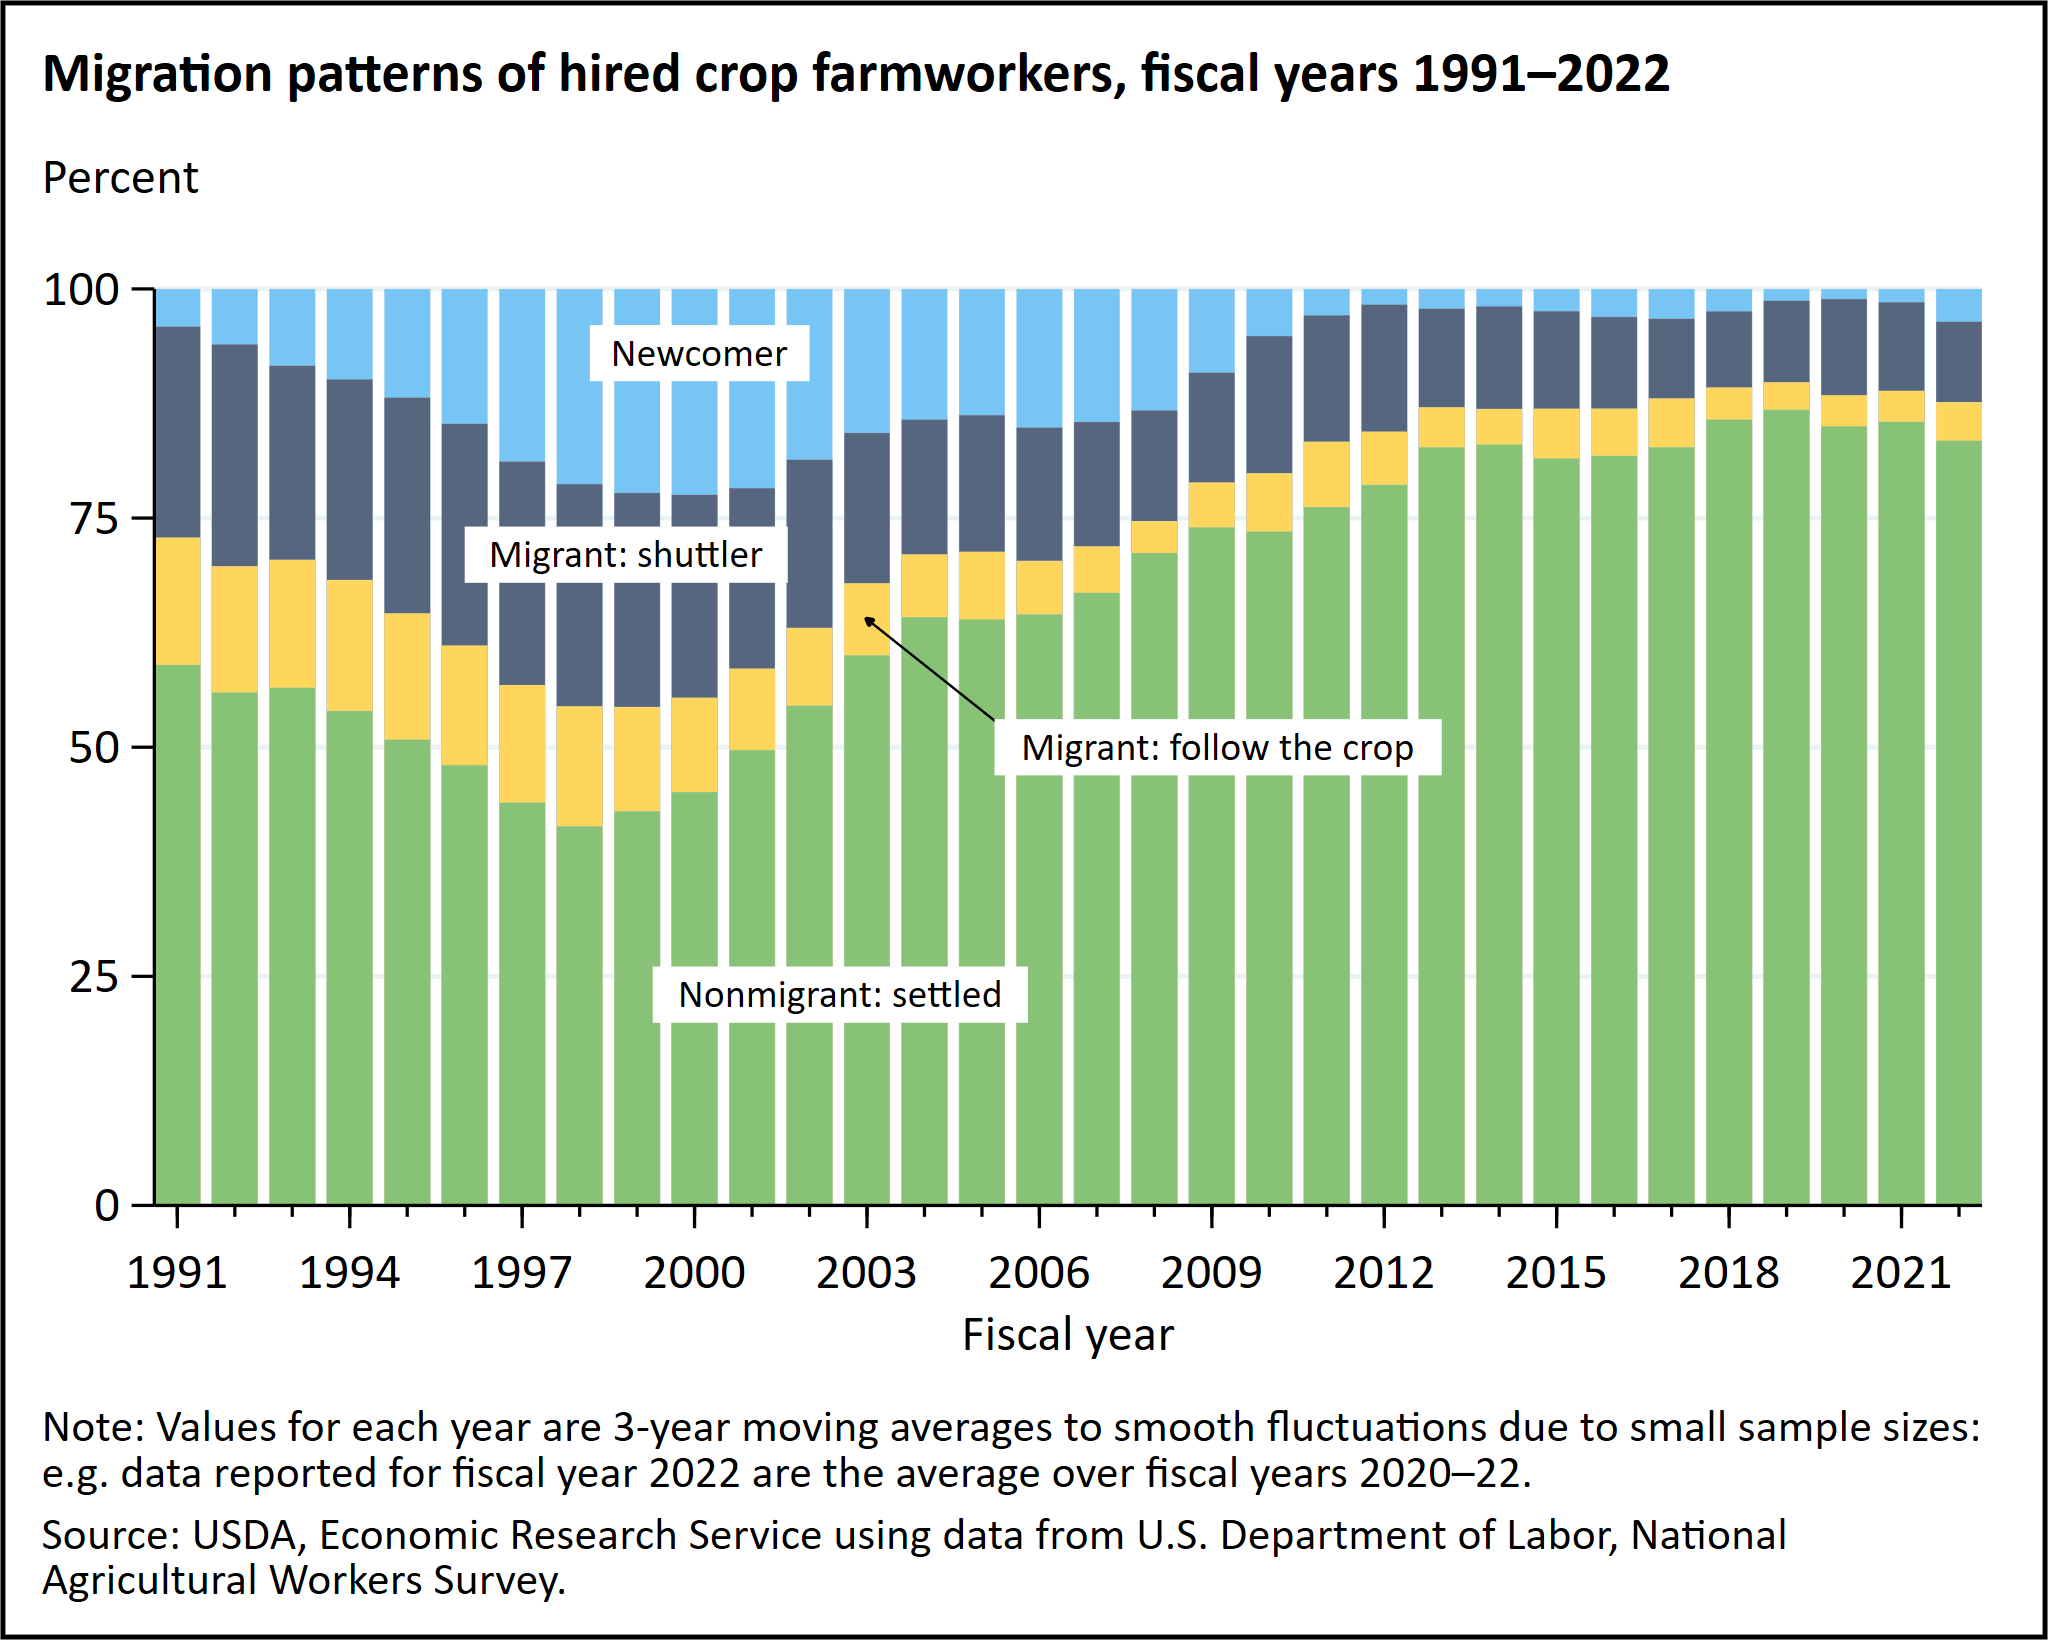
More Farmworkers Are Settled, Fewer Are Migrants
Eighty three percent of hired crop farmworkers are not migrant workers but instead are considered settled, meaning that the farmworkers work at a single location within 75 miles of their home. This share is up from 41 percent in 1996–98, reflecting a profound change in the nature of the crop farm workforce.
Among the small share of remaining migrant workers, the largest group is “shuttlers,” who work at a single farm location more than 75 miles from home and may cross an international border to get to their worksite. Shuttlers made up about 9 percent of hired crop farmworkers in 2022, down from about 24 percent in 1996–98.
More common in the past, the "follow-the-crop" migrant farmworker, who moves from State to State working on different crops as the seasons advance, is now a relative rarity. These workers made up just 4 percent of those surveyed by the NAWS in 2020–22, down from a high of 14 percent in 1992–94.
The final category of hired crop farmworkers is the newcomer to farming, whose migration patterns have not yet been established. The fact that newcomers now represent just 3.6 percent of the crop farm workforce, down from as much as 22 percent in 1998–2000, in part reflects the slowdown in net migration from Mexico to the United States since 2007.
Links to Key Data Sources
From the U.S. Department of Agriculture:
- Farm Labor Survey
The Farm Labor Survey (FLS) conducted by USDA’s National Agricultural Statistics Service (NASS) is based on semi-annual phone interviews with a random sample of farm employers (crops and livestock). The employers are asked to provide quarterly data on their wage bill, employment counts, and average weekly hours for all hired workers (by occupation). Contract labor is excluded and no demographic information on the workforce is collected. Each year, the FLS’s estimate of the annual average wage for nonsupervisory field and livestock workers in each of 18 regions is used as the basis for the following year’s Adverse Effect Wage Rate (AEWR) for field and livestock non-range occupations. The survey is described here, and its quarterly reports are archived here. Data and statistics can also be obtained via NASS Quick Stats. - Census of Agriculture
Every 5 years (years ending in 2 and 7), NASS conducts a full census of every farm in the country. Published statistics include national-, State-, and county-level tables on many topics—including land use and ownership, operator characteristics, production practices, income, and expenditures. Information on total employment (a simple head count, not adjusted for full-year or full-time equivalency) and labor expenditures (including contract labor) is also available. However, almost no demographic information on the hired farm work force is collected. The Census is described here. Published tables from the 2022 Census are here. Data from the Census of Agriculture can also be obtained via NASS Quick Stats. - Agricultural Resource Management Survey (ARMS)
ARMS, jointly administered by ERS and NASS, is an annual survey of roughly 30,000 farms. ARMS serves as the primary source of information on the U.S. farm businesses and the economic well-being of U.S. farm households—to include their financial condition, production practices, and resource use. The field-level phase collects information on production practices and costs (fertilizer, pesticide, labor, tillage, seed, etc.) for target commodities. The farm-level phase collects financial information for farm businesses and a variety of financial and demographic information (age, education, occupation, off-farm income, etc.) for farm operators and their households. The survey collects information from 48 States and is designed to represent the continental United States and to support State-level estimates for 15 key agricultural States. An online web tool permits the creation of various customized reports on farm structure and finance, and crop production practices.
From Other Agencies:
- National Agricultural Workers Survey (NAWS)
NAWS is conducted by the U.S. Department of Labor and is an employment-based, random-sample survey of U.S. crop workers (neither livestock workers nor H-2A workers are covered) that collects demographic, employment, and health data in face-to-face interviews. The NAWS is the source of estimates of legal immigration status of the Nation's crop farmworkers and is the basis for much of the research on farmworker health and well-being. Results are tabulated here, and the underlying microdata files are also available for public use. - American Community Survey (ACS)
The ACS is a rolling monthly survey that interviews more than 2 million households annually, collecting basic demographic, labor market, and income data. Results are released annually for the Nation, for States (with separate tallies for their metropolitan and nonmetropolitan components), and for large metro areas. Information on smaller geographic areas is released only for 5-year averages. Although the income questionnaire is less detailed than CPS, its larger sample size makes the ACS a more reliable measure of income and basic labor market outcomes for smaller geographic regions. Results are accessible using the Census data access site. Farmworkers may be identified using industry and occupation codes in the ACS Public Use Microdata (PUMS) files. - Bureau of Economic Analysis (BEA)
BEA synthesizes data from multiple sources to provide annual industry employment and earnings estimates at the national, State and county levels. Information is reported on: the number of farm proprietors, hired farmworkers, and both self-employed and hired workers in agricultural support services, and their earnings. BEA’s data on self-employment (employment of proprietors) are not comparable to data on self-employment from other sources, because the BEA’s data are not limited to those for whom self-employment is the primary activity. - Quarterly Census of Employment and Wages (QCEW)
The QCEW provides monthly estimates of employment and earnings for all industries but is limited to employers who are mandated to contribute to State unemployment insurance funds. Thus, the QCEW may exclude some smaller farm employers in States that do not have universal unemployment insurance coverage. The QCEW classifies farm employers by their primary product and then reports employment and earnings for all occupations employed in that industry at the national, State, and county levels. Some results are suppressed at lower levels of geography and finer industry detail to protect respondent anonymity.