
Aquaculture is the production of aquatic animals and plants living under controlled conditions for all or parts of their lifecycles. Aquaculture systems may be either freshwater or saltwater (marine). Producers may use water-based systems (e.g., pens, nets, or open sea cages), or land-based (e.g., artificial ponds, above-ground tanks, etc.). Interventions used in aquaculture farming can include seeding, stocking, feeding, and protection from predators. This process contrasts with the wild-caught fishery sector, which harvests aquatic animals from wild water sources. Several U.S. Government agencies, including the U.S. Department of Agriculture, publish data related to U.S. aquaculture markets.
U.S. Aquaculture Industry
The USDA, National Agricultural Statistics Service (NASS) Census of Aquaculture expands on the aquaculture data collected in the Census of Agriculture. The Census of Aquaculture provides information related to production methods, surface water acres and sources, inventory, sales, point of first sale, and distributed aquaculture.
According to the USDA, NASS 2023 Census of Aquaculture, total sales of U.S. aquaculture products rose to $1.908 billion (more than $1.964 billion in 2024 dollars), an increase of 3.8 percent from 2018, adjusted for inflation. In 2023, the number of U.S. aquaculture farms totaled 3,453—an 18-percent increase from 2018. It was the first time in 25 years that both farm numbers and total sales in the aquaculture industry had simultaneous upward movements from one census to the next.

Download chart data in Excel format.
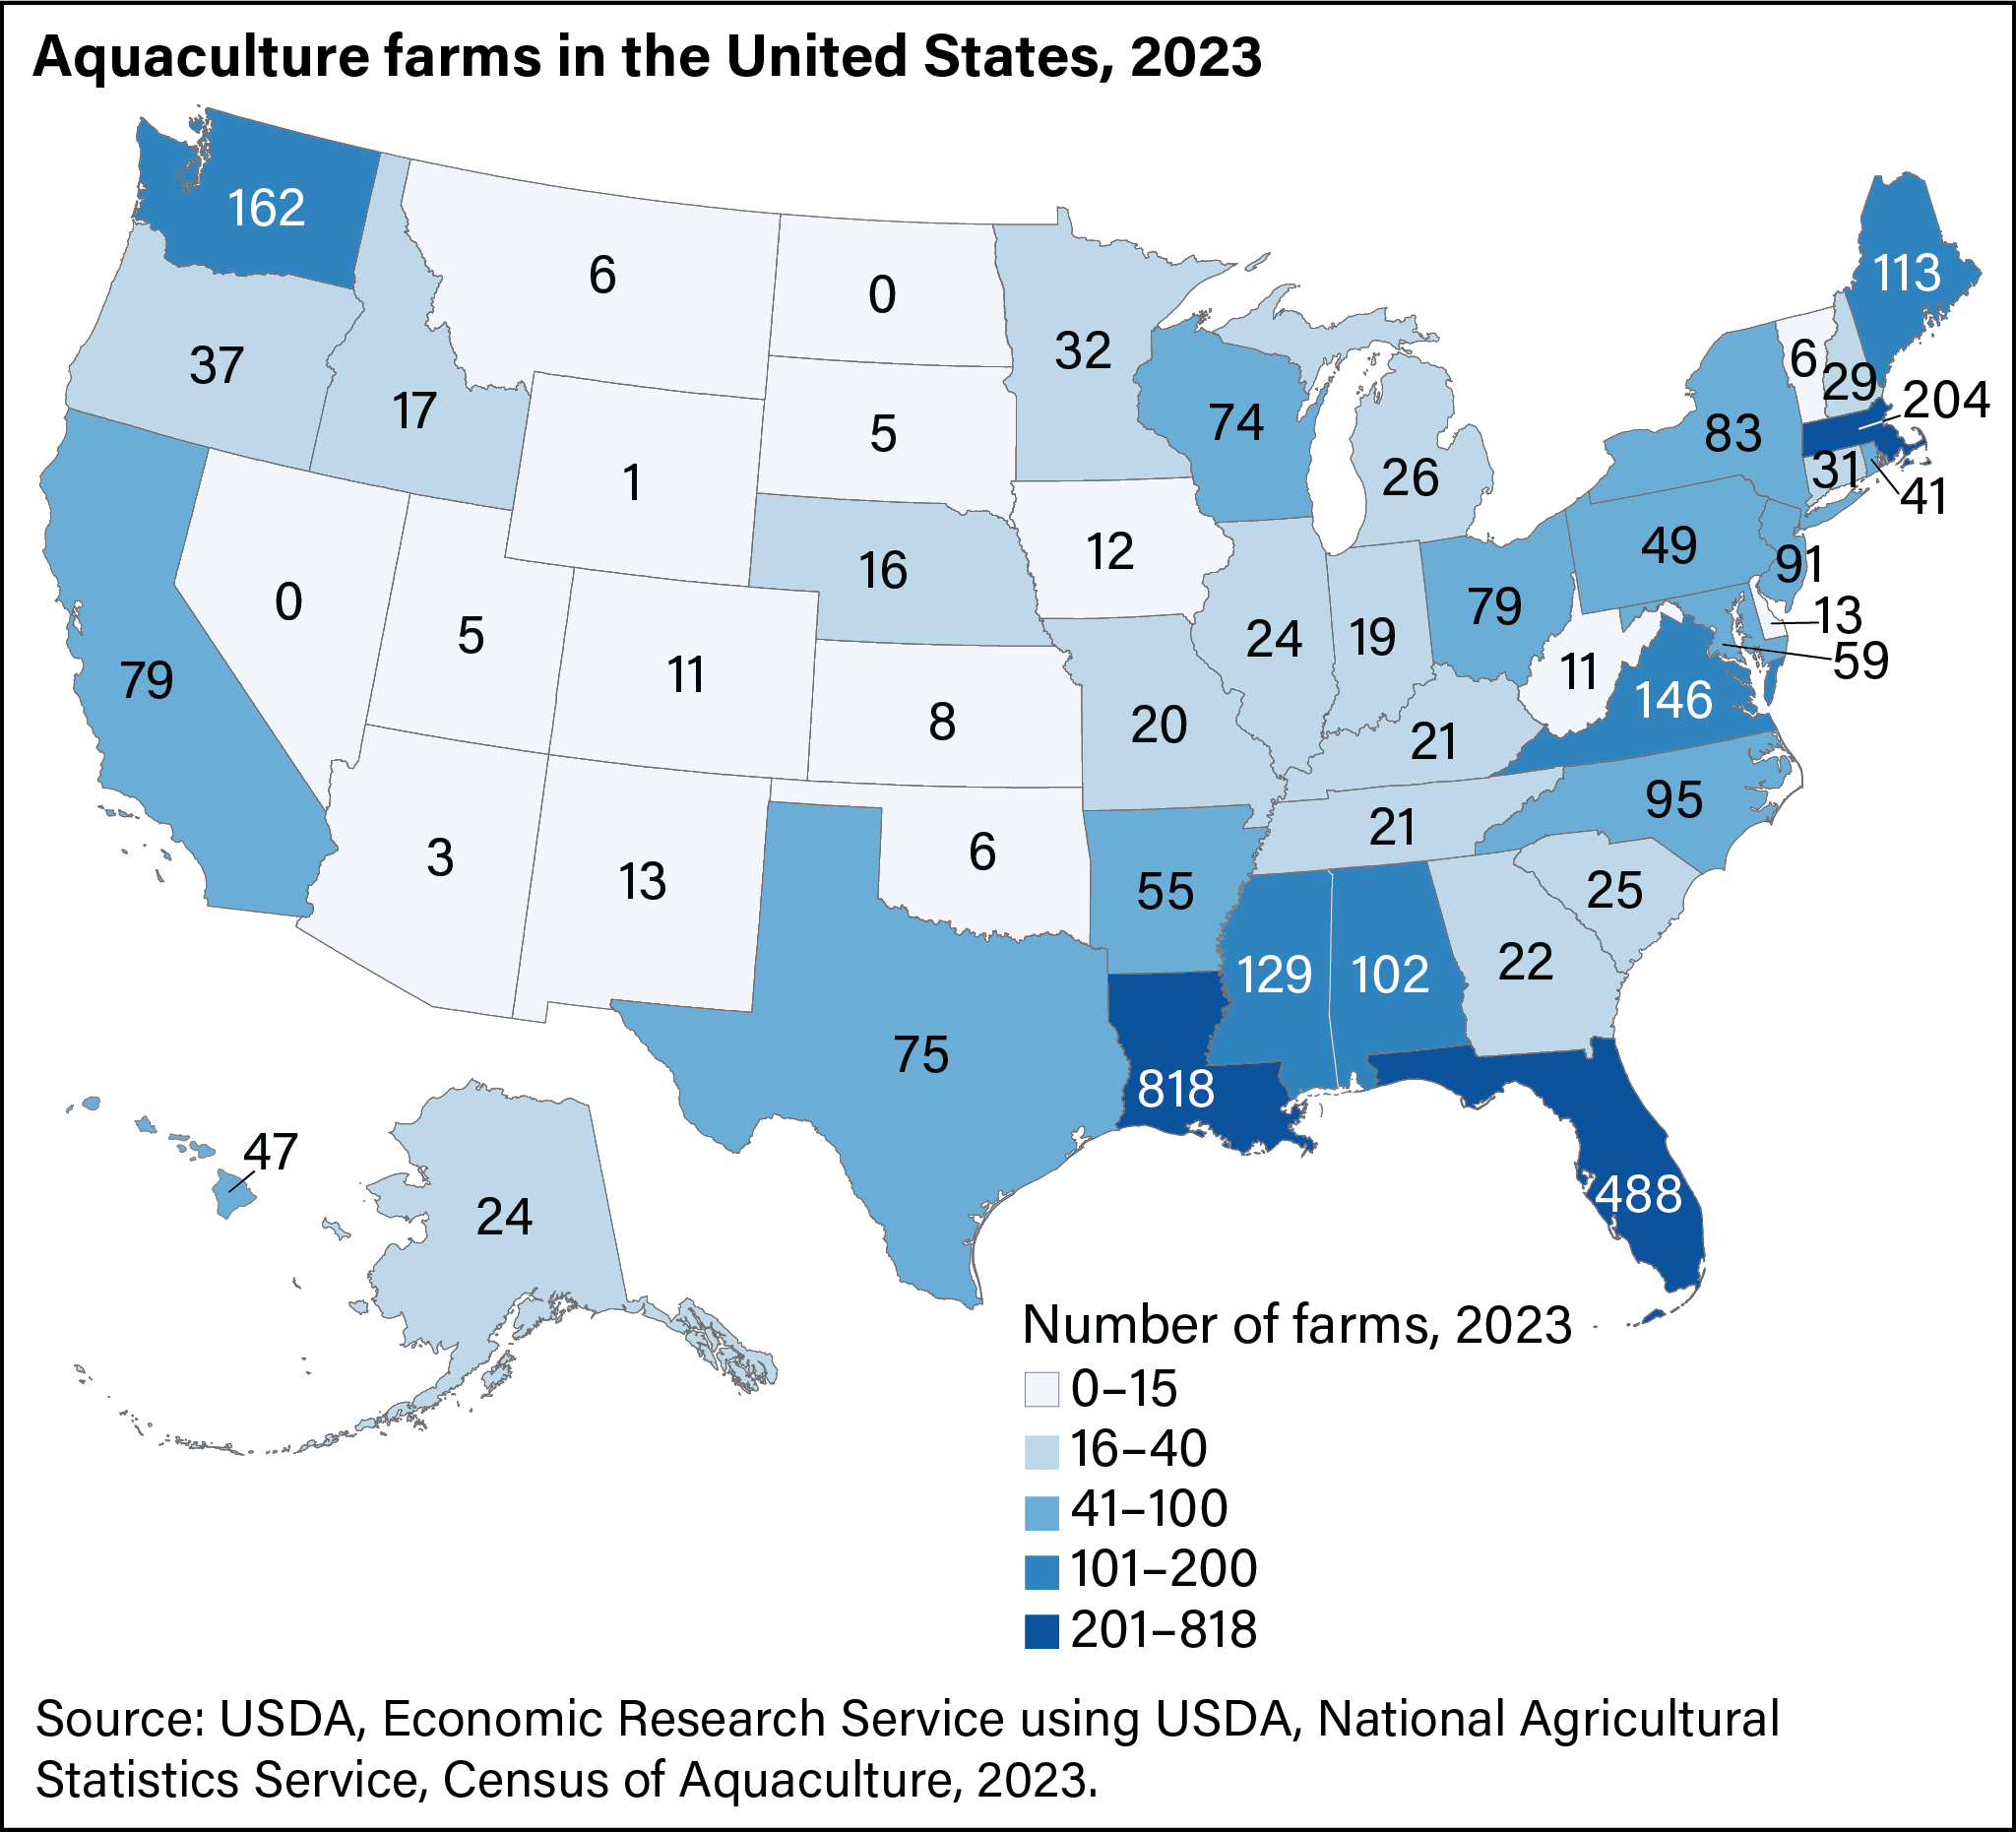
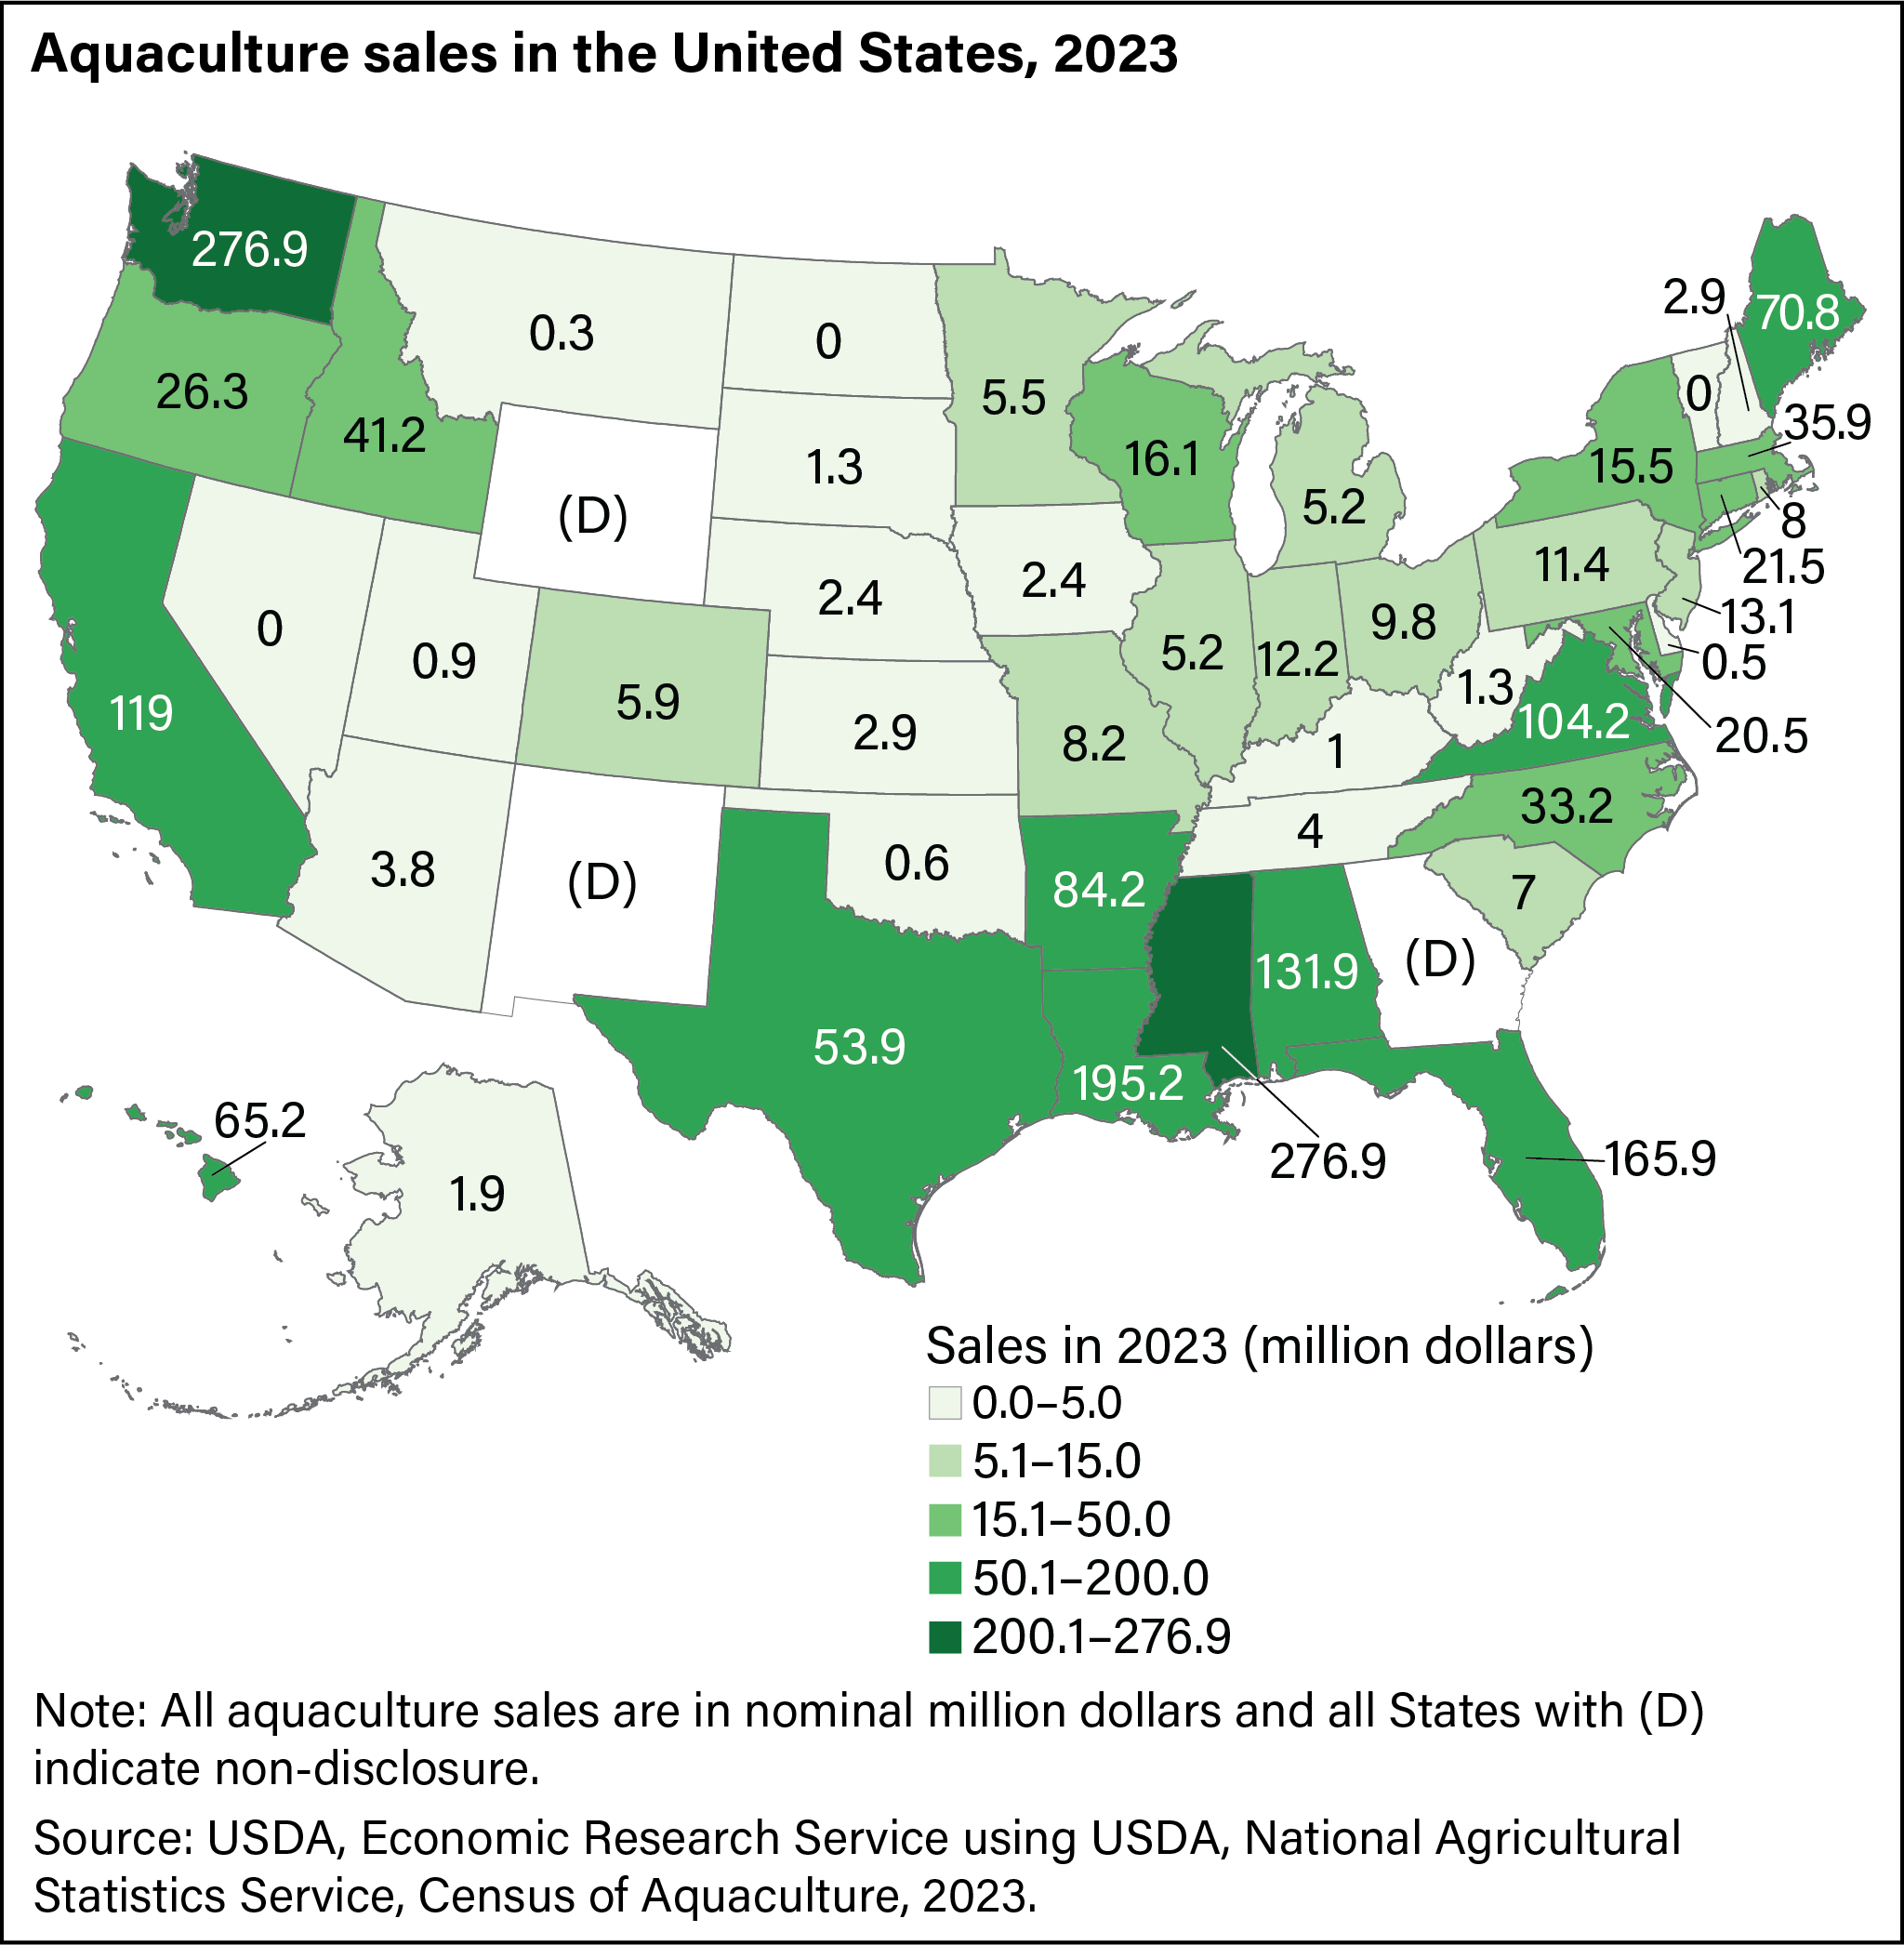
Geographically, in 2023, about half of the aquaculture farms were in the southeastern region of the United States. About 24 percent (818 farms) of U.S. aquaculture farms were in Louisiana. Aquaculture product sales in Louisiana ranked third among States totaling $195.24 million. Florida had the second-highest number of aquaculture farms in 2023 but ranked fourth in the value of aquaculture product sales, totaling $165.94 million. Mississippi had the highest aquaculture sales of $276.95 million but ranked sixth in number of farms. Washington had the second highest aquaculture sales of $276.89 million but ranked fourth in number of farms.
Download chart data in Excel format.
States with the largest aquaculture sales are displayed below. Sales generated from the top two States represented 28 percent of U.S. aquaculture sales, while the top five States accounted for 51 percent of all sales in 2018.
Download chart data in Excel format.
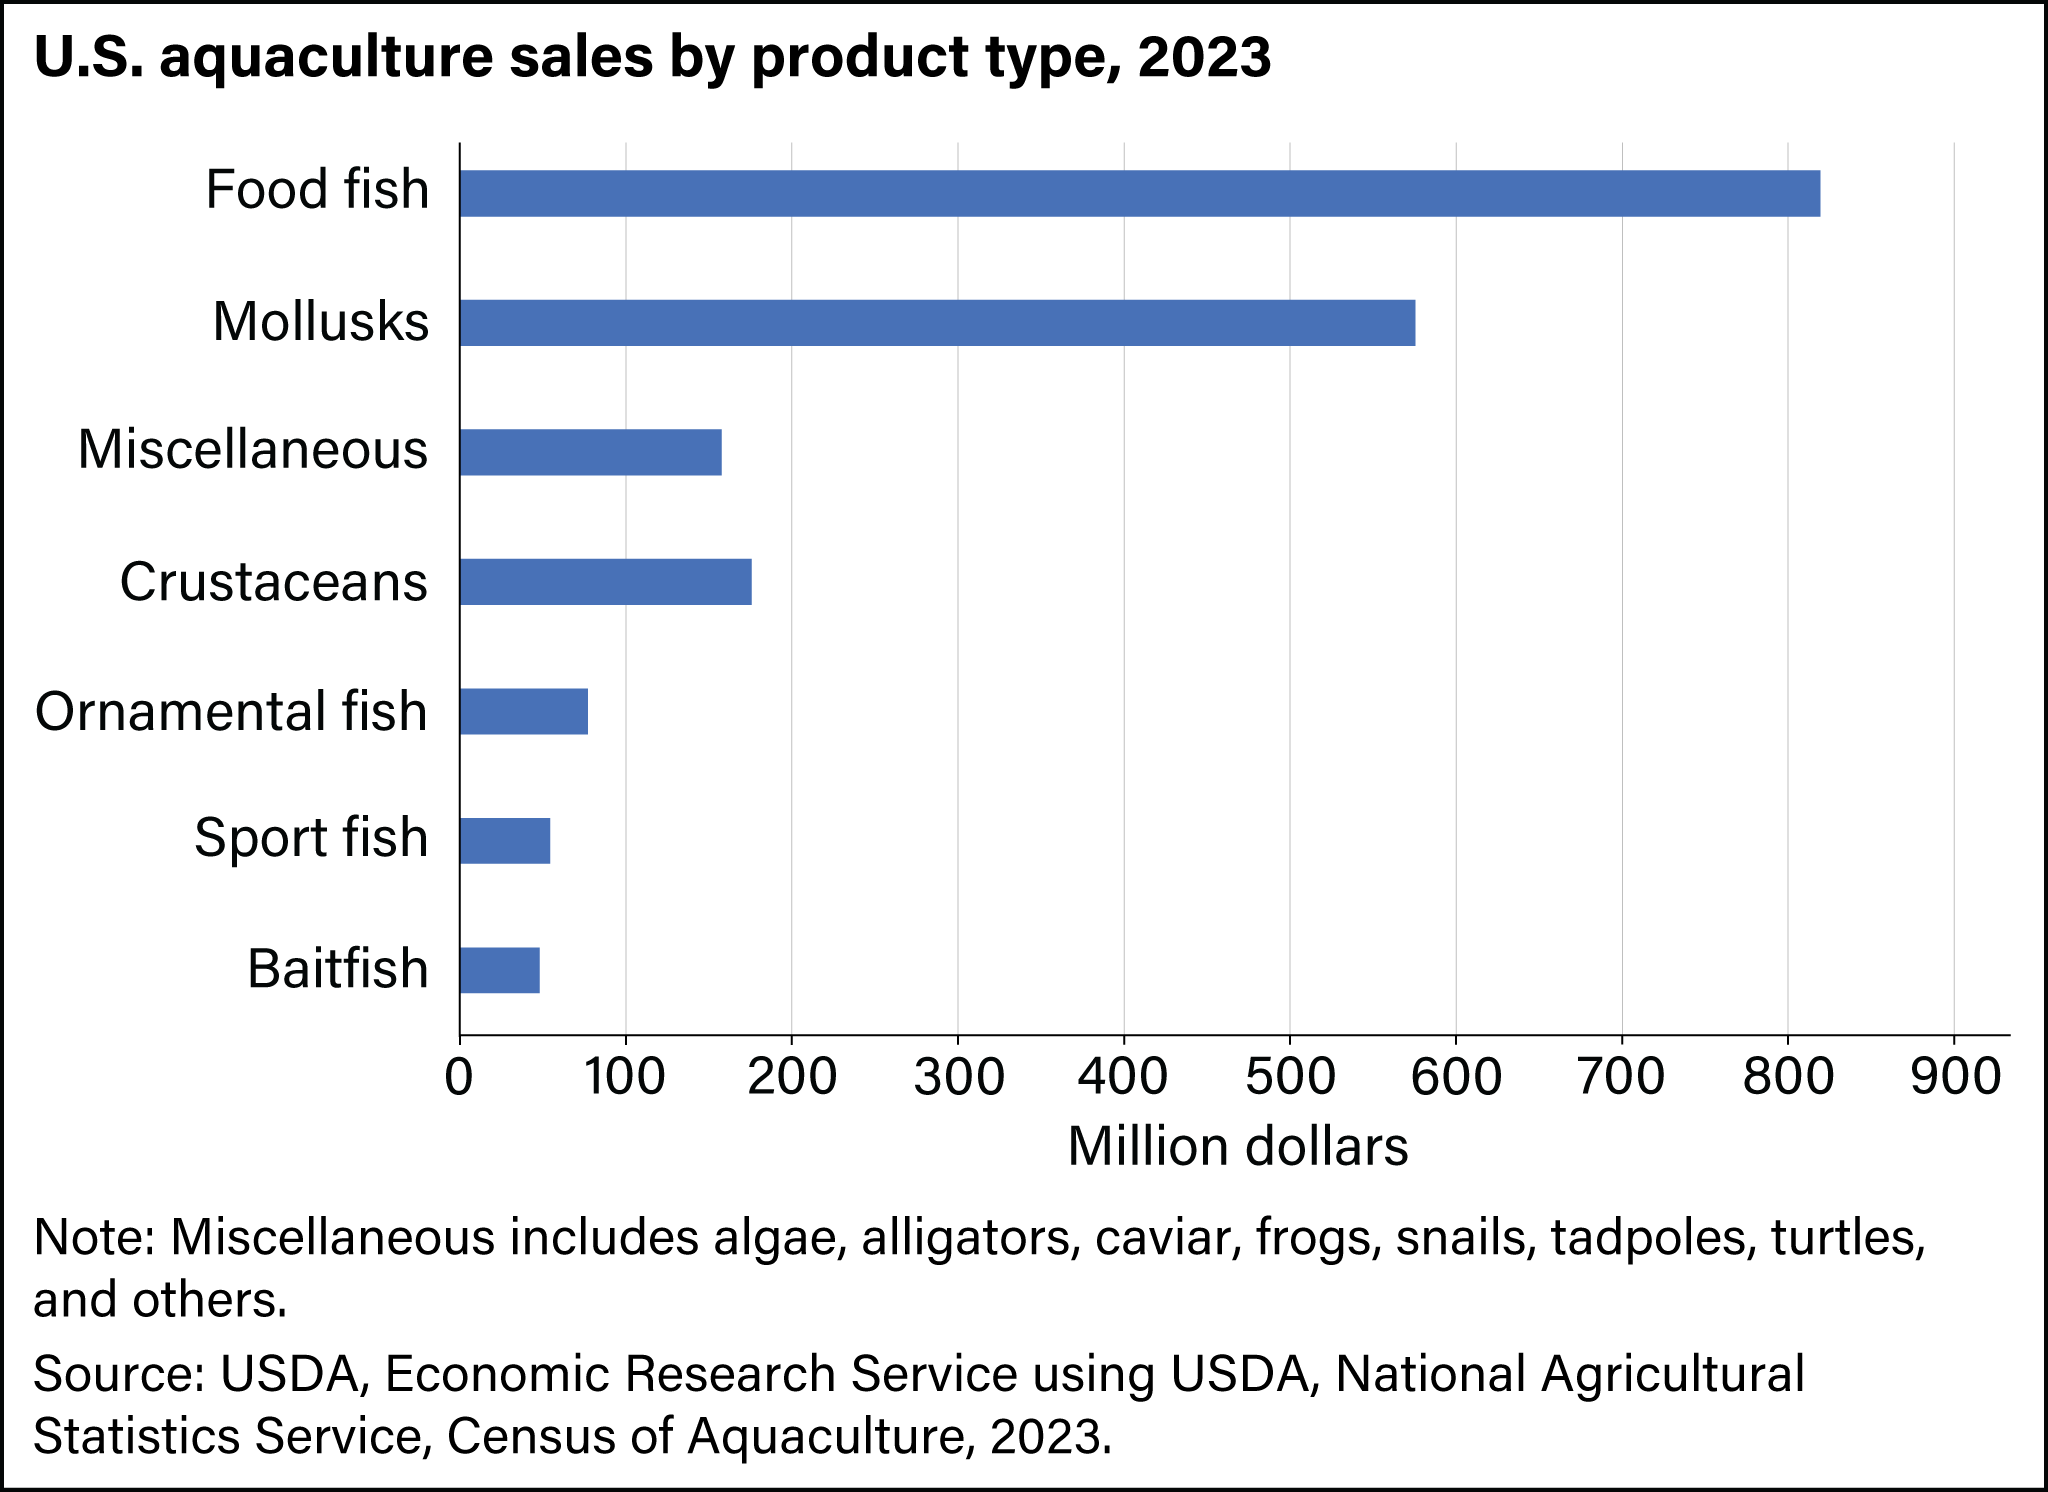
The following figure shows aquaculture sales by product type. In 2023, food fish (43 percent) and mollusks (30 percent) accounted for most U.S. aquaculture sales.
Download chart data in Excel format.
In addition to the Census of Aquaculture, USDA, NASS publishes information on catfish in its Catfish Production report twice a year and on trout annually in Trout Production. The Catfish Production report published in February includes water area, grower inventory, and sales numbers by size groups for major production States and the United States. The July issue contains water area and grower inventory.
U.S. Seafood Consumption
The U.S. Department of Commerce, National Oceanic Atmospheric Administration (NOAA), Fisheries Office of Science and Technology publishes estimates of the U.S. per capita consumption of seafood products, which includes consumption of products produced through both aquaculture and captive fisheries in both marine and freshwater. The per capita consumption calculation is based on a disappearance model, using data collected by U.S. Department of Commerce’s NOAA Fisheries. These data include the Annual Survey of Seafood Processors, USDA, NASS aquaculture production data, and imports and exports from the U.S. Department of Commerce, Bureau of the Census. According to NOAA, approximately 75 to 90 percent of U.S. seafood consumption comes from imported products. From 1990 to 2022, the demand for seafood has expanded and contracted as consumers’ tastes and preference for finfish and shellfish have changed. During this period, per capita consumption of seafood grew by 38 percent, reaching 20.8 pounds per person in 2022. The data presented in the chart below included both farm-raised and wild-caught products.

Download chart data in Excel format.
Global Seafood Trade
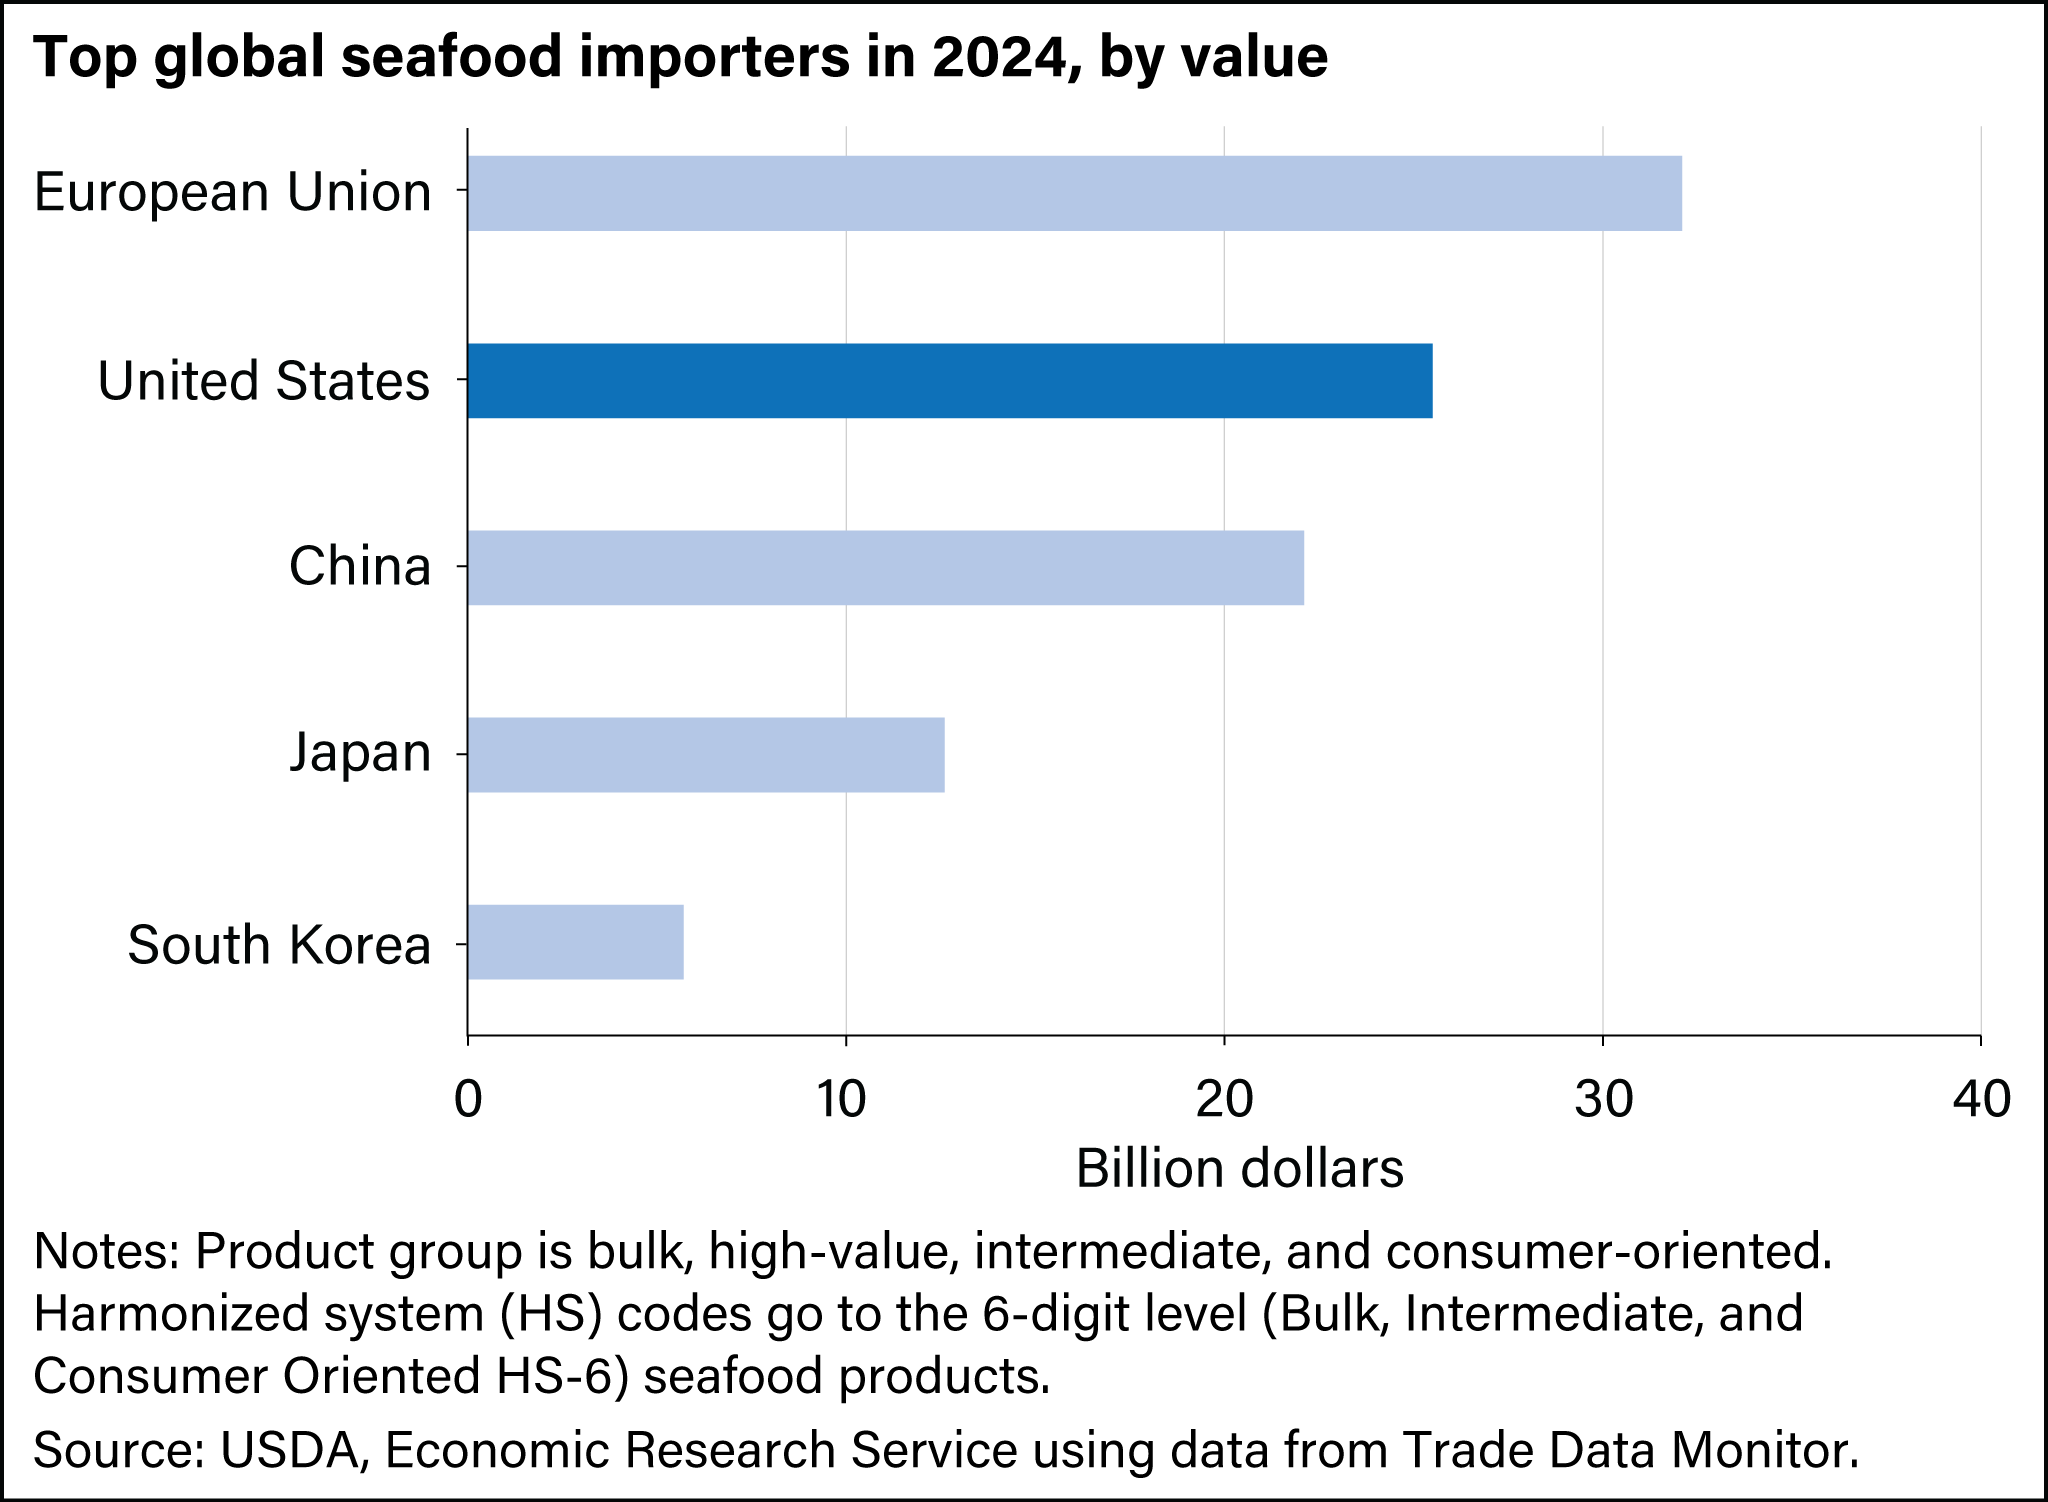
In this section, total trade sales of seafood products were displayed (instead of aquaculture-specific trade), because, for some products, trade data do not distinguish between farm-raised and wild-caught products. The European Union was one of the largest importers of seafood products in the world, totaling $32.1 billion. The second largest seafood importer was the United States at $25.5 billion. The following chart shows the top five importers by value of seafood products.
Download chart data in Excel format.
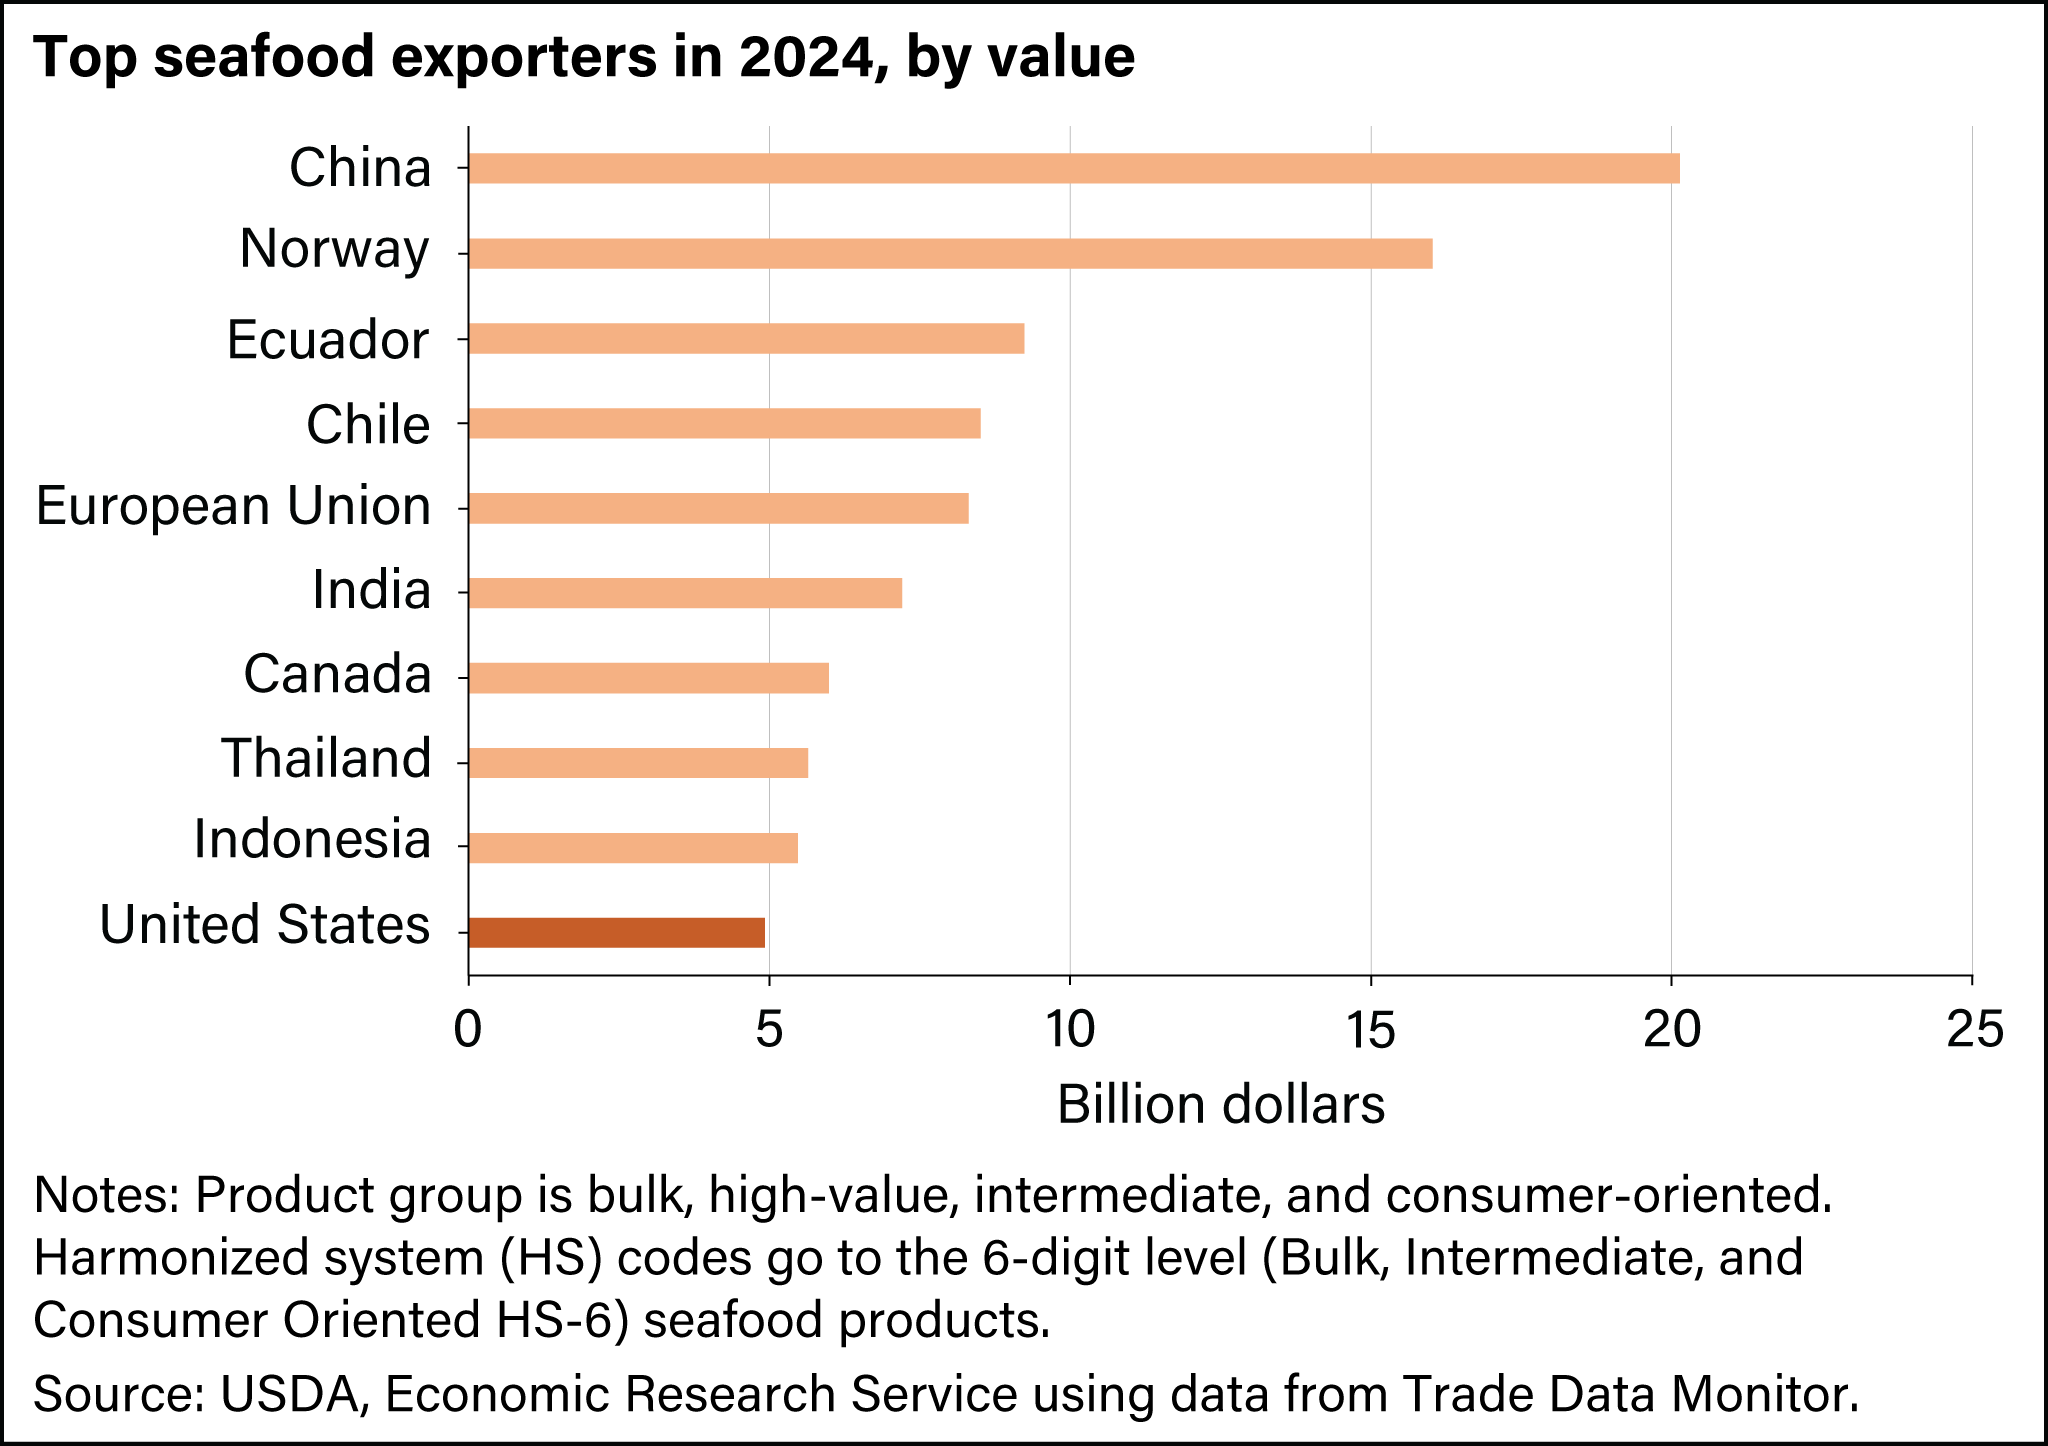
According to Trade Data Monitor, in 2024, China and Norway were the largest seafood exporters on a value basis. As of 2024, China was the world’s largest seafood exporter, supplying more than $20.1 billion of seafood products globally. Norway was the second leading seafood exporter at $16.0 billion in 2024—followed by Ecuador, Chile, the European Union, India, Canada, Thailand, and Indonesia. The United States ranked tenth in the world in value of seafood exported in 2024, with U.S. exports of $4.9 billion.
Download chart data in Excel format.
U.S. Seafood Trade
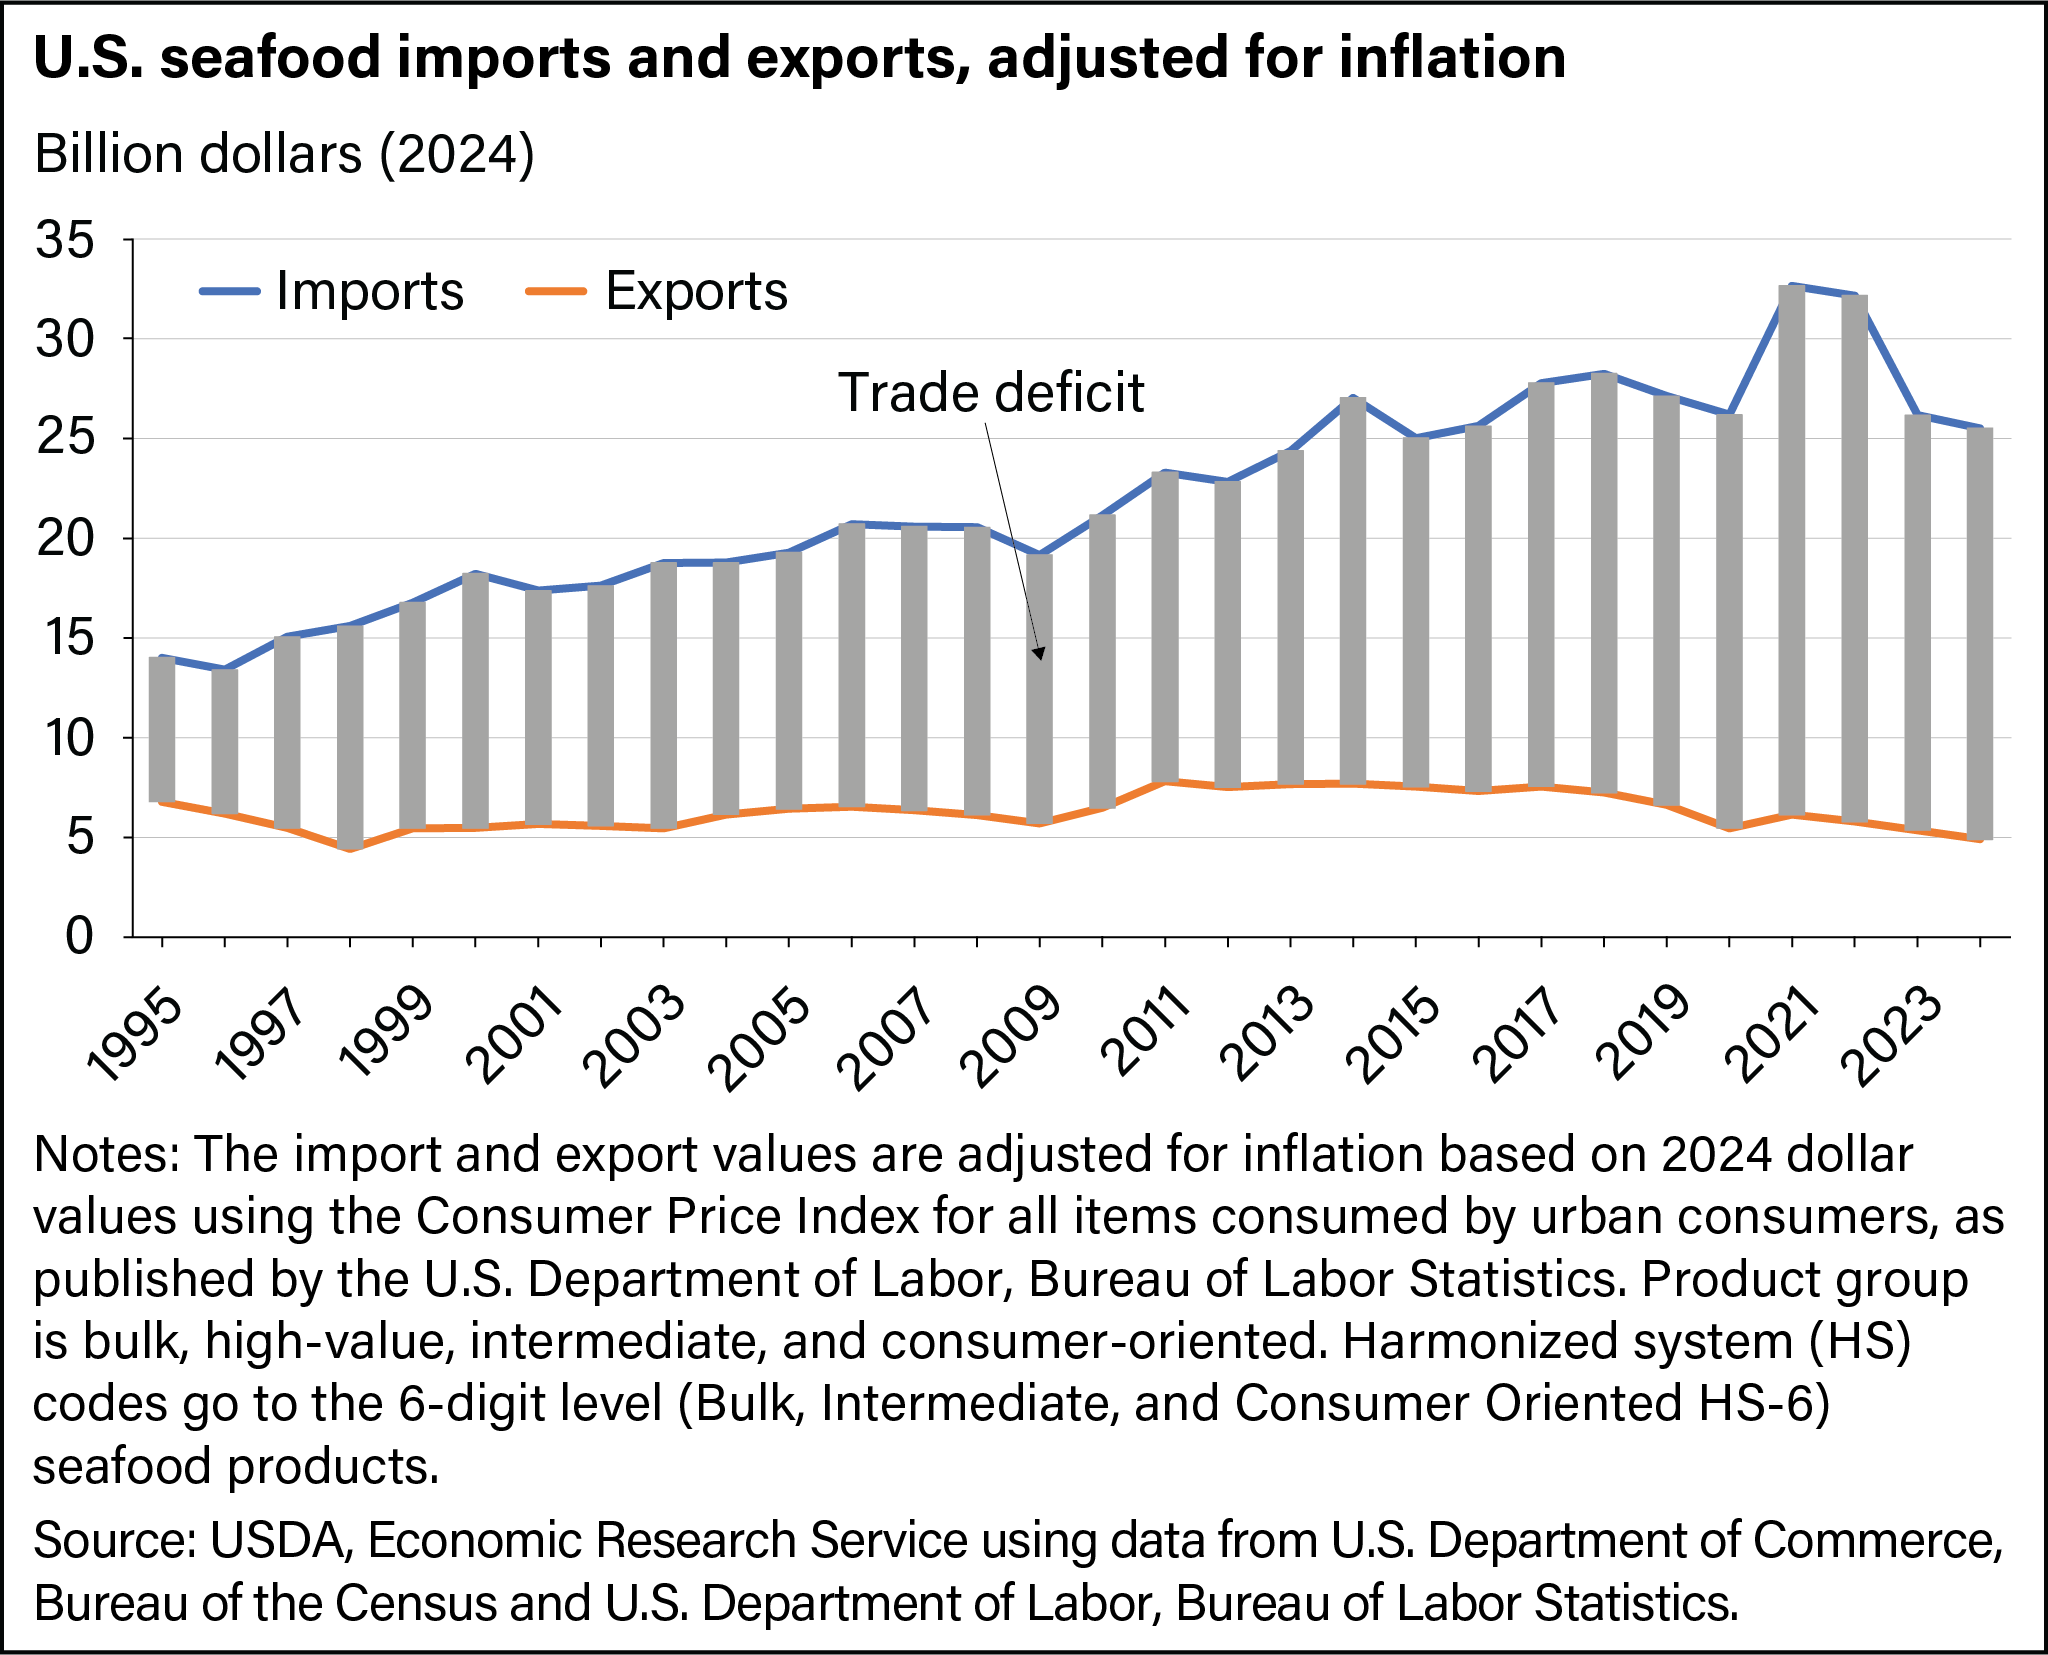
The value of U.S. seafood imports, adjusted for inflation, has mostly trended upward since 1995. The top 5 seafood suppliers to the United States (Canada, Chile, India, Indonesia, and Vietnam) accounted for 52 percent of total U.S. import expenditures on seafood in 2024. The highest seafood import values for the United States occurred in 2021 and 2022.
In 2024, U.S. seafood exports totaled $4.9 billion. Since 1995, the value of U.S. seafood exports (adjusted for inflation in 2024 dollars) has ranged from a low of $4.4 billion in 1998 to a high of $7.8 billion in 2011. Most of the seafood products exported over last 6 years went to 5 top destinations (Canada, China, Japan, Netherlands, and South Korea) accounting for 68 percent of U.S. total exports in 2024.
From 1995 to 2024, the inflation-adjusted value of U.S. seafood exports dropped by approximately 28 percent, while imports expanded by 82 percent, bringing about an increasing trade deficit for seafood products. In 2024, the United States had a seafood trade deficit of $20.6 billion. The two largest trade deficits in the past 30 years were recorded in 2021 ($26.5 billion) and 2022 ($26.4 billion), with all calculations based on 2024 dollars.
Download chart data in Excel format.
Aquaculture Policy
The National Aquaculture Act of 1980 provides the Federal authority for supporting the U.S. aquaculture industry. The act directed the establishment of a statutory multiagency subcommittee on aquaculture, now known as the Subcommittee on Aquaculture (SCA), which is directed by the U.S. Office of Science and Technology Policy. Additionally, the act directed the SCA to develop and implement the National Aquaculture Development Plan (NADP), which was first published in 1983. Members of the SCA include many U.S. Government offices and agencies, including USDA’s Economic Research Service.
On May 7, 2020, Executive Order 13921 called for an update of the 1983 NADP, to be overseen by a task force established by the SCA. The updated NADP consists of three parts: the National Strategic Plan for Aquaculture Research and the Strategic Plan to Enhance Regulatory Efficiency in Aquaculture, both published in 2022, and the National Aquaculture Economic Development Plan (NAEDP) published in December 2024. The NAEDP outlines actions that Federal agencies plan to take within their existing statutory authorities and budgetary resources to support the domestic aquaculture sector.
On April 17, 2025, Executive Order 14276, entitled Restoring American Seafood Competitiveness, was signed, building upon the May 7, 2020 order. The new order aims to introduce strategies for regulatory reform, trade competitiveness, and promotion of U.S. fishery and aquaculture products.
For more information, see:
USDA, National Agricultural Statistics Service, 2023 Census of Aquaculture
Executive Order 14276, published April 17, 2025
Executive Order 13921, published May 7, 2020
Subcommittee on Aquaculture - This webpage includes links to:
- National Aquaculture Development Plan Overview
- Strategic Plan for Aquaculture Economic Development
- National Strategic Plan for Aquaculture Research
- Strategic Plan to Enhance Regulatory Efficiency in Aquaculture
- Guide to Federal Aquaculture Programs and Services
- Federal Aquaculture Fact Sheet Series
National Aquaculture Act of 1980
U.S. Seafood Market Shifts to Aquaculture
U.S. Department of Commerce, National Oceanic and Atmospheric Administration (NOAA), Landings Data (includes Per Capita Consumption)
