Note: Updates to this data product are discontinued.
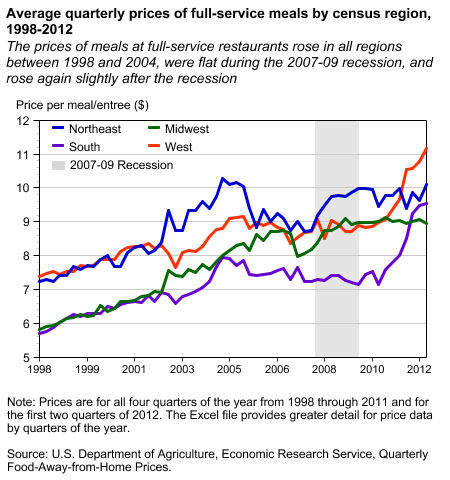
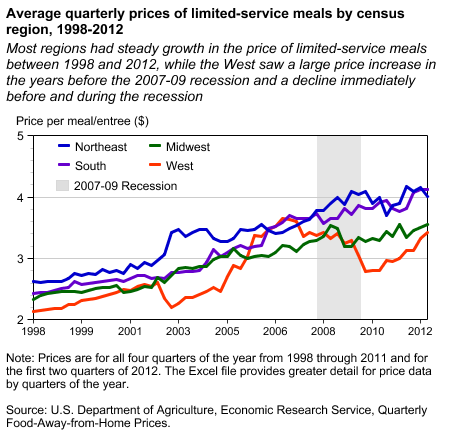
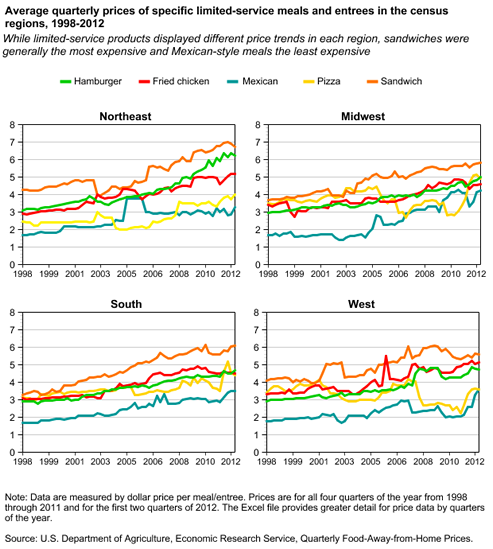
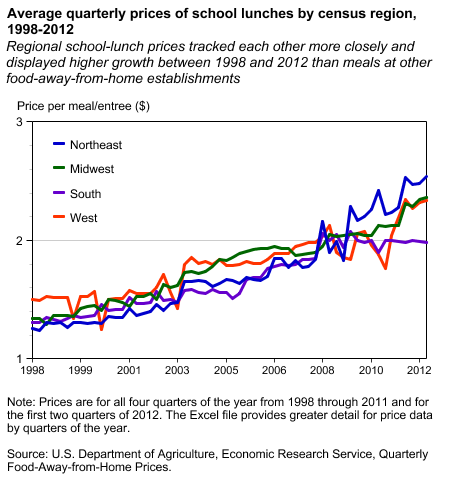
The Quarterly Food-Away-From-Home Prices (QFAFHP) data set provides price data for food away from home and alcohol, both at home and away from home, and supports analyses on a variety of topics, such as how demand varies across establishment types (full- vs. limited-service restaurants), across specific foods (hamburgers vs. sandwiches), and across regions (West vs. South). This page presents the following charts:
- Average quarterly prices of full-service meals by census region, 1998-2012
- Average quarterly prices of limited-service meals by census region, 1998-2012
- Average quarterly prices of specific limited-service meals and entrees in the census regions, 1998-2012
- Average quarterly prices of school lunches by census region, 1998-2012