
Farm income forecasts are updated three times each year, and historical estimates are revised as needed to reflect newly available administrative and survey data, or when estimation procedures are revised. For information on the administrative and survey data used in the Farm Income and Wealth Statistics data product, see general documentation as well as documentation on cash receipts, the balance sheet, and financial ratios. Below is a brief description of the routine revision process for USDA farm income and balance sheet forecasts and an explanation of revisions to the historical income and balance sheet estimates. See FAQs for more on what additional information is included in each successive release.
Updates and revisions to data (available in U.S. and State-level farm income and wealth statistics) as of February 6, 2025.
February 6, 2025
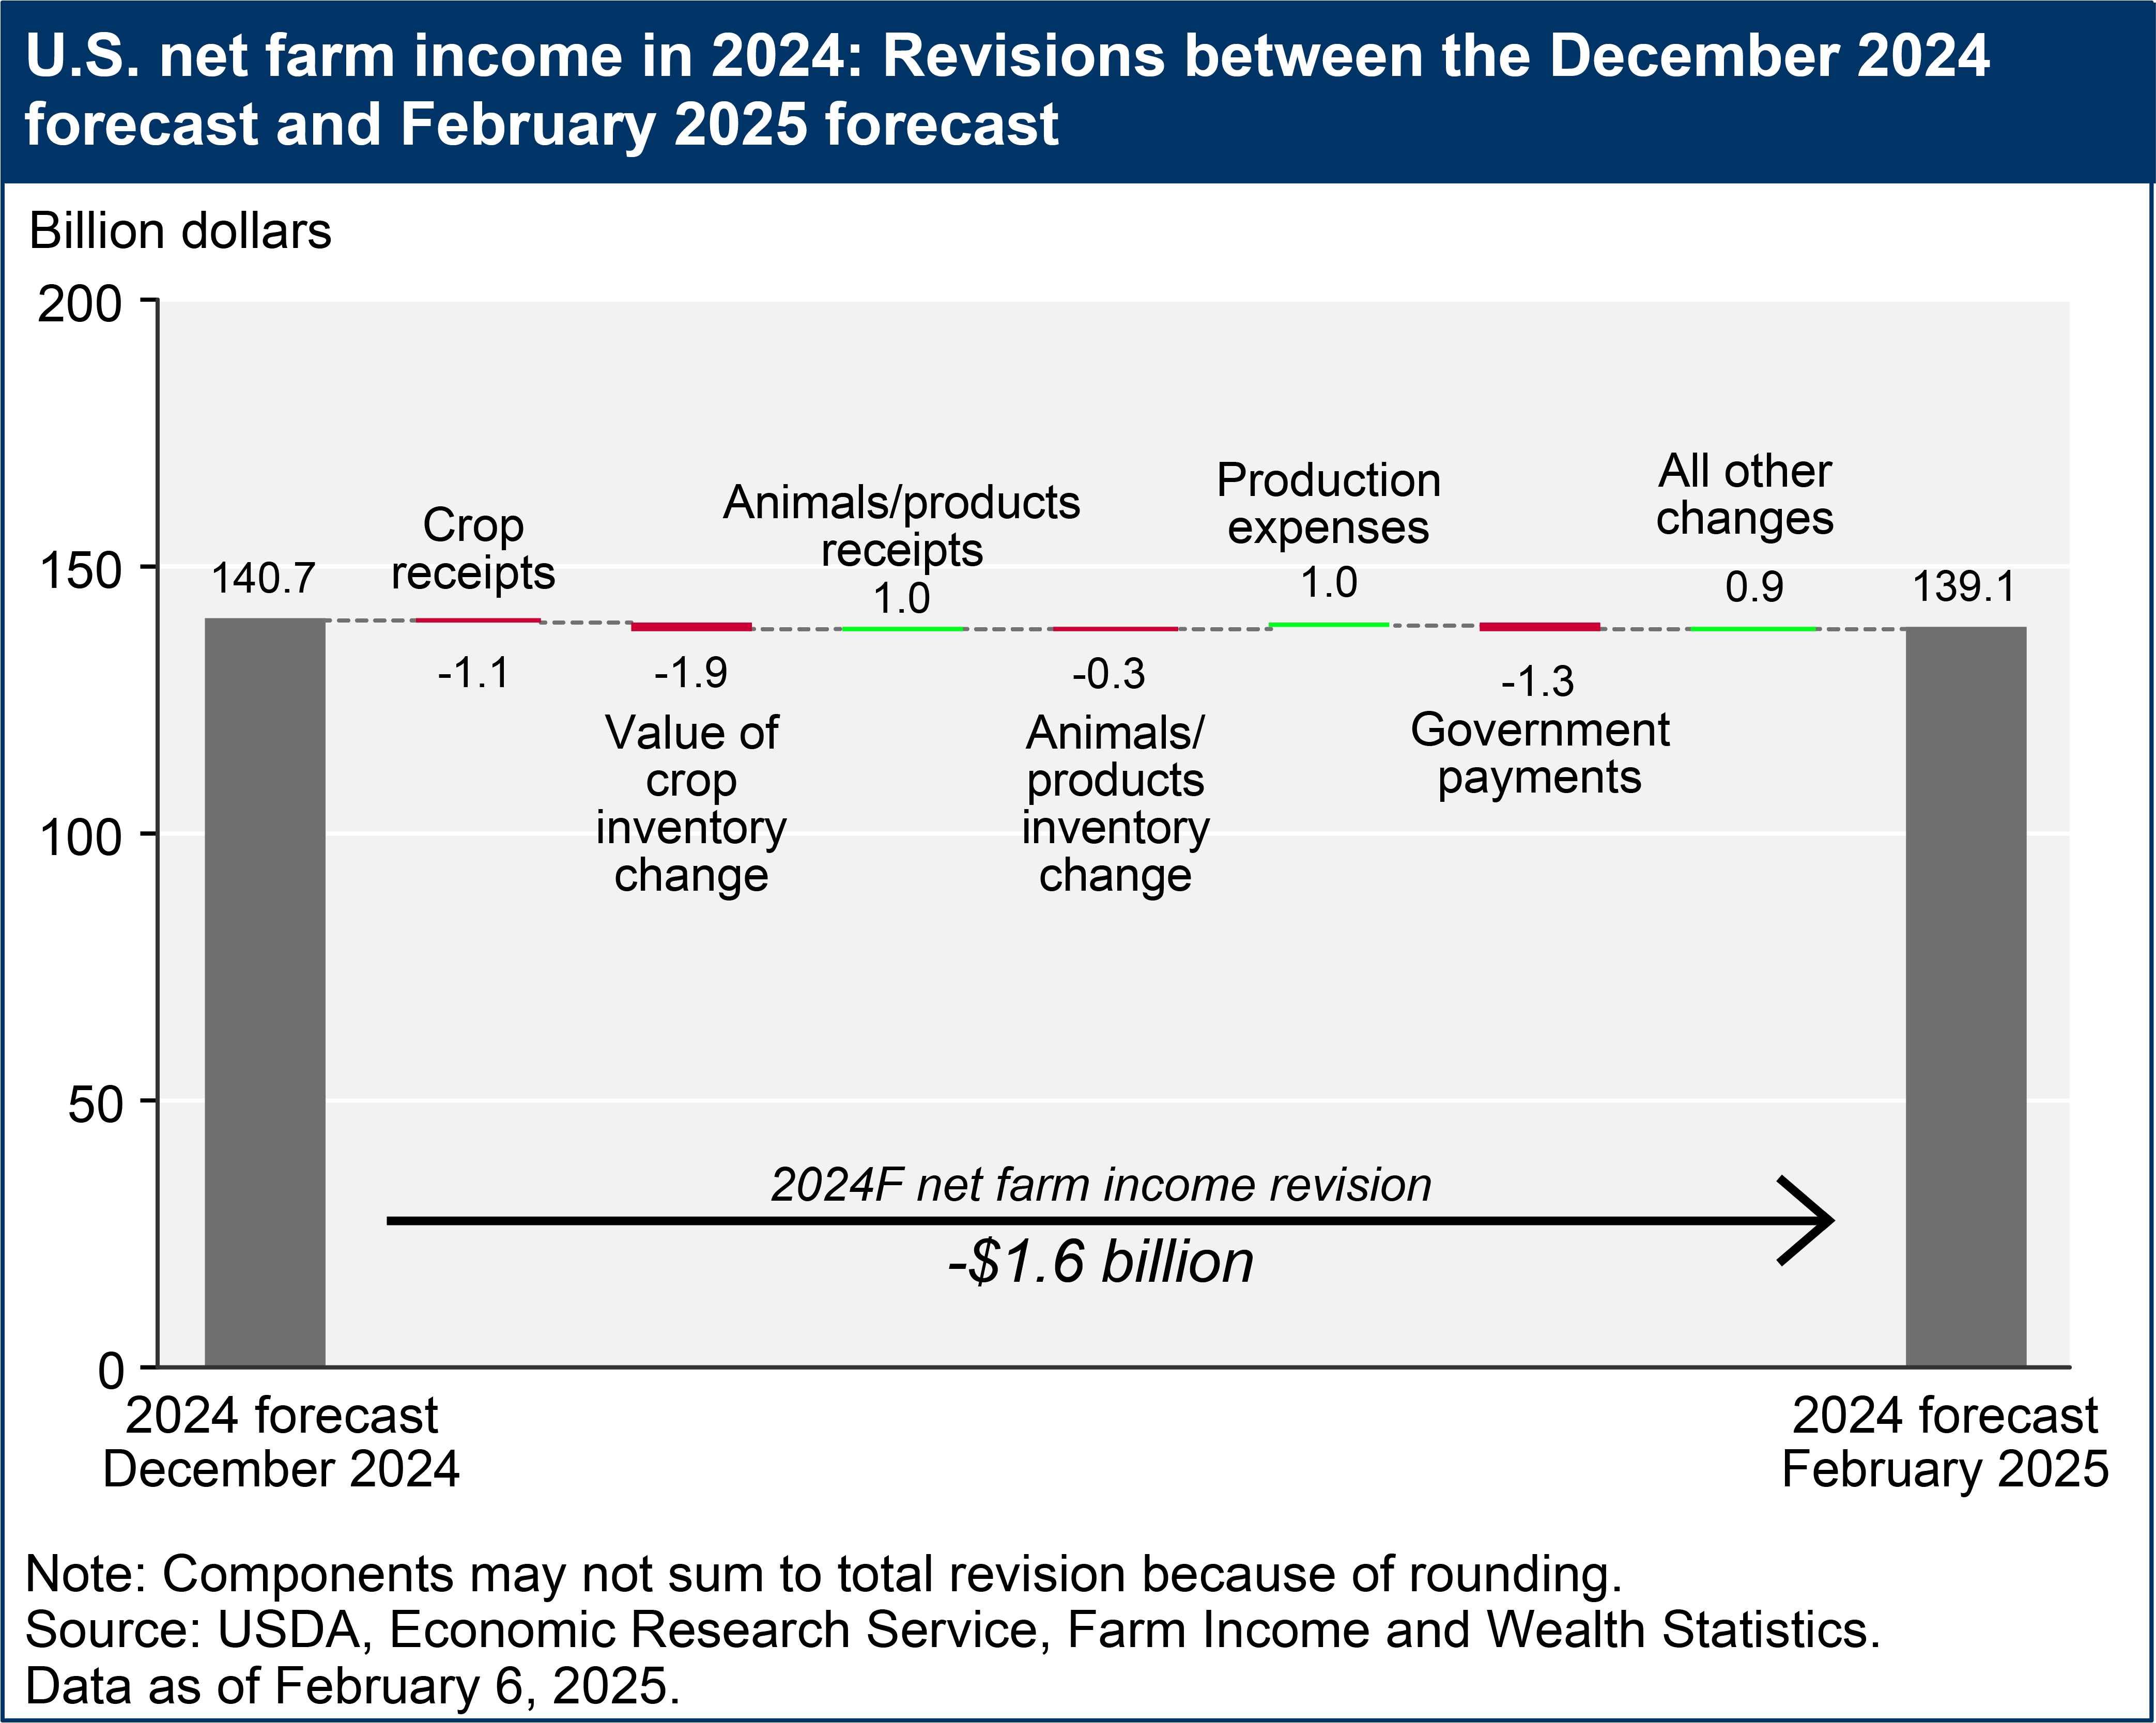
The February 2025 release of the 2024 farm income forecast is the third and final revision of the 2024 forecast. The February release also revised the estimates for previous years. Forecast and estimates incorporate additional information that has become available since the December 2024 release. The chart below shows the revision to the 2024 net farm income forecast by major component of income.
Download chart image | Chart data
In addition to the adjustments to the 2024 forecast, some estimates for 2023 were revised utilizing new data from USDA, National Agricultural Statistics Service (NASS) on the percentage of crop sales marketed by month. Corn receipts were revised downward $3.9 billion (4.9 percent), as these data showed that a smaller share of crop year 2023/2024 production was sold in calendar year 2023 than previously expected. Estimated rice receipts were also lowered $3 million (0.1 percent) because of new monthly marketing percentage data. Hay receipts were revised downward $32 million (0.3 percent), and tobacco receipts were revised downward $6 million (0.6 percent), both due to updated production data from NASS. Receipts for sugar beets were revised upward by $17 million (0.7 percent) for 2023, based on updated price data from NASS. In addition, receipts for proso millet were revised upward by 0.4 percent, and mustard seed receipts were lowered by 0.5 percent. The inventory adjustment for crops in 2023 was raised by $4.5 billion, offsetting the overall reduction in crop receipts.
Changes to production expenses estimates for 2020–23 were comprised of small revisions to net rent and capital consumption. Updates to macroeconomic variables used in the estimation models led to downward revisions in capital consumption estimates of $1.2 million for 2020, $1.9 million for 2021, and $203,000 for 2022, as well as an upward revision of $2.0 million for 2023. All of these revisions were less than 0.1 percent of their respective totals. Also, due to updated macroeconomic data for the time period, estimates of net rent paid to nonoperator landlords and net rent paid to operator landlords were respectively revised upward by amounts of $0.1 million or less for 2020–22, and downward by less than $0.1 million for 2023.
Combined, the revisions to cash receipts, inventory adjustments, and production expenses resulted in an increase of $0.6 billion (0.4 percent) to net farm income for 2023. In addition, net farm income estimates were raised by $1.1 million for 2020, by $1.9 million for 2021, and by $0.2 million for 2022, with each of these amounts representing less than 0.1 percent of their respective totals.
December 3, 2024
The December 2024 release of the 2024 farm income forecast was the second revision since the initial February forecast. The December release also revised the estimates for previous years. Forecasts and estimates incorporated additional information that has become available since the September 2024 release.
In addition to the adjustments to the 2024 forecast (as shown in the chart above), some estimates for 2022 and 2023 were revised to include new and updated source data from USDA, National Agricultural Statistics Service (NASS) on commodity production, sales, and percent of sales marketed by month. Overall, crop cash receipts for 2023 were revised downward by $5.4 billion (2.0 percent) relative to the September 2024 release. Additional data from NASS on monthly marketing percentages for some crops indicate that a smaller share of crop year 2023/2024 production was sold in calendar year 2023 than previously forecast, leading to downward revisions for calendar year 2023 cash receipts for wheat (7.7 percent), sorghum (7.1 percent), dry beans (5.3 percent), soybeans (4.8 percent), sunflowers (2.1 percent), corn (0.5 percent), cotton (0.3 percent), and rice (0.2 percent). There was an upward revision (0.6 percent) to barley cash receipts. Also, due to updated production and price data, receipts for oranges, potatoes, grapefruit and mushrooms were revised upward, while lemons and tangerines were revised downward. Receipts for sugarcane and sugar beets for 2023 were also revised downward $393 million (17.5 percent) and $684 million (22.9 percent), respectively. Offsetting the decrease in crop cash receipts, there was a positive revision of $5.6 billion to the inventory adjustment for crops in 2023 reflecting the decrease in 2023 marketings relative to the September forecast. The 2022 estimate of total crop cash receipts was also revised upward by $3.1 million. While no previously released estimates of animal and animal products cash receipts were revised, the inventory adjustment for animals and animal products was revised upward $4.0 million for 2023.
Changes to production expenses estimates consisted of revisions to net rent and capital consumption. Because of updates to macroeconomic variables used in the estimation models, capital consumption estimates were revised down $43.3 million (0.1 percent) for 2020, down $76.1 million (0.3 percent) for 2021, up $85.5 million (0.3 percent) for 2022, and down $16.1 million for 2023. Estimates of net rent paid to nonoperator landlords were revised up $1.6 million in 2020, up $2.9 million in 2021, down $3.2 million in 2022, and up $606,000 in 2023. Estimates of net rent paid to operator landlords were revised by amounts of less than $1 million for each of the same years. All revisions to net rent estimates were less than 0.1 percent of the respective totals.
This release incorporates updated data (posted September 30, 2024) from the Small Business Administration on loan forgiveness for the Paycheck Protection Program (PPP). As a result, direct Government payments estimates were revised upward $1.2 million for 2020 and $1.6 million for 2021. Combined, the revisions to cash receipts, inventory adjustments, Government payments, and production expenditures resulted in a positive revision of $227.2 million (0.2 percent) to net farm income for 2023. In addition, net farm income estimates were raised by $42.9 million and $74.7 million for 2020 and 2021, respectively, and lowered by $78.6 million for 2022.
September 5, 2024
This release includes the first calendar year 2023 national farm income estimate. All previously released national level data for 2023 were referred to as forecasts. This release also includes the first State-level estimates for 2023. The 2023 national and State farm income estimates reflect recently available data on cash receipts from USDA's National Agricultural Statistics Service (NASS) and preliminary data from USDA's 2023 Agricultural Resource Management Survey (ARMS), particularly on production expenses. This update also revises the 2024 national farm income forecast, released in February 2024.
Following the release of 2022 Census of Agriculture data in February 2024, NASS made numerous revisions to data on production, sales, and percent of sales marketed by month. Historical estimates for some components of farm income were also adjusted for 2017 through 2022 to reflect the new and updated source data.
Crop cash receipts were revised up $9 million for 2017, $896 million (0.5 percent) for 2018, $1.4 billion (0.7 percent) for 2019, $2.3 billion (1.2 percent) for 2020, $3.5 billion (1.4 percent) for 2021, and $4.6 billion (1.6 percent) for 2022. Higher estimates for miscellaneous crops were the largest contributors to these upward revisions for 2018 through 2022.
Estimates of animal/animal products receipts were revised upward by $625 million (0.4 percent) in 2020, $494 million (0.3 percent) in 2021, and $1.4 billion (0.5 percent) in 2022. Animal/animal products receipts were also revised down $236 million for 2018 and $60 million for 2019. These changes include positive revisions to miscellaneous animal/animal products receipts for each year, including upward revisions of $361 million (5.4 percent) in 2020, $525 million (7.3 percent) in 2021, and $872 million (11.5 percent) in 2022.
The inventory adjustment for crop receipts in 2022 was revised downward by $677 million, and the inventory adjustment for animal/animal product receipts was revised downward by $157 million for the same year. In addition, the animal/animal products inventory adjustment was revised downward $129 million for 2018, up $102 million for 2019, down $173 million for 2020, and down $86 million for 2021.
Updated data for some expense categories led to an overall upward revision of $7.2 billion (1.7 percent) in total production expenses for 2022. This total included revisions to livestock and poultry purchases (down $254 million or 0.7 percent), fertilizer/lime/soil conditioner expenses (down $220 million or 0.6 percent), miscellaneous expenses (down $455 million or 1.0 percent), and labor expenses (up $439 million or 1.0 percent).
Incorporation of data from the 2022 Census of Agriculture, updated weights used for the 2022 ARMS data, and revisions to macroeconomic variables included in our model also resulted in changes in the estimated value of capital consumption as well as net rent for prior years. Estimated capital consumption was revised upward by $10.0 billion (44.0 percent) for 2022. Estimated net rent paid to operator landlords was lowered by $704 million for 2022; the estimate for net rent paid to and received by nonoperator landlords was reduced by $2.5 billion for the same year. Also, interest expense estimates were revised upward by $231 million (1.0 percent) for 2022.
Estimated total production expenses for 2017 were lowered by $625 million (0.2 percent), including a downward revision of $655 million (1.8 percent) in the capital consumption estimate, and an upward revision of $111 million (0.6 percent) in interest expenses. Total production expenses were also adjusted by amounts of less than $2 million for 2018 through 2021.
Overall, these revisions to cash receipts, inventory adjustments, and expenditure components resulted in upward revisions to net farm income (NFI) of $613 million (0.8 percent) for 2017, $537 million (0.7 percent) for 2018, $1.4 billion (1.7 percent) for 2019, $2.8 billion (2.9 percent) for 2020, and $3.9 billion (2.7 percent) for 2021. For 2022, the NFI estimate was reduced by $3.5 billion (1.9 percent).
Revisions were also made to the farm sector balance sheet for 2018 through 2022. Farm sector assets were lowered $7.5 billion (0.2 percent) in 2018, $26.1 billion (0.8 percent) in 2019, $44.1 billion (1.4 percent) in 2020, and $73.5 billion (2.1 percent) in 2021. Almost all the adjustments to the balance sheet in these years were to the estimates of real estate assets. Farm sector assets for 2022 were lowered $48.4 billion (1.3 percent). This included a downward revision to machinery and vehicle assets of $32.0 billion (9.3 percent) and a negative revision to real estate assets of $18.7 billion (0.6 percent). Current debt in 2022 was revised downward $2.7 billion (2.4 percent), while non-current debt saw a positive revision of $2.8 billion (0.7 percent). Altogether, these revisions decreased farm sector equity by 0.3 percent in 2018, 1.0 percent in 2019, 1.6 percent in 2020, 2.4 percent in 2021, and 1.5 percent in 2022.
Finally, the 2023 estimates of farm-level and farm business average net cash income incorporate preliminary data from the 2023 ARMS, while the 2023 data from the February 2024 release data were forecasts. The 2022 estimates were revised to incorporate updated weights for the 2022 ARMS data.
February 7, 2024
The February 2024 release of the 2023 farm income forecast is the third and final revision of the 2023 forecast. The February release also revised the estimates for previous years. Forecast and estimates incorporate additional information that has become available since the November 2023 release. The chart below shows the revision to the 2023 net farm income forecast by major component of income.
In addition to the adjustments to the 2023 forecast, some estimates for 2018 through 2022 were revised to reflect the final estimates released by USDA, National Agricultural Statistics Service (NASS) on commodity production, sales, and percent of sales marketed by month. Overall, crop cash receipts for 2022 were revised upward by $1.9 billion (0.7 percent). In addition, crop cash receipts were revised upward by $0.2 billion (0.1 percent) for 2018, $0.7 billion (0.4 percent) for 2019, $1.4 billion (0.7 percent) for 2020, and $1.9 billion (0.8 percent) for 2021.
NASS’ release of the final estimates of price and production data resulted in revisions to receipts for most fruit/nut and vegetable/melon commodities between 2018 and 2022. These include lettuce receipts, which were revised upward by 33.7 percent, 32.1 percent and 35.2 percent for 2020, 2021 and 2022 respectively, as well as broccoli receipts, which were revised upward by 14.0 percent, 13.5 percent and 39.0 percent for the same years. These NASS revisions also resulted in upward adjustments of 8.0 percent, 11.0 percent and 22.1 percent to snap bean receipts in 2020, 2021 and 2022 respectively, and upward revisions of 7.5 percent, 15.8 percent and 11.2 percent in sweet corn receipts for the same years. Cauliflower receipts were revised upward 25.2 percent for 2019, 40.9 percent for 2020, 2.7 percent for 2021, and 22.0 percent for 2022. Nectarine receipts were revised upward by 18.4 percent, 24.5 percent and 24.5 percent for 2020, 2021 and 2022 respectively, while receipts for olives were revised upward by 10.4 percent, 12.3 percent and 20.9 percent for the same period.
Also, additional data from NASS on monthly marketing percentages for some crops indicate that a smaller share of crop year 2022/2023 production was sold in calendar year 2022 than previously forecast, leading to downward revisions of corn receipts (1.5 percent), rice receipts (0.2 percent), and proso millet receipts (3.3 percent) for 2022. Corn receipts were revised downward 0.3 percent for 2019, 2020 and 2021. The inventory adjustment for crops was also revised upward by $850 million for 2022. It was also revised upward by $82 million for 2020, and downward by $135 million, $55 million and $64 million for 2018, 2019 and 2021 respectively. No previously released estimates of animal and animal products cash receipts were revised, but the inventory adjustment for animals and animal products was revised downward by $6 million for 2022. It was also revised downward by $2 million for 2018 and by $80 million for 2020, and was revised upward by $52 million for 2019 and $49 million for 2021.
Changes to production expenses estimates for 2018–22 were comprised of revisions to net rent and capital consumption. Updates to macroeconomic variables used in the estimation models led to downward revisions in capital consumption estimates of $972,000 for 2018, $202,000 for 2019, $2.3 million for 2020, $672,000 for 2021, and $718,000 for 2022. All of these revisions were less than 0.1 percent of their respective totals. Also, due to updated macroeconomic data for the time period, estimates of net rent paid to nonoperator landlords and net rent paid to operator landlords were respectively revised upward by amounts of $0.1 million or less for 2018–22.
Combined, the revisions to cash receipts, inventory adjustments, and production expenditures resulted in an increase of $2.7 billion (1.5 percent) to net farm income for 2022. In addition, net farm income estimates were raised by $92 million (0.1 percent) for 2018, by $739 million (0.9 percent) for 2019, by $1.4 billion (1.5 percent) for 2020, and by $1.9 billion (1.3 percent) for 2021.
November 30, 2023
The November 2023 release of the 2023 farm income forecast was the second revision since the initial February forecast. The November release also revised the estimates for previous years. Forecast and estimates incorporated additional information that has become available since the August 2023 release.
In addition to the adjustments to the 2023 forecast, some estimates for 2018 through 2022 were revised to include new and updated source data from USDA, National Agricultural Statistics Service (NASS) on commodity production, sales, and percent of sales marketed by month. Overall, crop cash receipts for 2022 were revised downward by $1.8 billion (0.7 percent). Additional data from NASS on monthly marketing percentages for some crops indicate that a smaller share of crop year 2022/2023 production was sold in calendar year 2022 than previously forecast, leading to downward revisions of sorghum receipts (5.8 percent), cotton receipts (5.6 percent), sunflower receipts (4.5 percent) wheat receipts (1.9 percent), and soybean receipts (1.6 percent). The additional marketing data also led to upward revisions in 2022 for barley receipts (8.3 percent), peanut receipts (1.6 percent) and hay receipts (1.3 percent). Also, due to updated production and price data, receipts for oranges and lemons were revised upward, and grapefruit and potato receipts were revised downward for the same year. There was a positive revision of $1.5 billion to the inventory adjustment for crops, partially offsetting the decrease in crop cash receipts. No previously released estimates of animal and animal products cash receipts were revised, but the inventory adjustment for animals and animal products was revised upward $38.2 million for 2022.
Changes to production expenses estimates were comprised of revisions to net rent and capital consumption. Because of updates to macroeconomic variables used in the estimation models, capital consumption estimates were revised downward $771.8 million (2.6 percent) for 2018, $716.7 million (2.5 percent) for 2019, $579.2 million (2.0 percent) for 2020, $396.9 million (1.6 percent) for 2021, and $96.6 million (0.4 percent) for 2022. Estimates of net rent paid to nonoperator landlords were revised upward by $28.9 million in 2018, $26.8 million in 2019, $23.1 million in 2020, $15.4 million in 2021, and $3.6 million in 2022. Estimates of net rent paid to operator landlords were revised upward $6.6 million for 2018, $6.1 million for 2019, $5.3 million for 2020, $3.5 million for 2021, and $824,000 for 2022. All revisions to net rent estimates were 0.2 percent or less of the respective totals.
Due to updated data (posted September 30, 2023) from the Small Business Administration on loan forgiveness for the Paycheck Protection Program (PPP), direct Government payments estimates were revised upward $34.1 million for 2020 and $11.9 million for 2021. Combined, the revisions to cash receipts, inventory adjustments, Government payments, and production expenditures resulted in a decrease of $196.2 million (0.1 percent) to net farm income for 2022. In addition, net farm income estimates were raised by $742.9 million (0.9 percent) for 2018, by $689.9 million (0.9 percent) for 2019, by $589.8 million (0.6 percent) for 2020, and by $393.1 million (0.3 percent) for 2021.
August 31, 2023
This release includes the first calendar year 2022 national farm income estimate, as well as the 2022 State estimates. All previously released data for 2022 were referred to as forecasts. The 2022 national and State farm income estimates reflect newly available data on cash receipts from USDA's National Agricultural Statistics Service (NASS) and preliminary data from USDA's 2022 Agricultural Resource Management Survey (ARMS), especially on production expenses. This update also revised the 2023 national farm income forecast, released in February 2023.
Historical estimates for some components of farm income were also adjusted for 2020 and 2021 to reflect new and updated source data from NASS on production, sales, and percent of sales marketed by month. None of the revisions to historical data resulted in more than a 1-percent change to net income or its major aggregate components relative to the previous report. Crop cash receipts were revised downward by $324 million (-0.1 percent) for 2021, and animal/animal product cash receipts were revised upward by $100 million (0.1 percent) for the same year. The largest contributors in dollar terms to the negative revision for crops were cotton, fruits/nuts, and corn, while miscellaneous crops and vegetables/melons had positive revisions. A higher estimate for other animals and products was the main driver of the positive revision in animal/animal product receipts, while cattle/calves receipts saw a negative revision. For 2020, crop cash receipts were revised downward by $312 million, and estimates for animal/animal product cash receipts were revised downward by $18 million. The inventory adjustment for crop receipts in 2021 was revised downward by $792 million, while the inventory adjustment for animal/animal product receipts was revised upward by $211 million for the same year.
The only historical revisions made to the intermediate product expenses estimates were for livestock and poultry purchases, which were revised downward by $22 million for 2021. Revisions to macroeconomic variables included in our model also resulted in changes in the estimated value of capital consumption as well as net rent in prior years. Estimated capital consumption was revised upward by $691,000 for 2021. Estimated net rent paid to nonoperator landlords was lowered by $826,000 for 2021; the estimate for net rent paid to and received by operator landlords was reduced by $239,000 for the same year. Interest expense estimates were revised upward by $4 million for 2021. Overall, these revisions to cash receipts, inventory adjustments, and expenditure components resulted in a reduction of $780 million (-0.6 percent) in net farm income (NFI) for 2021. NFI for 2020 was also revised downward by $374 million (-0.4 percent).
Slight revisions were also made to the farm sector balance sheet for 2020 and 2021. Inventories were adjusted downward by $9.3 million and $15.3 million for 2020 and 2021, respectively. Real estate debt held by life insurance companies was revised upward by $191 million for 2021. Altogether, these revisions increased farm sector equity by less than 0.1 percent in 2020 and decreased it by less than 0.1 percent in 2021.
Finally, the 2022 estimates of farm-level and farm business average net cash income incorporate preliminary data from the 2022 ARMS, while the February data were a forecast.
February 7, 2023
This was the third and final revision of the 2022 farm income forecast. This release also revised the farm income estimates for previous years. Forecasts and estimates incorporated additional information that became available since the December 2022 release.
In addition to changes to the 2022 forecast, some revisions to prior year estimates are also noted relative to the December 2022 release. The 2021 U.S. crops cash receipts estimate was revised upward by $964 million (0.4 percent). This change reflects new State and U.S. data from USDA’s National Agricultural Statistics Service (NASS) on 2021/2022 monthly marketing patterns for corn, as well as updated prices from NASS for proso millet. The crop inventory adjustment for 2021 was reduced by $878 million, also reflecting the new and revised NASS data. There were no adjustments made to livestock cash receipts or inventory adjustment estimates.
Revisions to certain macroeconomic variables included in our historical estimates model resulted in changes to 2018–21 U.S. and State-level estimates of capital consumption and net rent. At the U.S. level, capital consumption was revised upward by $644,000 for 2018, $1.8 million for 2019, $1.6 million for 2020, and $230.9 million for 2021. Estimated net rent paid to operator landlords was revised downward by $675,000 for 2021, and net rent paid to nonoperator landlords was revised downward by $2.9 million for the same year. Slight revisions were made to estimates of net rent paid to operator and nonoperator landlords for 2018, 2019, and 2020.
Due to updated data (posted January 8, 2023) from the Small Business Administration on loan forgiveness for the Paycheck Protection Program (PPP), direct Government payments estimates were revised upward by $895,000 for 2020 and $26.2 million for 2021. Revisions to revenue and expense items noted above result in net farm income revisions as well. Net farm income for 2021 was revised downward by $117.4 million (0.1 percent) compared with the December 2022 release, primarily due to higher estimated capital consumption. The net cash farm income estimate, which is not affected by noncash items such as capital consumption and inventory adjustments, was revised upward by $981.4 million (0.7 percent) for 2021. Net farm income estimates for 2018, 2019, and 2020 were each revised downward by less than $2 million.
A downward revision of $466,000 to crop inventories for 2021 was the only change made to balance sheet estimates.
December 1, 2022
The December 2022 release of the 2022 farm income forecast was the second revision since the initial February forecast. The December release also revised the estimates for previous years. Forecast and estimates incorporated additional information that has become available since the September 2022 release.
In addition to the adjustments to the 2022 forecast, some estimates for 2018 through 2021 were revised to include new and updated source data from USDA, National Agricultural Statistics Service (NASS) on commodity production, sales, and percent of sales marketed by month. Overall, crop cash receipts for 2021 were revised upward by $2.2 billion (0.9 percent). A correction to the data from the previous release (September 1, 2022) was made to sugarcane and sugar beet receipts, resulting in upward revisions to 2021 receipts for these commodities of 35 percent and 57 percent, respectively. Also, additional data from NASS on monthly marketing percentages indicate that a larger share of crop year 2021/2022 production was sold in calendar year 2021 than previously forecast, leading to upward revisions of 1.6 percent and 1.1 percent for wheat and soybean receipts, respectively. The additional marketing data also indicated small upward revisions in dollar terms to cotton, dry beans, hay, and barley receipts for 2021. Receipts for oranges, tangerines, and grapefruit were revised upward as well, due to updated production and price data. The overall increase in crop cash receipts was largely responsible for a negative revision of $696 million to the inventory adjustment for 2021. In addition, the crop cash receipts estimates for 2019 and 2020 were raised by $3.9 million and lowered by $6.1 million respectively, and crops inventory adjustment estimates for 2019 and 2020 were lowered by $4.2 million and raised by $5.7 million respectively. No previously released estimates of animal and animal products cash receipts were revised.
Changes to production expenses estimates were comprised of revisions to interest expenses, net rent, and capital consumption. Estimated interest expenses for 2021 were increased by $501.5 million. Because of updates to macroeconomic variables used in the estimation models, capital consumption estimates were revised upward $29.4 million for 2018, $35.2 million for 2019, $110.5 million for 2020, and $673.8 million for 2021. Estimates of net rent paid to nonoperator landlords were revised downward by $1.1 million in 2018, $1.3 million in 2019, $10.0 million in 2020, and $155.5 million in 2021. Estimates of net rent paid to operator landlords were revised downward $250,000 for 2018, $299,000 for 2019, $2.3 million for 2020, and $42.3 million for 2021.
Due to updated data (posted October 2, 2022) from the Small Business Administration on loan forgiveness for the Paycheck Protection Program (PPP), direct Government payments estimates were revised upward $4.8 million for 2020 and $97.9 million for 2021. Combined, the revisions to cash receipts, inventory adjustments, Government payments, and production expenditures resulted in an increase of $610.4 million (0.4 percent) in net farm income for 2021. Net farm income estimates were lowered by $28.3 million for 2018, by $34.2 million for 2019, and by $94.8 million for 2020.
September 1, 2022
This release includes the first calendar year 2021 national farm income estimate, as well as the 2021 State estimates. Previously released data for 2021 were considered forecasts. The 2021 national and State farm income estimates reflect newly available data on cash receipts from USDA's National Agricultural Statistics Service (NASS) and preliminary data from USDA's 2021 Agricultural Resource Management Survey (ARMS), especially on production expenses. This update also revised the 2022 national farm income forecast from February 2022.
Historical estimates for some components of farm income were also adjusted for 2019 and 2020 to reflect new and updated source data from NASS on production, sales, and percent of sales marketed by month. Crop cash receipts were revised upward by $282 million (0.1 percent) for 2020, and animal/animal product cash receipts were revised downward by $597 million (-0.4 percent) for the same year. The largest contributors in dollar terms to the positive revision for crops were vegetables/melons, while cotton, corn, and fruits/nuts all had negative revisions. Lower estimates for poultry/eggs and milk were the main contributors to the negative revision in animal/animal product receipts. For 2019, crop cash receipts were revised upward by $56 million, and estimates for animal/animal product cash receipts were revised upward by $172 million. The inventory adjustment for crop receipts in 2020 was revised downward by $523 million, while the inventory adjustment for animal/animal product receipts was revised upward by $215 million for the same year.
The only historical revisions made to the intermediate product expenses estimates were for livestock and poultry purchases, which were revised upward by $15 million and $18 million for 2019 and 2020, respectively, and downward by $1.4 million for 2018. Revisions to macroeconomic variables included in our model also resulted in changes in the estimated value of capital consumption as well as net rent in prior years. Estimated capital consumption was revised upward by $1.1 million for 2020, downward by $1.1 million for 2019, and upward by $602,000 for 2018. Estimated net rent paid to nonoperator landlords was lowered by $65 million for 2020, $74 million for 2019, and $87 million for 2018, while the estimate for net rent paid to and received by operator landlords was reduced by $18 million, $21 million, and $25 million, respectively, for the same years. In addition, interest expense estimates were revised upward by $18 million, $36 million, and $88 million for 2020, 2019, and 2018, respectively. Overall, these revisions to cash receipts, inventory adjustments, and expenditure components resulted in a reduction of $737 million (-0.8 percent) in net farm income (NFI) for 2020. NFI for 2019 was revised upward by $252 million (0.3 percent) and the estimated NFI for 2018 was reduced by less than $1 million.
Slight revisions were also made to the farm sector balance sheet for 2018, 2019, and 2020. Inventories were adjusted downward by $7.7 million and $8.2 million for 2019 and 2020, respectively. Nonreal estate and real estate debt held by commercial banks was revised upward by $797 million and $6.9 million, respectively, for 2019, and upward by $503 million and $110 million, respectively, for 2018. These revisions reflect updates to onfarm debt held at commercial banks as tabulated by the Federal Reserve Bank of Kansas City. Altogether, the revisions decreased estimated farm sector equity in 2018, 2019, and 2020 by less than 0.1 percent.
Finally, the 2021 estimates of farm-level and farm business average net cash income incorporate preliminary data from the 2021 ARMS, while the February data were a forecast.
February 4, 2022
This was the third and final revision of the 2021 farm income forecast. This release also revised the farm income estimates for previous years. Forecasts and estimates incorporated additional information that became available since the December 2021 release.
In addition to changes to the 2021 forecast, some revisions to prior year estimates are also noted, relative to the December 2021 release. The 2020 U.S. crops cash receipts estimate was revised upward by $1.2 billion (0.6 percent). This reflects new State and U.S. data from USDA’s National Agricultural Statistics Service (NASS) on 2020/2021 monthly marketing patterns for corn, dry beans, and chickpeas, as well as updated prices from NASS for proso millet. The crop inventory adjustment for 2020 was reduced by $1 billion, also reflecting the new and revised NASS data. The 2020 inventory adjustment for livestock was revised upward $193.3 million based on updated end-of-year inventory data for hogs released by NASS.
Revisions to certain macroeconomic variables included in our historical estimates model for 2018–20 resulted in very small adjustments to U.S. and State-level estimates of capital consumption and net rent. At the U.S. level, capital consumption was revised down by less than 0.01 percent for 2018 and 2020, and up by less than 0.01 percent for 2019. Very slight changes were also made to estimates of net rent paid to both operator and nonoperator landlords for the same years.
Revisions to revenue and expense items noted above result in net farm income revisions as well. Net farm income for 2020 was revised upward $393.4 million (0.4 percent) compared with the December 1, 2021 release, mainly because of the higher estimate for crop cash receipts. Net farm income for 2019 was revised downward $140.7 million (0.2 percent), while the net farm income estimate for 2018 was raised by less than $2 million.
December 1, 2021
The December 2021 release of the 2021 farm income forecast was the second revision since the initial February forecast. This release also revised the estimates for previous years. Forecast and estimates incorporated additional information that has become available since the September 2021 release.
In addition to the adjustments to the 2021 forecast, some estimates for 2018 through 2020 were revised to include new and updated source data from USDA’s National Agricultural Statistics Service (NASS) on commodity production, sales, and percent of sales marketed by month. Overall, crop cash receipts for 2020 were revised upward $5.4 billion (2.8 percent), as soybean receipts were revised upward 13.4 percent and cotton receipts were revised upward 5.0 percent. These changes, which indicate that a larger share of crop year 2020/2021 production was sold in the calendar year 2020 than was previously forecast, are mostly due to additional data from NASS on 2020/2021 monthly marketing percentages. The increase in cash receipts was largely responsible for a negative revision of $4.7 billion to the inventory adjustment for crops for 2020. In addition, the crop cash receipts estimate for 2019 was lowered by $36.6 million, and the crops inventory adjustment was revised upward $4.2 million. While no previously released estimates of animal and animal products cash receipts were revised, the inventory adjustment for animal and animal products was revised downward $19.0 million for 2020.
Changes to production expenses estimates were comprised of revisions to interest expenses, net rent, and capital consumption. Interest expenses were revised upward $394.8 million for 2020, due to updates to ARMS survey data on debt. Estimates for capital consumption were revised upward $14.2 million and $153.1 million for 2018 and 2020, respectively, and downward $81.5 million for 2019. Estimates of net rent paid to nonoperator landlords were revised downward $530,000 and $108.1 million for 2018 and 2020, respectively, and upward $3.0 million for 2019. Estimates of net rent paid to operator landlords were revised downward by $120,000 and $30.3 million in 2018 and 2020, respectively, and upward by $693,000 in 2019.
The above revisions to cash receipts, inventory adjustments, and production expenditures resulted in an increase of $268.6 million (0.3 percent) in net farm income for 2020. The net farm income estimate for 2018 was lowered by $13.6 million, while net farm income was revised upward by $46.1 million for 2019.
Revisions were only made to the farm sector balance sheet for 2020; all earlier data are unchanged. Total farm sector debt was revised downward $3.7 billion (0.1 percent) for 2020—including a downward revision of $3.2 billion in real estate debt held by individuals and others—while farm sector assets were revised downward $3.7 million for the same year. These changes are a result of revisions to 2020 ARMS survey data.
September 2, 2021
This release includes the first 2020 national farm income estimate, as well as the 2020 State estimates. Previously released 2020 data were considered forecasts. The 2020 national and State farm income estimates reflect newly available data on cash receipts from USDA's National Agricultural Statistics Service (NASS) and preliminary data from USDA's 2020 Agricultural Resource Management Survey (ARMS). This update also revised the 2021 national farm income forecast of February 2021.
Estimates for some components of farm income were also adjusted for 2018 and 2019, to reflect new and updated source data from NASS on production, sales, and percent of sales marketed by month. Crop cash receipts were revised downward $1.7 billion (-0.9 percent) for 2019, and animal/animal product cash receipts were revised downward $0.5 billion (-0.3 percent) for the same year. The largest contributors in dollar terms to the negative revision for crops were cotton, vegetables and melons, and feed crops. Lower estimates for poultry and eggs and meat animals accounted for much of the negative revision to animal/animal product receipts. For 2018, crop cash receipts were revised down by $241 million (0.1 percent) and estimates for animal/animal product cash receipts were revised down $1.5 million. The inventory adjustments for crop and animal/animal product receipts in 2019 were revised down by $1.3 billion and $642 million, respectively.
Estimates for previously released farm sector expense components were mostly unchanged. The only change to intermediate product expenses was a downward revision of $173 million (-0.6 percent) to livestock and poultry purchases for 2019. Interest expenses in 2019 were revised upward by $27 million. Revisions to macroeconomic variables included in our model resulted in small changes in the estimated value of capital consumption and net rent. Estimated capital consumption was revised upward $2.8 million for 2019, and downward $519,000 and $673,000 for 2017 and 2018, respectively. Estimated net rent paid to nonoperator landlords was lowered $7.0 million for 2019, while the estimate for net rent paid to and received by operator landlords was reduced by $2 million for the same year. Overall, these revisions to cash receipts, inventory adjustments, and expenditure components resulted in a reduction of $4.1 billion (-4.9 percent) in net farm income (NFI) for 2019. NFI for 2018 was revised downward $242 million (-0.3 percent), and estimated NFI for 2017 was increased by less than $1 million.
Slight revisions were also made to the farm sector balance sheet for 2018 and 2019. Inventories were adjusted upward by $4.1 million for 2019 and downward $646,000 for 2018, with both changes representing less than 0.1 percent of their respective totals. Estimated debt held by life insurance companies was revised upward $1.1 billion (6.6 percent) for 2019. Altogether, these revisions decreased estimated farm sector equity in 2018 and 2019 by less than 0.1 percent.
The 2020 estimates of farm-level and farm business average net cash income were revised to incorporate preliminary data from the 2020 ARMS.
February 5, 2021
This was the third and final revision of the 2020 farm income forecast. This release also revised the farm income estimates for previous years. Forecasts and estimates incorporated additional information that became available since the December 2020 release.
The 2019 U.S. crops cash receipts estimate was revised downward by $402 million (0.2 percent). This reflects new State and U.S. level data from USDA’s National Agricultural Statistics Service (NASS) on 2019/2020 monthly marketing patterns for corn, dry beans, flaxseed, and sunflower, as well as updated prices from NASS for cottonseed, proso millet, and safflower. This revision also reflects newly available data from NASS on floriculture receipts for 2019. The crop inventory adjustment for 2019 was revised up by $8.1 million, also reflecting the new and revised NASS data. The 2019 inventory adjustment for livestock was also revised down $79.4 million based on updated end-of-year inventory data for hogs released by NASS. The crop cash receipts estimate for 2018 was lowered $1.7 million.
Revisions to certain macroeconomic variables included in our historical estimates model for 2017-19 resulted in very small adjustments to U.S. and State-level estimates of capital consumption and net rent. At the U.S. level, capital consumption was revised down by less than 0.01 percent for 2017, 2018, and 2019. Very slight changes were made to estimates of net rent paid to both operator and nonoperator landlords for the same years.
Overall, the revisions to the U.S. net farm income estimates for 2017 and 2018 were less than $1 million in either year. The revision to 2019 net farm income was larger, down $472.2 million (0.6 percent) compared with the December 2 release, mainly because of the lower estimate for crop cash receipts.
December 2, 2020
The December 2020 release of the 2020 farm income forecast was the second revision since the initial February forecast. This release also revised the estimates for previous years. Forecast and estimates incorporated additional information that has become available since the September 2020 release.
In addition to the adjustments to the 2020 forecast, some estimates for 2019 were revised to include new and updated source data from USDA’s National Agricultural Statistics Service (NASS) on commodity production, sales, and percent of sales marketed by month. Additionally, a few estimates for 2015, 2016, and 2018 were revised to include updated data from NASS. Overall, crop cash receipts for 2019 were revised downward $913 million (-0.5 percent), consisting of downward revisions for feed crops (-1.3 percent), food grains (-2.4 percent), and vegetables and melons (-0.3 percent), mostly because of additional data from NASS on 2019/2020 monthly marketing percentages. These new data indicate that a smaller share of crop year 2019/2020 production was sold in calendar year 2019 than was previously forecast. A positive revision of $813 million to the inventory adjustment for crops for 2019 mostly offset the downward revision in crop cash receipts. Additionally, the crop cash receipts estimate for 2018 was increased by $1.5 million, and the crops inventory adjustment was revised downward $229,000. There was also an increase of $930,000 in the 2015 crop cash receipts estimate, and an increase of $32,000 in the 2016 estimate, because of updated production and sales data for miscellaneous crops. No previously released estimates of animal and animal products cash receipts were revised.
The only changes made to the production expenditures estimates were for capital consumption and net rent, mainly caused by revisions to macroeconomic variables included in our model. Estimates for capital consumption were revised downward $1.1 million, $824,000, and $78,000 for 2017, 2018, and 2019, respectively. Capital consumption was also revised downward $80 million for 2015 and upward $1.7 million for 2016. Estimates of net rent paid to nonoperator landlords were revised upward $3 million for 2015 and 2018, and upward $15.6 million for 2019. Estimates of net rent paid to operator landlords were revised upward by $5.1 million in 2019, by $429,000 in 2018, and by $685,000 in 2015.
The above revisions to cash receipts, inventory adjustments, and production expenditures resulted in a reduction of $120.7 million (-0.1 percent) in net farm income for 2019. Revisions in other years were smaller. For example, revisions to 2015 data resulted in an increase of $78.1 million in net farm income for that year, while net farm income was revised down $1.6 million and $1.4 million for 2016 and 2018, respectively; it was revised up $1.1 million for 2017.
A slight revision was made to the farm sector balance sheet for 2019; the estimate for farm sector assets was raised $505,000, because of an increase in estimated inventories.
For the farm business and farm-level average net cash farm income forecasts, we modified our methods to reflect the expected distribution of payments from the Market Facilitation Program (MFP) and Coronavirus Food Assistance Programs (CFAP1 and CFAP2), incorporating administrative data on CFAP1 and CFAP2 payments by commodity grouping. For the farm household income forecast, we modeled changes in off-farm wage and salary income based on changes in State or region level year-over-year monthly employment levels, and estimated household receipt of Economic Impact Payments (EIP). Our forecast of farm income to the household accounts for the expected distribution and level of MFP payments, CFAP1 and CFAP2 program payments, and Paycheck Protection Program payments to farm businesses.
September 2, 2020
With this update, we released the first 2019 national farm income estimate, and the 2019 State estimates. Previously released 2019 data were considered forecasts. The 2019 national and State farm income estimates reflect newly available data on cash receipts from USDA's National Agricultural Statistics Service (NASS) and preliminary data from USDA's 2019 Agricultural Resource Management Survey (ARMS). This update also revised the 2020 national farm income forecast of February 2020.
In addition, a few estimates for 2016-18 included new and updated source data from NASS on production, sales, and percent of sales marketed by month. Crop cash receipts for 2018 were revised downward $1.1 billion (-0.6 percent.). The largest downward revisions were for cotton, feed crops, and miscellaneous crops. Animal and animal products cash receipts were revised downward about $199 million (-0.1 percent) for 2018. Crop cash receipts for 2017 were revised downward by $110,000. The inventory adjustment for 2018 was revised downward by $1.2 billion (-15.9 percent) for crops and revised upward by $86 million (12.3 percent) for animals and animal products. The inventory adjustment for crops for 2017 was adjusted downward about $11 million (-0.2 percent).
Production expenditures were mostly unchanged, with an upward revision of $85 million for livestock and poultry purchases in 2018 as the only revision to intermediate product expenses for that year. This change reflects revisions to NASS data on cattle and hog inshipments (animals shipped into States for feeding or breeding). Revisions to macroeconomic variables included in our model changed the estimated value of capital consumption and net rent. Capital consumption was revised downward $55 million, $67 million, and $88 million for 2016, 2017, and 2018, respectively. Estimates of net rent paid to nonoperator landlords were revised upward $2.1 million, $2.5 million, and $3.3 million for 2016, 2017, and 2018, respectively. Estimates of net rent paid to and received by operator landlords were revised upward by less than $1 million in 2016 and 2017. Overall, revisions to cash receipts, inventory adjustments, and production expenditures resulted in a reduction of $2.5 billion (-2.9 percent) in net farm income for 2018. Net farm income estimates for 2016 and 2017 were revised downward about 0.1 percent.
Revisions were also made to the farm sector balance sheet for 2012 and 2015-18. Estimates of real estate assets were adjusted upward by $1.3 billion, $1.0 billion, and $910 million for 2015, 2016, and 2017, respectively (all adjustments were less than 0.1 percent). Total assets were revised upward by about $1 million for 2018, because of adjustments in inventory values. Total assets were also revised upward $3.2 million for 2012. Collectively, these revisions increased estimates of farm sector equity by less than 0.1 percent for each of these years.
The 2019 estimates of farm-level and farm business average net cash income were revised to incorporate preliminary data from the 2019 ARMS.
February 5, 2020
This was the third and final revision of the 2019 farm income forecast. This release also revised the estimates for previous years to incorporate additional information that became available since the November 2019 release.
The 2018 U.S. crops cash receipts estimate was revised upward by $724.7 million (0.4 percent), reflecting new State and U.S. level data from USDA’s National Agricultural Statistics Service on 2018/2019 monthly marketing patterns for corn, dry beans, flaxseed, and sunflower, as well as updated prices from NASS for cottonseed, cotton lint, proso millet, safflower, and sugar beets. The crop inventory adjustment for 2018 was revised downward by $933.4 million, also reflecting the new and revised NASS data. The 2018 inventory adjustment for livestock was also revised down $10.1 million based on updated end-of-year inventory data for hogs released by NASS. The U.S. totals for mushroom cash receipts were revised down about $42.3 million (4.5 percent) on average in each year from 2008-12. The totals were corrected to match the sum of the states.
In addition, revisions to certain macroeconomic variables included in our historical estimates model resulted in very small amendments to U.S. and State-level estimates of capital consumption and net rent. At the U.S. level, capital consumption was revised by 0.1 percent or less for the years 2013-18. Additionally, very slight changes were made to estimates of net rent paid to both operator and nonoperator landlords for the same time period.
Overall, estimates of net farm income were raised an average of 0.03 percent for 2014-16 and lowered an average of 0.06 percent for 2008-13 and 2017-18. The net U.S. farm income estimate for 2018 was revised downward by $219.1 million (-0.3 percent), mainly because of the lower estimate for inventory adjustment, which was larger in magnitude than the upward revision in the cash receipts estimate.
November 27, 2019
The November 2019 release of the 2019 farm income forecast was the second revision since the initial March forecast. This release also revised the estimates for previous years. Forecast and estimates were revised to incorporate additional information that has become available since the August 2019 release.
Crop cash receipts were revised down $114,000 for 2015, down $136,000 for 2016, up $4.1 million for 2017 and down $1.5 billion (0.8 percent) for 2018. The 2018 revisions primarily reflect additional data from NASS on 2018/2019 monthly marketing patterns for barley, canola, upland cotton, hay, oats, peanuts, sorghum, soybeans, and wheat. These new data indicate that a smaller share of crop year 2018/2019 production was sold in calendar year 2018 than was previously forecast using historical averages. The revisions to 2018 crop cash receipts were partially offset by a $0.6-billion upward revision to the inventory adjustment for crops, which was also the result of incorporating additional data on monthly marketing patterns. In particular, 2018 cash receipts for soybeans were revised downward by $2.6 billion, with a $1.6-billion upward revision to the inventory adjustment. The November 27 release also includes additional revisions to U.S. and State-level cash receipts and inventory adjustment following other changes to data released by NASS. Animal and animal product cash receipts estimates were not revised.
Farm-related income was revised down $1.8 billion for 2017 because of revised weights for the 2017 USDA Agricultural Resource Management Survey (ARMS) data that were not incorporated into the data released in August 2019. The new 2017 ARMS weights changed 2017 estimates for farm sector total assets and total debt, revised down $1.3 billion (0.04 percent) and $2.6 billion (0.7 percent) respectively. The revision to assets further contributed to a $1.1 billion (3.2 percent) revision to capital consumption for 2017. Finally, the use of revised 2017 ARMS data resulted in a $5.7 billion (2.2 percent) upward revision to machinery and vehicle assets for 2018. (The year-to-year change in the ARMS data is used in deriving the 2018 estimate.)
Overall, net farm income was revised up slightly (0.3 percent or less) in each year from 2013 to 2016 and 2018. In 2017, the additional information resulted in a decrease of $2.6 billion (3.4 percent) in net farm income, with revisions to both income and expenses.
September 3, 2019
Errata: On September 3, 2019, the raw, comma separated value (csv) data file containing the complete forecast and historical data for the August 30, 2019, release of the Farm Income and Wealth Statistics data product was replaced. The original file contained errors in the 2019 forecast values for several balance sheet asset components (and as such affected 2019F assets, equity, and some financial ratios). The errors were specific to the creation of the csv download file and did not impact data found in the reports, text, or data visualizations.
August 30, 2019
With this update, we released the first 2018 national farm income estimate (see "Farm Income and Wealth—From Forecast to Estimate Across 19 Months" section above), and the 2018 State estimates. (All previously released 2018 data were considered forecasts.) The 2018 national and State farm income estimates reflect newly available data on cash receipts from USDA’s National Agricultural Statistics Service (NASS) and preliminary data from USDA’s 2018 Agricultural Resource Management Survey (ARMS). This update also revised the 2019 national farm income forecast done in March 2019.
In the farm sector income statement, estimates for 2013-17 were also updated to incorporate new and revised source data. Specifically, data from the 2017 Census of Agriculture were used directly in estimating State cash receipts, farm-related income, and production expenses where annual, survey-based data from ARMS or NASS were not available at the State level. These adjustments were confined to State estimates, with national figures unaffected. Additionally, some data on commodity production and sales sourced from NASS were revised by NASS back to 2013 following the release of the 2017 Census of Agriculture. Finally, information from the 2017 Census of Agriculture was used to revise weights for the 2017 ARMS survey data used to estimate 2017 production expenses, select components of farm-related income, and capital expenditures. The overall impact of the additional data on commodity production and sales was to raise net farm income slightly (0.9 percent or less) in each year from 2013 to 2016. In 2017, the additional information resulted in an increase of $2.5 billion (3.3 percent) in net farm income, with revisions to both income and expenses.
In the farm sector balance sheet, there are also a number of revisions to estimates. Farm assets were revised down across 2013-16, with 2016 revised down the most at $43.1 billion (1.5 percent). This adjustment primarily reflects revised NASS data on the value of farmland and buildings. Smaller revisions to crop and animal inventories for 2013-17 followed NASS revisions to data on commodity production and sales. Farm assets were revised up $13.2 billion (0.4 percent) in 2017 due to revised 2017 ARMS data, particularly for the value of machinery and vehicles assets.
The 2017 and 2018 estimates and 2019 forecasts of farm-level and farm business average net cash income were revised to incorporate revised data from the 2017 ARMS and preliminary data from the 2018 ARMS.
March 6, 2019
Note: The lapse in Federal funding that began on December 22, 2018, and lasted 35 days, delayed the availability of some data used to produce the forecasts and temporarily halted production of the Farm Income and Wealth Statistics. As a result, the release scheduled for February 6, 2019, was postponed to March 6, 2019.
This is the third and final revision of the 2018 farm income forecast. This release also revises the estimates for previous years to incorporate additional information that has become available since the November 2018 release.
U.S. and State-level crop cash receipts for 2013-17 were revised slightly, reflecting revisions to NASS data on production and prices for canola, corn, dry beans, hay, maple products, proso millet, oats, rice, rye, soybeans, tobacco, and wheat. The 2017 revisions also reflect new data from NASS on 2017/2018 monthly marketing patterns for flaxseed, sunflower, dry beans, and corn. Overall, U.S. crop cash receipts were revised 0.44 percent or less in each year from 2013 to 2017. The revised and new NASS data also resulted in slight revisions to the U.S. and State-level crop inventory adjustments for 2013-17. The 2017 inventory adjustment for livestock was revised down $30 million following revisions to NASS data on hog inventories.
Additionally, revisions to the values of certain macroeconomic variables included in our model changed the U.S. and State-level estimated values of net rent paid to both nonoperator and operator landlords. Total net rent paid was lowered by 0.11 percent or less in each year from 2012 to 2017. Similarly, net cash rent received by operator landlords was lowered by 0.16 percent or less in each year from 2012 to 2017. Changes in macroeconomic variables also increased previously estimated capital consumption by 1.11 percent in 2013, 1.17 percent in 2014, and 0.12 percent or less in 2012 and 2015-17.
The 2018 forecast for net farm income was revised down $3.2 billion (4.8 percent) from the forecast released in November 2019. Most of that revision resulted from downward revisions to crop cash receipts and the value of crop inventory change.
November 30, 2018
The November 2018 release of the 2018 farm income forecast is the second revision since the initial February forecast. This release also revises the estimates for previous years to incorporate additional information that has become available since the August 2018 release.
Crop cash receipts were revised down $242,000 for 2016 and down $2.0 billion (1.0 percent) for 2017. The 2016 revisions reflect a change in NASS reported prices for canola, upland cotton, hay, peanuts, and rye, which also resulted in the crop inventory adjustment being revised down $75,000 in 2016. The 2017 revisions primarily reflect additional data from NASS on 2017/2018 monthly marketing patterns for barley, canola, upland cotton, hay, oats, peanuts, sorghum, soybeans, and wheat. These new data indicate that a smaller share of crop year 2017/2018 production was sold in calendar year 2017 than was previously forecast using historical averages. The revisions to 2017 crop cash receipts were offset by a $2.2-billion upward revision to the inventory adjustment for crops, which was also the result of incorporating additional data on monthly marketing patterns. In particular, 2017 cash receipts for soybeans were revised downward by $2.0 billion, with a $2.2-billion upward revision to the inventory adjustment. The November 30 release also includes additional revisions to U.S. and State-level cash receipts following other changes, primarily on prices received, to data released by NASS. These revisions were generally small and affected the 2017 cash receipt estimates for cotton lint, cottonseed, dry beans, flaxseed, grapefruit, lemons, mushrooms, oranges, potatoes, rye, sugarcane, sugar beets, sunflowers, and tangerines.
Also, revisions to the value of certain macroeconomic variables included in our model changed the U.S. and State-level estimated values of net rent paid to both nonoperator and operator landlords. Total net rent paid was lowered by 0.10 percent or less in 2015-17. Similarly, net cash rent received by operator landlords was lowered by 0.14 percent in 2015, and by less than 0.1 percent in 2016 and 2017. Changes in macroeconomic variables also increased previously estimated capital consumption by 1.1 percent in 2015, 0.19 percent in 2016, and 0.5 percent in 2017.
August 30, 2018
With this update, we release the first 2017 national farm income estimate (see "Farm Income and Wealth—From Forecast to Estimate Across 19 Months" section above), and release the 2017 State estimates (all previously released 2017 data were considered forecasts). The update also revises the 2018 forecast done in February 2018. The 2017 national and State estimates reflect newly available data on cash receipts from NASS and preliminary data from USDA’s 2017 Agricultural Resource Management Survey (ARMS).
Overall, net farm income was revised up $51 million (0.1 percent) in 2015 and down $20 million (0.03 percent) in 2016 as a result of the newly available State and national data. Some 2015 and 2016 estimates—including production, sales, and percent of sales marketed by month from NASS—were also revised to reflect newly available data. The new production and marketing information from NASS resulted in a slight increase in cash receipts and slight decrease in the change in inventories. Combined, total value of production increased by $71 million (0.02 percent) and decreased by $374 million (0.09 percent) for 2015 and 2016, respectively. Inventory values in the balance sheet increased by $8.2 million (less than 0.01 percent), on average, in 2015 and 2016. Finally, livestock and poultry purchases (as part of production expenses) in 2016 were revised down $359 million (1.6 percent) following a revision to NASS data on cattle inshipments (cattle shipped into States for feeding or breeding).
Also, revisions to macroeconomic variables included in our model changed the estimated value of net rent paid to nonoperator and operator landlords. Each was lowered by less than 0.01 percent in 2015 and raised by 0.02 percent or less in 2016. Changes in macroeconomic variables also increased previously estimated capital consumption by 0.5 percent in 2015 and by less than 0.01 percent in 2016.
In addition to changes to 2015 and 2016 estimates, the livestock inventory adjustment for 2010-14 underwent a minor revision due to changes in NASS Quick Stats reporting, with minor impacts on net farm income (less than $2 million) in 2010-13. Crop inventories for 2012 were also revised up slightly ($5.9 million or 0.003 percent), reflecting updates to NASS data.
The 2017 estimates and 2018 forecasts on farm-level and farm business average net cash income were revised to incorporate preliminary data from the 2017 ARMS. Changes in questionnaire design between the 2016 and 2017 surveys contributed to the share of farming operations classified as farm businesses growing from 40.2 percent in 2016 to 48.5 percent in 2017. More principal operators reported their primary occupation as farming in 2017, and most of this increase was in the category of low-sales farms—those with gross cash farm income less than $150,000. As a result of this change in the composition of the group, caution should be used in comparing farm business data across years.
July 17, 2018
On July 17, 2018, ERS revised data in the product Farm Income and Wealth Statistics to correct an omission of production data for potatoes in Alaska and Maine in 2015 and 2016, and a data processing error with 2016 State-level conservation payments. Including the potato production data increases U.S. potato and total cash receipts $60.3 million in 2015 and $152.9 million in 2016 and increases the value of the crop inventory adjustment $10.3 million in 2015. Other data or reports containing these variables (including gross and net farm income, gross and net cash farm income) were likewise revised. Overall, U.S. net farm income and net cash farm income were revised upward less than 0.3 percent in 2015 and 2016. To correct the data processing error—which incorrectly assigned some conservation program payments to certain States but did not affect national totals—data and reports including State-level direct government program payments were revised. All U.S. forecasts (for 2017 and 2018) that were released in February 2018 are unchanged. ERS products that relied on these data were also revised: State Fact Sheets, Charting the Essentials, and charts in the Farm Sector Income & Finances topic page (including Charts and Maps of U.S. Farm Income and Finances Data).
February 7, 2018
This was the third and final revision of the 2017 farm income forecast. Where appropriate, this release also updated any previous-year estimates to reflect additional information that has become available since the November 2017 release.
The 2016 crop cash receipts estimates were revised up $718 million (0.4 percent), with revisions to cash receipts for corn, dry beans, flaxseed, proso millet, mustard seed, safflower, and sunflower. The revisions reflect updated data from NASS on crop production and prices, as well as additional data on 2016/2017 monthly crop marketing patterns from NASS. Overall, the revisions to 2016 crop cash receipts were offset by a $759-million downward revision to the inventory adjustment for crops, also the result of incorporating additional data on monthly marketing patterns. In particular, 2016 cash receipts for corn were revised upward by $696 million (1.5 percent), with a similar downward revision to the inventory adjustment. The revisions to corn account for over 94 percent of the revisions to crop cash receipts and the crop inventory adjustment. In addition, the inventory adjustment for hogs was revised up $4 million, reflecting updated data from NASS on hog inventories.
The 2016 estimates of net rent and capital consumption were revised slightly (0.01 percent or less) due to updated GDP deflator data, which were used in the calculation of capital consumption to account for inflation.
November 29, 2017
The November 2017 release of the 2017 farm income forecast was the second revision since the initial February forecast. This release also revised the estimates for previous years to incorporate additional information that has become available since the August 2017 release.
Crop cash receipts were revised down $0.9 million for 2014, down $9 million for 2015, and up $4.1 billion (2.3 percent) for 2016. The 2014 and 2015 revisions reflect a change in NASS reported prices for potatoes, which also resulted in the crop inventory adjustment being revised down $63,000 in 2014 and $516,000 in 2015. The 2016 revisions reflect additional data on 2016/2017 monthly marketing patterns. Overall, the revisions to 2016 crop cash receipts were offset by a $4.1-billion downward revision to the inventory adjustment for crops, which was also the result of incorporating additional data on monthly marketing patterns. In particular, 2016 cash receipts for soybeans were revised upward by $4.0 billion, with a similar downward revision to the inventory adjustment. The November 29 release also includes additional changes to State-level cash receipt data released by NASS. These State-level changes include:
- State- and national-level cash receipts for grapefruit, lemons, oranges, tangelos and tangerines were revised upward, in total, by $93.2 million for 2016.
- State- and national-level cucumber cash receipts were revised upward by $1.4 million for 2016.
- State-level cash receipts for snap beans, lima beans, and cucumbers were revised for 2015. State-level changes were offsetting, with no change to the national totals for these commodities.
- State-level cash receipts for spinach, carrots, cabbage, mint, and green peas were revised for 2016. State-level changes were offsetting, with no change to national totals for these commodities.
- State-level mushroom cash receipts data for 2008-11 were revised to comply with methods (see cash receipts estimation procedure) for NASS multistate aggregate data. State-level changes were off-setting with no change to national totals.
The 2016 data on farm debt were revised up $705 million (0.2 percent) due to updated debt data from USDA's Farm Service Agency. This change revised interest expenses, net cash rent received by operator landlords, and net rent paid by less than 0.1 percent each.
August 30, 2017
With this update, the forecast for 2016 farm income becomes the first 2016 national estimate, and the first 2016 State estimates become available. The update also revises the initial 2017 forecast done in February 2017. The 2016 national and State estimates reflect newly available data on cash receipts from NASS and preliminary data from the 2016 Agricultural Resource Management Survey (ARMS).
Relative to the previous estimates released in February 2017, some 2014 and 2015 estimates—including production, sales, and percent of sales marketed by month from NASS, as well as macroeconomic variables sourced elsewhere—were revised to incorporate newly available data. The new information from NASS increased cash receipts and affected inventory adjustments in the income statement, as well as inventories carried in the sector balance sheet. Combined, total value of production increased by $59 million (0.01 percent) and $669 million (1.1 percent) for 2014 and 2015, respectively, as a result of these newly available data. Inventory values in the balance sheet decreased by $5.0 million, on average, in 2014 and 2015, or 0.003 percent of previously reported crop inventory data.
The macroeconomic variable changes affected estimated net rent received by farm operators, lowering it by $2 million in 2014 and increasing it $90,000 in 2015. Interest expenses for 2015 only were revised down $28 million, or 0.17 percent relative to previous estimates, and capital consumption was revised upward by $233 million and $200 million, or 0.47 and 0.48 percent of their previous values for 2014 and 2015, respectively.
Upward revisions to net farm income due to newly available data in 2014 and 2015 were $163 million (0.18 percent) and $497 million (0.62 percent), respectively.
In addition to changes to 2014 and 2015 estimates, mink cash receipt data for 2008-11 were revised upward by $61 million per year, on average (36-percent increase relative to previous data) due to corrections in underlying data. This change increased total sector-level cash receipts by 0.02 percent, on average, across the 4 years. Finally, capital consumption in 2013 was revised downward by $28 million, or 0.07 percent of the previous capital consumption value.
These changes in previously reported data also resulted in slight upward revisions to net farm income in each of the years that they occurred. Net farm income, due to correction of previously reported data, was revised upward by $68 million (0.09 percent) for 2008, $69 million (0.11 percent) for 2009, $46 million (0.06 percent) for 2010, $59 million (0.05 percent) for 2011, and $27 million (0.02 percent) for 2013.
With this release, nominal values are adjusted for inflation using the chain-type GDP deflator, base year = 2017. Database files, in CSV file format, were added for previous data releases made in August 2014, November 2014, February 2014, and August 2015.
March 8, 2017
On March 8, 2017, the Excel file "U.S. farm sector financial indicators, 2011-17F" was reposted to include estimates of farm debt by lender that were inadvertently labeled as NA in 2014 and 2015.
February 8, 2017
The 2015 cash receipts estimate is revised based on updates to data released by NASS on crop production and monthly crop marketing data. These changes, which also had minor effects on expenses and asset values, were slight, as net farm income for 2015 is revised downward to $80.875 billion—a $3-million decline (less than a hundredth of a percent) relative to the November estimate.
Also, the farm business average net cash income report for 2010 to the present has been further disaggregated to show additional detail. Farm businesses specializing in cotton and soybeans are now displayed separately and the "other crops" farm specialization entries are redefined to include peanuts, rice, mixed grains, and other field crops. The net cash farm income estimates for farm businesses now all reflect the most recent ARMS data, going back to 2010.
Finally, the inflation-adjusted values are revised for all data from 2013 through 2016, reflecting revisions to the chain-type price index (GDPCTPI) maintained by the Bureau of Economic Analysis, available on the St. Louis Federal Reserve website.
The calendar-year forecast for net farm income in 2016 was updated to reflect new information, resulting in a small (2.0%) increase in the income forecast relative to November. Primary drivers of the increase were crop and livestock receipts.
Compared to the November 2016 forecast for 2016 equity and assets, the February outlook has slightly improved. As a result, 2016 farm sector solvency ratios forecast in February 2017 are projected to strengthen slightly relative to their November 2016 predictions.
November 30, 2016
The November 2016 release of the 2016 farm income forecast is the second revision since the initial February forecast. The revision incorporates updated data from NASS, including newly available monthly marketing percentage data. Due to a revision by NASS, 2012 cucumber data for Missouri have been removed and miscellaneous crops data between 2008 and 2012 have been revised due to a prior omission. Additionally, ERS changed the way monthly prices are calculated for States/commodities for which price data are not available, with a minimal effect on commodity marketing-year cash receipt estimates for those crops. The change did not affect the 2016 farm income forecast but it affected the estimates for 2015 and previous years. The changes to net farm income range from a 0.06-percent decline to a 0.17-percent increase. Changes to farm sector equity range from a 0.02-percent decline to a 0.05-percent increase.
Beginning with the November 2016 forecast, an additional sector-level balance sheet is being published, which presents assets and debt by current and noncurrent component. ERS is also now publishing three additional financial metrics—current ratio, working capital ratio, and working capital-to-gross-revenues ratio—recommended by the Farm Financial Standards Council.
A new line in the Federal Government direct farm program payments report has been added to report payments for a new program called the Cotton Ginning Cost-Share (CGCS) program. The program provides cost-share assistance payments to cotton producers with an ownership share in the 2015 cotton crop. The program was established under the statutory authority of the Commodity Credit Corporation Charter Act. The sign-up period for the program was June 30, 2016, through August 5, 2016. Eligible producers receive in 2016 a one-time cost-share payment based on their share of 2015 cotton acres reported to USDA’s Farm Service Agency multiplied by their regional payment rate. There are 4 regional payment rates equal to 40 percent of the average ginning cost for that production region. Cost-share payments are capped at $40,000 per individual or entity.
August 30, 2016
With this update, the forecast for 2015 farm income becomes the first 2015 national estimate, represents the release of the first 2015 State estimates, and revises the initial 2016 forecast done in February 2016. The 2015 national and State estimates reflect newly available data on cash receipts from NASS and preliminary data from the 2015 Agricultural Resource Management Survey (ARMS). New information from the 2014 Tenure, Ownership, and Transition of Agricultural Land (TOTAL) survey is used to estimate net rental income to operator and nonoperator landlords for years 2014 forward. Cash receipt data for 2013 and 2014 were revised to incorporate newly released and revised data—including production, sales, and percent of sales marketed by month—from the National Agricultural Statistics Service.
Additionally, production expenses in 2011 were revised to incorporate updated Federal insurance premium data from USDA’s Risk Management Agency. Farm asset value and debt data in 2013 and 2014 were updated in order to incorporate changes in underlying ARMS data since the last release, as well as changes to debt data collected from administrative sources.
Beginning with the August 2016 forecast, Federal commodity insurance indemnity and premium data are now reported as a subcomponent of total commodity insurance indemnities and premiums. Additionally, a new method is used for incorporating World Agricultural Supply and Demand Estimates (WASDE) marketing-year price forecasts for corn, soybeans, wheat, sorghum, barley, oats, rice, and cotton into ERS calendar-year cash receipts forecast.
May 2, 2016
On May 2, 2016, the Agricultural Resource Management Survey data—the data source underlying the two tables "Farm-level average net cash income by farm typology and sales class" and "Farm business average net cash income by commodity specialization and region"—were revised to incorporate data quality improvements for 2012-16F and to correct a programming error that inadvertently excluded cash sales of hay and sugarcane/sugarbeets from ARMS crop cash income in 2013 and 2014. Correction of the programming error increased the reported average farm-level net cash income by $3,100–$3,500 per farm in each revised year 2013-16F (about 7 percent per year). For farm businesses, the increase in average per-farm net cash income was $6,300-$6,700 (5-6 percent). The farm sector-level forecasts and reports were not affected.
February 9, 2016
Final revision of 2015 forecast, using updated data form NASS and other administrative sources. Estimates from 2008-14 were revised to account for updated NASS data, and revised 2012 Agricultural Resource Management Survey (ARMS) data. The first forecast for the 2016 farm income and balance sheet is issued. Net farm income for 2012 is revised upward by $2.9 billion due to a change in the calculation of the gross imputed rental value of dwellings. The revision affects gross imputed rental value of dwellings and net farm income reported for the U.S. and each State. The revision does not affect the income reported for other years. Also, the 2012 estimates in the two tables "Farm-level average net cash income by farm typology and sales class" and "Farm business average net cash income by commodity specialization and region" were revised downward to correct a miscalculation of gross income from production of 'other livestock.' The correction only affects average cash income estimates on these two tables; sector level estimates of cash receipts, net cash farm income and net farm income were not affected. The correction resulted in a downward revision of $4,600 (4.1 percent), to the 2012 estimate of farm business average net cash income. The 2012 average net cash income estimates by region, commodity specialization, sales class and typology were also revised downward, by varying amounts.
November 24, 2015
Revision of 2015 forecast. Data from 2008 forward were revised with more recent data from NASS to account for revisions to sheep and lamb inventory data, more recent citrus and potato data, new commodity monthly marketing percentages data, and revisions to the 2013 and 2014 Agricultural Resource Management Survey (ARMS) data.
In addition, on November 24, 2015, ERS issued an errata to reflect corrections to the source State cash receipts data for the "all other animals and products" and "miscellaneous crops" categories for 2008-12 made by the National Agricultural Statistics Service for California, Delaware, Connecticut, Massachusetts, Louisiana, and Nevada. Changes to these States’ cash receipts estimates are reflected in U.S. total cash receipts estimates for 2008-12, as well as all of the income measures that use cash receipt data as a component (including net farm income, net cash income, value added, and farm-level and farm business average net cash income). The changes added 0.6 to 0.9 percent to U.S. total cash receipts in each of the years from 2008 to 2012.
October 14, 2015
Errata: On October 14, 2015, the report for Annual cash receipts by commodity, U.S. and States, 2008-15F was reposted. An original version of this report, posted August 25, 2015, did not return inflation-adjusted dollar values when "real" was selected as an option; nominal values continued to be displayed. This option now provides correct values. This was the only report in the set that was affected.
August 25, 2015
Release of 2014 final estimates, 2014 State estimates, and revision of the 2015 forecast. Data from 2008 forward were revised to account for changes in Agriculture Census weights, Census values and a change in estimation and forecast methodology.
February 10, 2015
Release of the 2015 forecast and revision of the 2014 forecast. For 2012-13, insurance premiums and indemnities (including crop insurance premiums and indemnities) are reported as separate income and expense items. Prior to this release, and for all other years, insurance indemnities were included in other farm income and premiums were included in miscellaneous expenses.
December 12, 2014
Errata: On December 12, 2014, the ERS farm income estimates for 2008-13 and the 2014 forecast, released on November 25, were revised to correct coding and data input sourcing problems in the underlying farm income database. Revisions also incorporate new data that became available following the November 25 release. While changes to individual State level estimates may be larger, at the U.S. level, these corrections and data revisions increased 2013 net farm income by 2 percent, to $129 billion. Also affected were the value of year-end inventories and related measures in the balance sheet, as well as production expenses, total value of production, gross and net value added, the value of inventory change, and their respective crop components in the income statement. Net farm income forecast for 2014 increased 0.4 percent, to $97.3 billion.
November 25, 2014
Beginning with the release of the 2012 Census of Agriculture in May of 2014, NASS announced the preparation and release of historical revisions to a number of important statistical products that would occur throughout the year. Most of these estimates are used in preparation of the farm sector value added and net income measures produced by ERS (see Documentation to the data product). The reports release included:
- Crop Values
- Field Crops
- Potatoes and Sweet Potatoes
- Rice Stocks
- Stocks of Grains, Oilseeds, and Hay
- Noncitrus Fruits and Nuts
- Meat Animals Production, Disposition, and Income
- Milk Disposition and Income
- Poultry Production and Value
- Cattle
- Chickens and Eggs
- Hogs and Pigs
- Honey
- Milk Cows and Production
- Sheep and Goats
- Citrus Fruits
- Vegetables
- Agricultural Land Values and Cash Rents
- Farms and Land in Farms
- 2012 Census of Agriculture
The result of incorporating the historical revisions for crop and livestock cash receipts was a relatively small reduction in livestock cash receipts (-0.18 to -1.33 percent) and a similar small percentage increase in crop receipts over the 2008-12 period (0.58 to 5.14 percent). Price and output revisions also resulted in changes for the value of crop and livestock production and estimated inventory changes. As a result, total value of agricultural production was revised downward by between 3-5 percent during 2008-12, with the largest reduction occurring in 2011. Changes to revenues from services and forestry (includes forest products sold, gross imputed rental value of farm dwellings, machine hire and custom work, and other farm related income) were also relatively minor for 2008-11. Forest products sold were the main component that changed, in the range of -3.41 to 1.12 percent. During 2012, all items in this category were updated to census values. There were no revisions to expenses during 2008-11.
August 26, 2014
Farm sector real estate asset values from 2008 to 2012 were revised in order to incorporate final estimate information from NASS on land values and land in farms. The value of machinery and motor vehicles assets was revised in 2012 to incorporate newly available census of agriculture information. Reflecting these changes, historical farm balance sheet values for farm sector equity (assets minus debt), and the sector debt-to-asset, debt-to equity, and equity-asset ratios were revised for data covering 2008-12.
March 11, 2014
On March 17, 2014, farm debt for 2002-06 in the Farm Sector Balance Sheet Table (located in Farm Income and Wealth Statistics) was revised to correct a programming error. As part of the February 2014 release, debt held by Farmer Mac at the end of each year for 2002-06 was added to the table for the first time, but was not reflected in calculations of total real estate debt or total farm sector debt. As a result, farm sector equity (assets – debt), and the sector debt-to-asset, debt-to equity, and equity-asset ratios were also incorrect from 2002-06. All series were revised to provide correct data.
February 11, 2014
Revisions were made to two data series since the November 2013 release. The amount of real estate debt held by Farmer Mac was previously shown as "not available" for 2002-06. However, as new information and analyst time became available, it was possible to provide these data. Additionally, a rounding error was corrected in the Net Farm Income series for 1950-59.
November 26, 2013
Following the August 2013 farm income and wealth statistics data release, errors were detected in several series. Many of the errors impacted national data, as well as data for each State. This is true for intermediate production expenses and labor expenses (2012), interest expenses (2008-12), real estate interest expenses (1988), nonreal estate interest expense (1971-80), and net rent to landowners (1971-80). Additionally, the value of inventory change for meat animals (2010-11) and real estate taxes excluding operator dwellings (1910-48) were found to include errors affecting only national (not State) data. The November 2013 release included corrected data.
August 27, 2013
Revised farm balance sheet estimates for 2002-11
Following the February 2013 update, a thorough review of the estimation process for USDA’s farm sector balance sheet was undertaken, and several changes were instituted to more accurately reflect farm sector debt. Estimation procedures were amended to improve handling of nonresponse to debt-related questions in the Agricultural Resource Management Survey (ARMS) and to recognize changes in the lending industry and associated administrative data over time.
Administrative data from all the major agricultural lenders are routinely adjusted using the most recent ARMS to estimate the portion of agricultural debt used for farm purposes. Comprehensive procedures were instituted to impute missing data in ARMS (due to respondent nonresponse) from 2002 to 2011, and these revised data were applied to estimate the share of lender-reported agricultural debt that was used for farm business purposes. Debt attributed to individuals and other lenders who do not routinely report farm lending activities was also re-estimated based on revised ARMS data. Finally, estimation procedures were amended to reflect Farmer Mac’s changing role in the farm debt market and to account for other changes in the availability of administrative data on agricultural lending. The impact of these changes was sizeable in some cases.
Revised farm income estimates for 2008-11
The above-mentioned revisions to the farm balance sheet estimates affected estimated interest expenses for farm operations. These changes, in turn, affected estimates of net farm income. Revisions are ongoing, but the August 2013 release incorporates revisions to interest expenses and income estimates for 2008-11.