Examining the eating patterns of the U.S. population is key to better understanding the determinants of dietary intake and diet-related health status. An analysis of the time that U.S. residents spend engaged in various activities—specifically food-related activities—may provide some insight into why nutrition and health outcomes vary across different segments of the population. Such insights could help improve programs and policies targeted at reducing obesity and improving diet quality.
USDA, Economic Research Service (ERS) collected data on U.S. residents’ time use and eating patterns in the ERS-developed Eating and Health Module (EHM) of the nationally representative American Time Use Survey (ATUS). Data in 2022–2023 were collected on secondary eating (eating while doing another activity considered primary by the respondent), height and weight, physical activity, self-assessed diet quality and health status, USDA food assistance program participation, grocery shopping, and meal preparation. This page provides select findings using EHM and ATUS data.
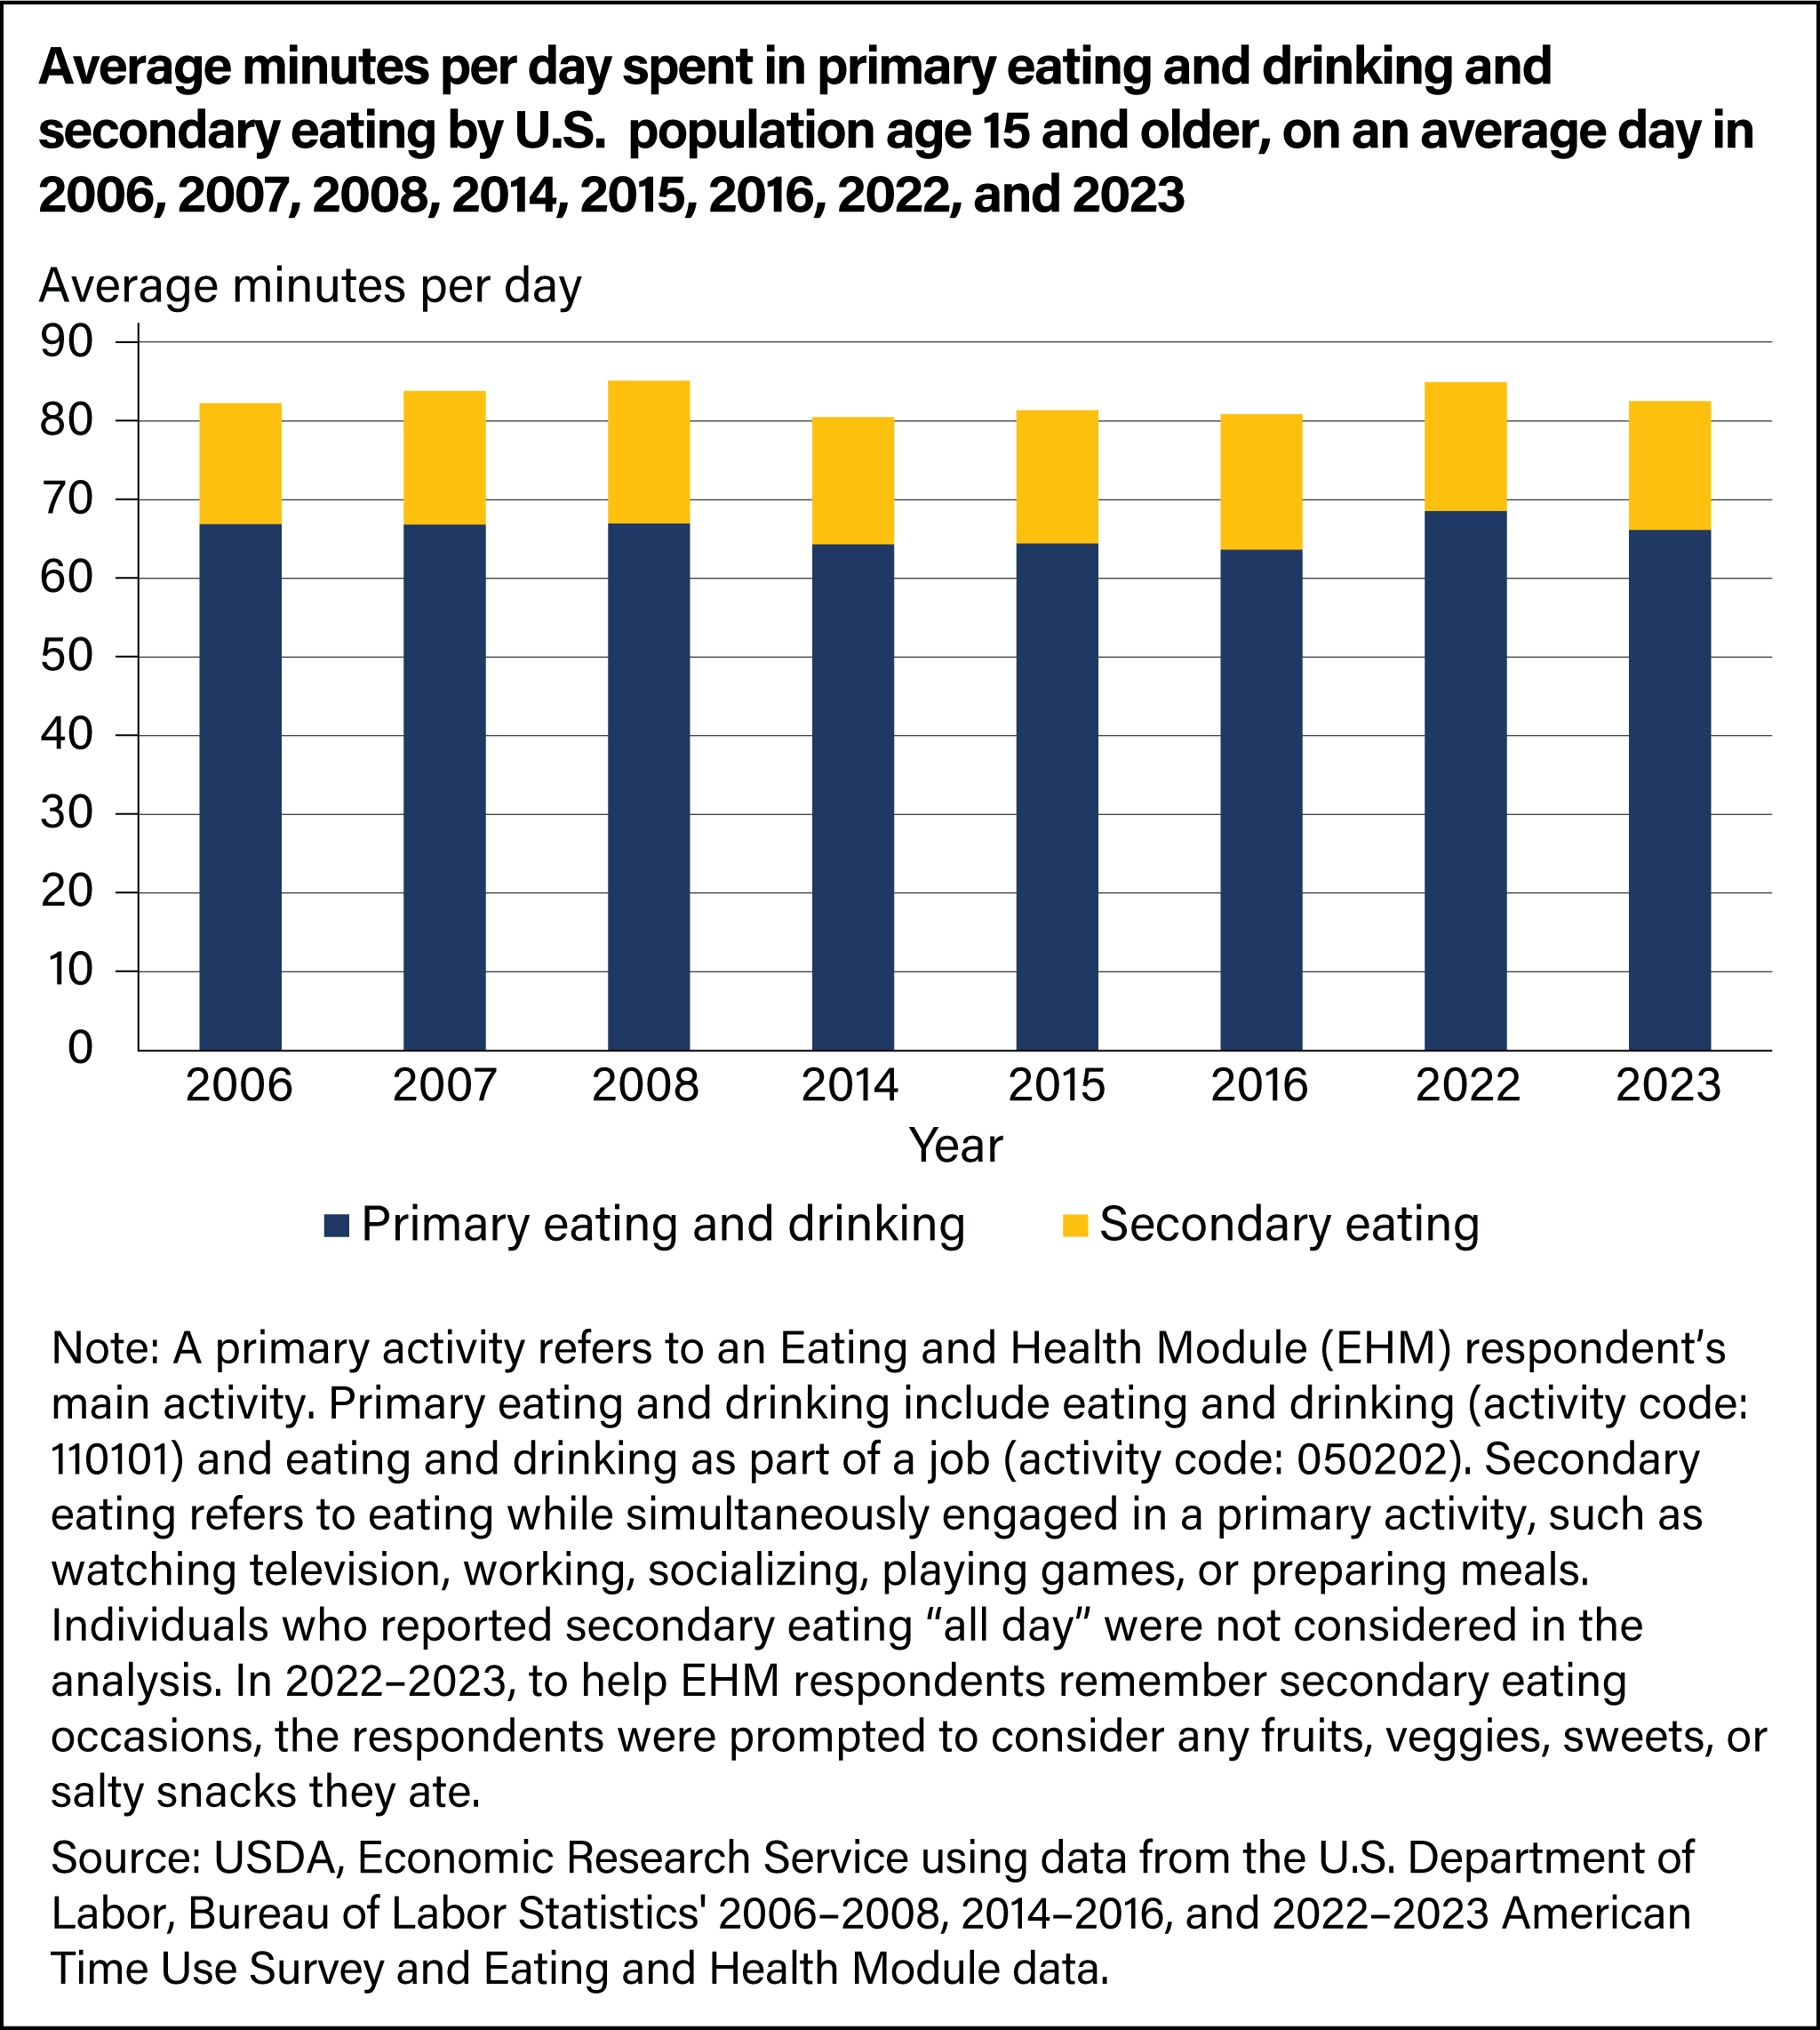
On an average day in 2023, individuals aged 15 and older spent 66.2 minutes eating and drinking as a primary or main activity, and 16.4 minutes eating as a secondary activity—that is, while simultaneously engaged in another primary activity such as watching television, driving, preparing meals, or working. The time spent on primary eating and drinking in 2023 was about 2.4 minutes lower than the average time in 2022. The time spent on secondary eating in 2023 was about the same as the average time in 2022. Overall, individuals spent more than 1 hour and 20 minutes (82.5 minutes) eating and drinking on an average day in 2023.

Download chart data in Excel format.
The top 5 named places for primary eating and drinking in 2023:
- Own home or yard: 76.3 percent
- Workplace: 10.1 percent
- Restaurant or bar: 6.9 percent
- Someone else’s home: 3.2 percent
- School: 0.9 percent
The top 5 named places for secondary eating in 2023:
- Own home or yard: 58.2 percent
- Workplace: 16.3 percent
- Own vehicle: 6.9 percent
- Someone else’s home: 4.5 percent
- Someone else’s vehicle: 1.9 percent
The top 5 named activities that accompanied secondary eating in 2023:
- Watching television and movies: 22.8 percent
- Work, main job: 20.4 percent
- Socializing and communicating with others: 5.1 percent
- Food and drink preparation: 4.0 percent
- Playing games: 3.0 percent
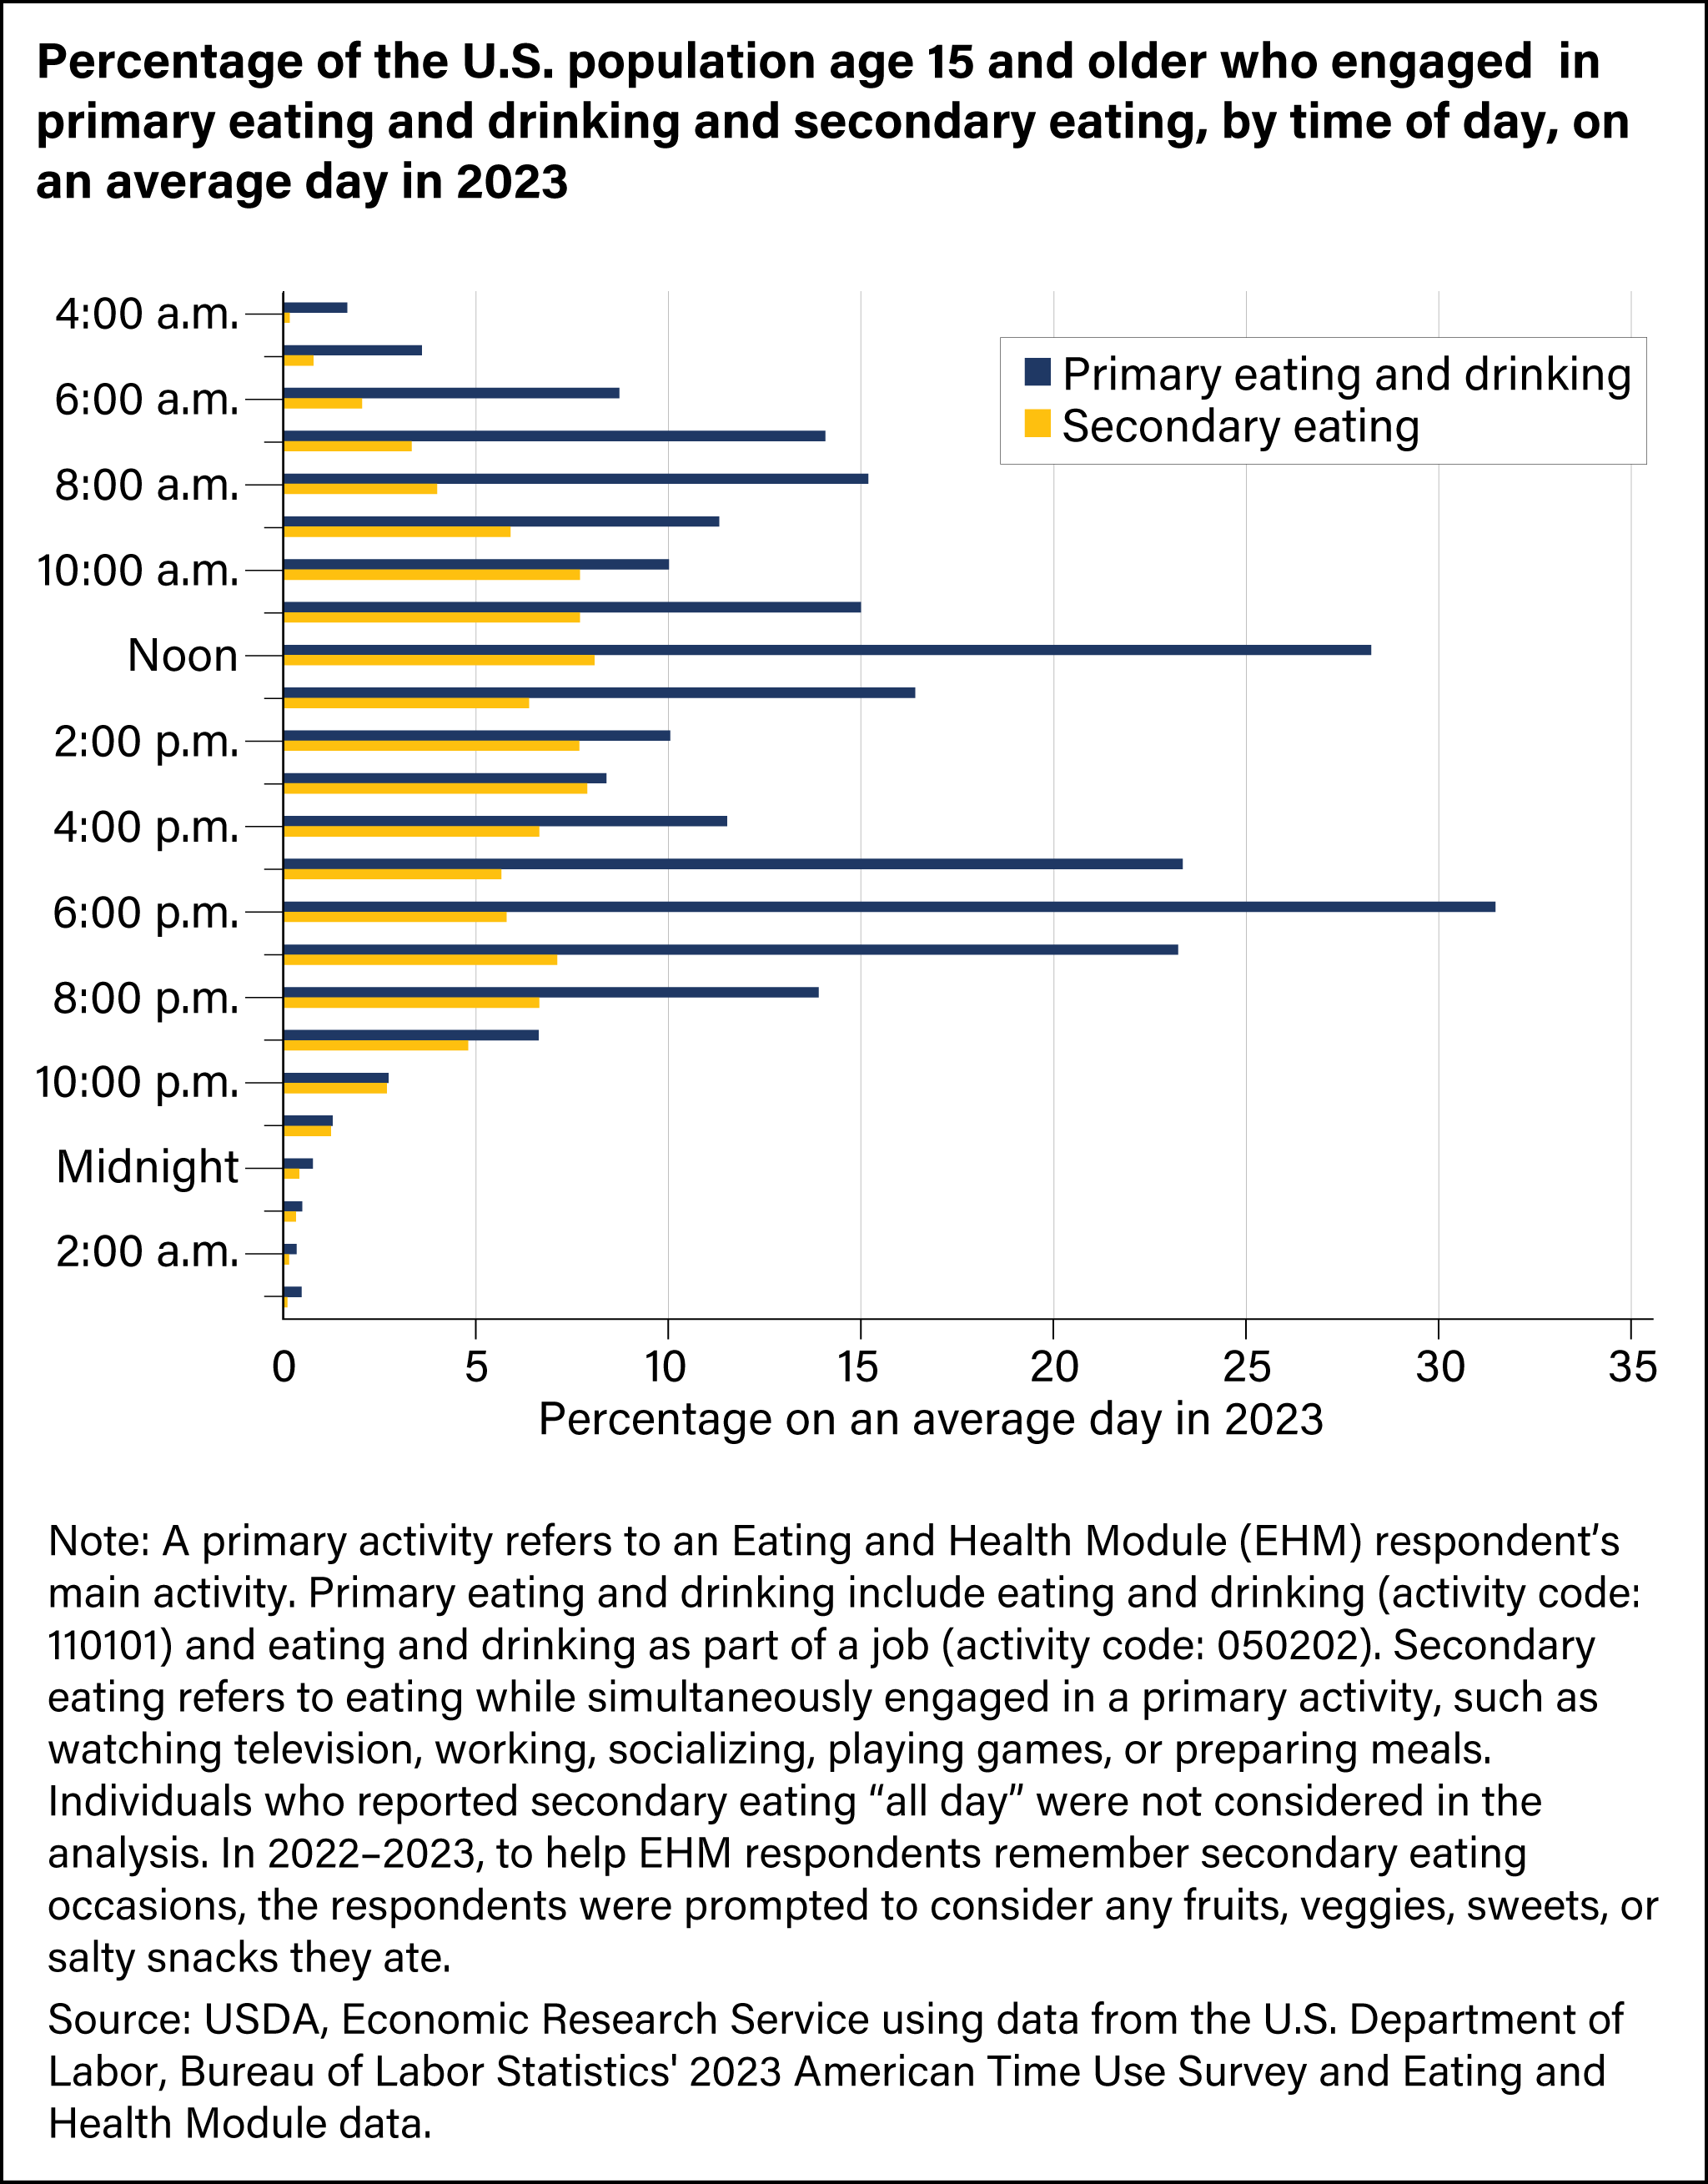
Individuals have 2 peak time blocks for primary eating and drinking—noon to 12:59 p.m. and 6:00 to 6:59 p.m. About 3 in 10 individuals engaged in primary eating and drinking during each of these peak time blocks in 2023. During each hour from 9:00 a.m. to 8:59 p.m., 5 percent or more of U.S. residents engaged in secondary eating.

Download chart data in Excel format.
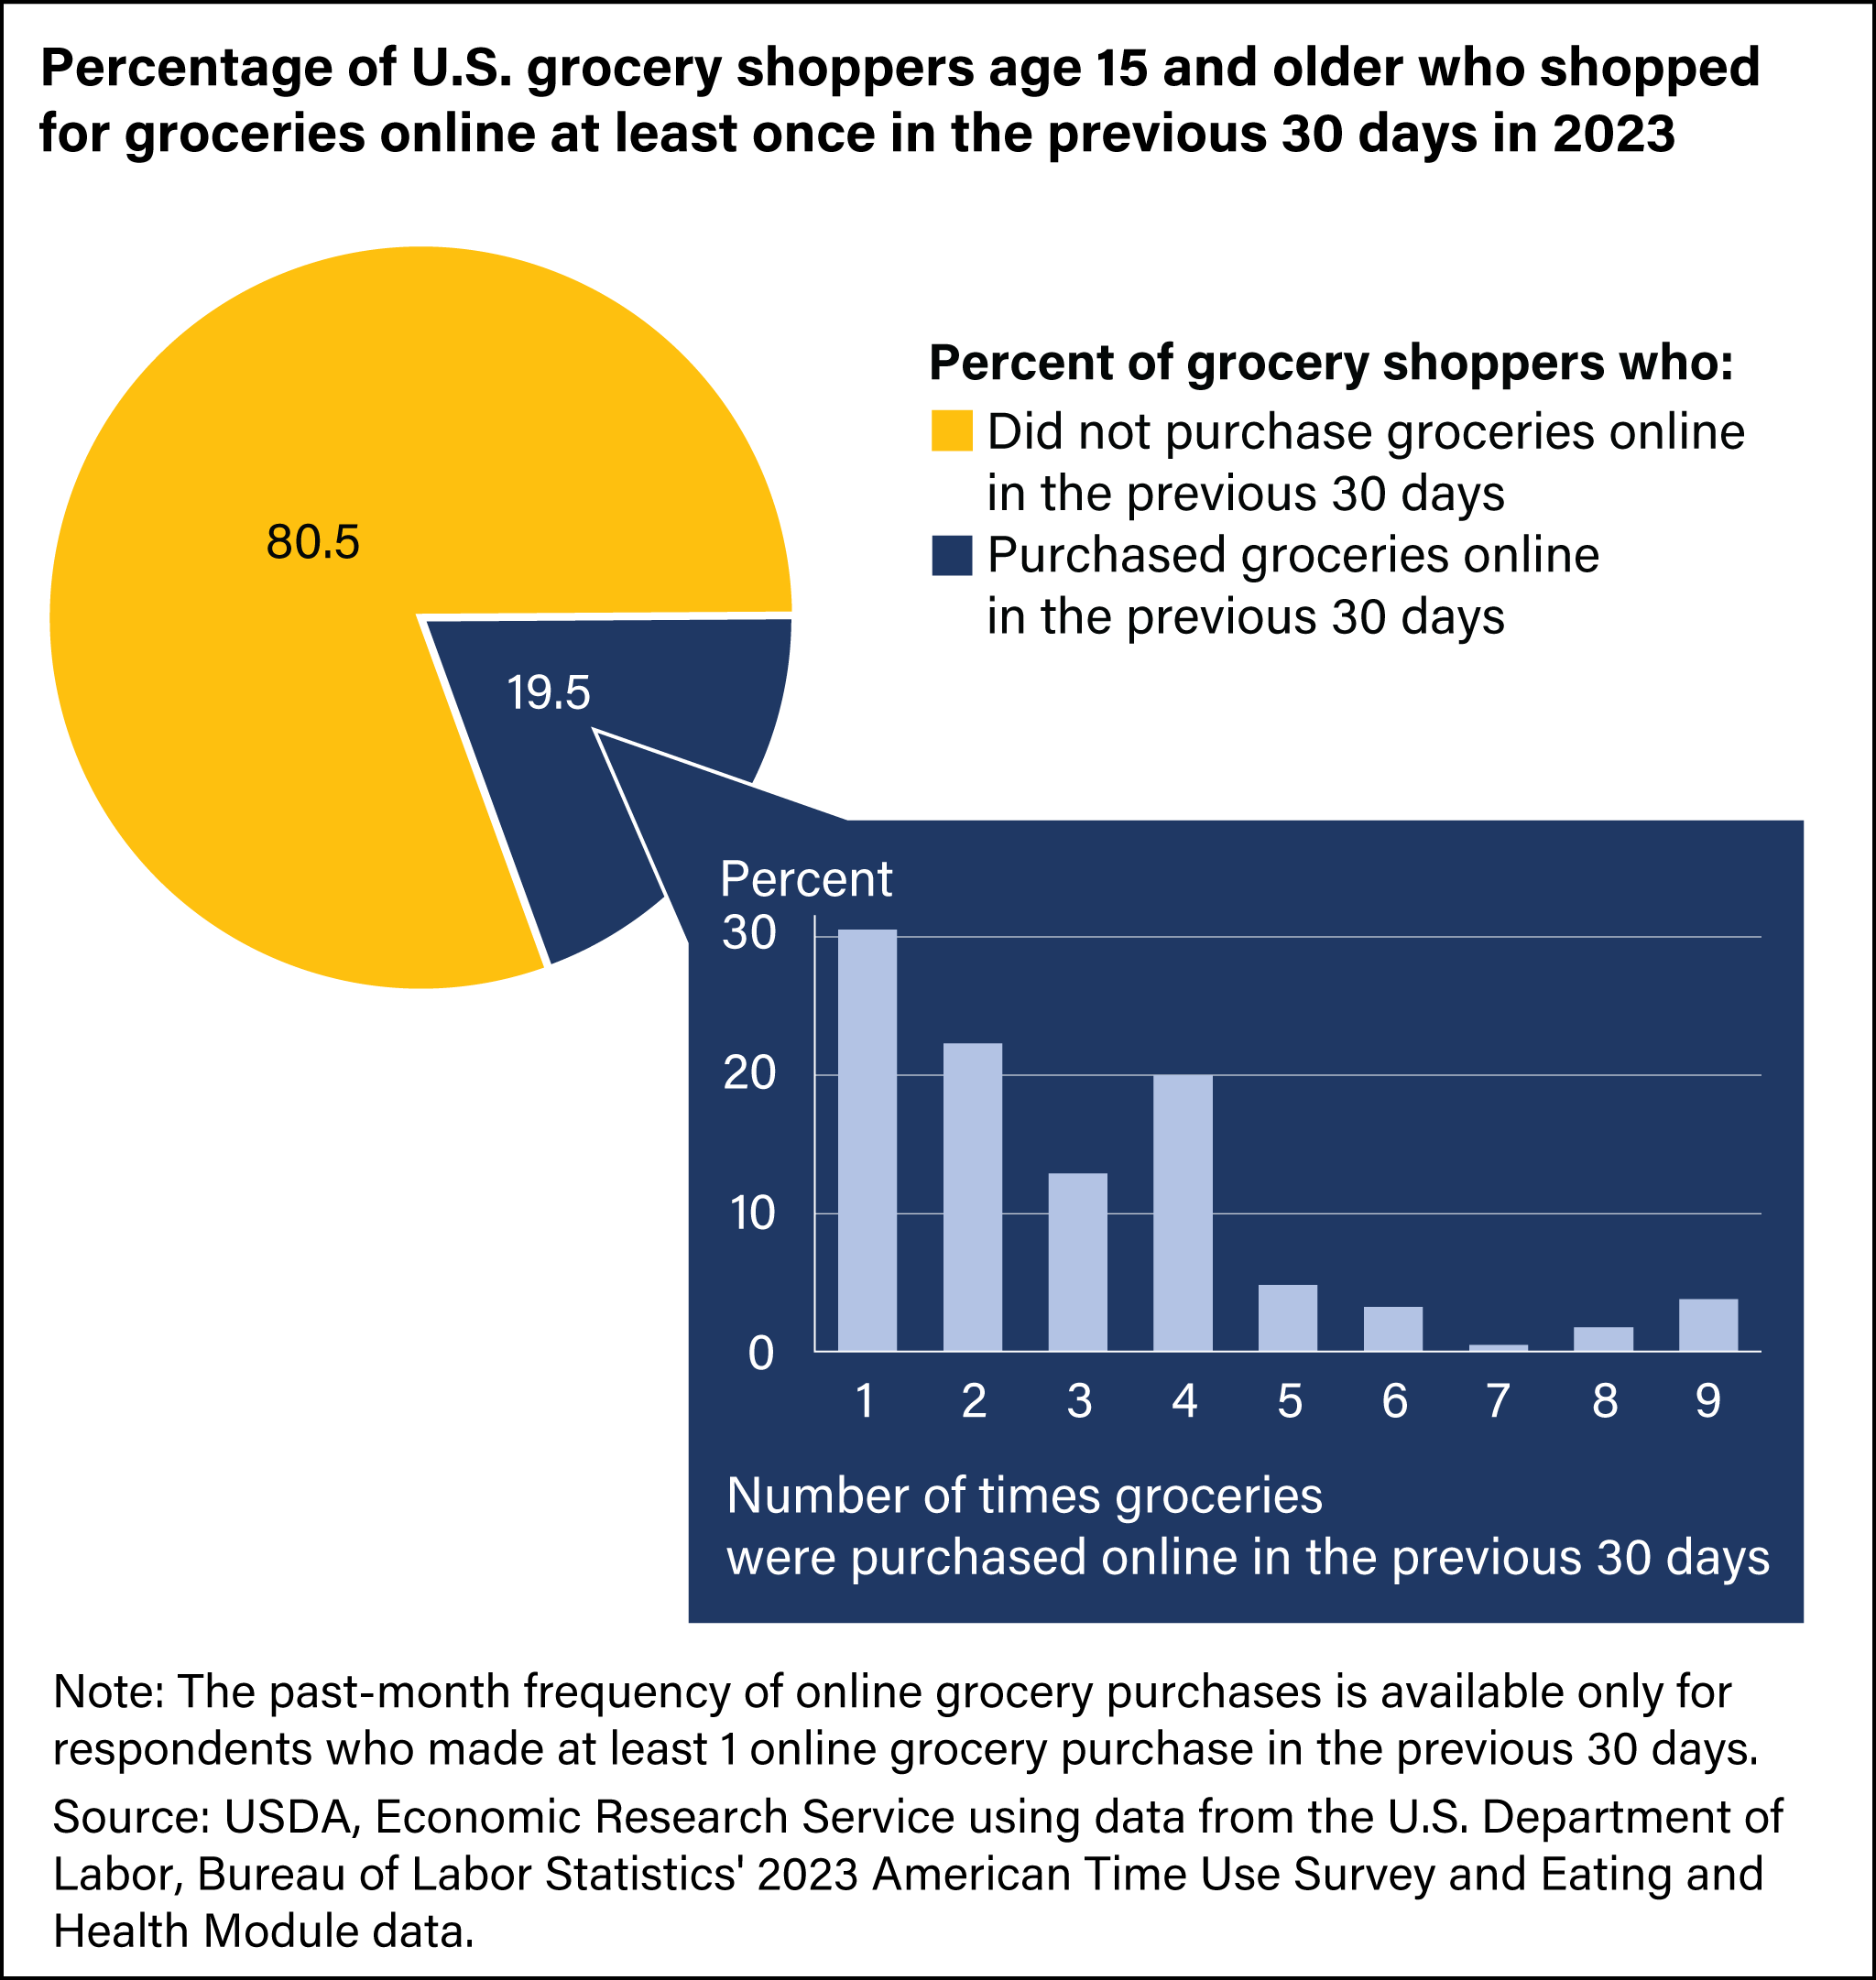
In 2023, more than half (52.6 percent) of individuals aged 15 and older reported that they usually did a lot or all the grocery shopping in their households; slightly less than one-third (32.3 percent) reported doing a little or some of the grocery shopping. Among individuals who report doing a little, some, a lot, or all of the grocery shopping in their households, almost 2 in 10 (19.5 percent) reported buying groceries online at least once in the last 30 days. Among these past-month online shoppers, 30.6 percent purchased groceries online once, 22.3 percent twice, and 47.1 percent three times or more. Among those who purchased groceries online at least once, more than half usually pick up their groceries (52.4 percent) and less than half usually had the groceries delivered (43.5 percent). The remaining 4.1 percent said that they do both.
The top 5 named reasons to purchase groceries online in 2023:
- Time constraints: 48.1 percent
- Convenience: 13.9 percent
- Transportation limitations: 4.5 percent
- Price: 4.4 percent
- Physical safety concerns: 3.8 percent
The top 5 named reasons for not purchasing groceries online in 2023:
- Like being able to see and touch products in person: 49.3 percent
- Higher prices online: 4.7 percent
- No access to the technology to place an order: 4.4 percent
- Delivery fee: 2.5 percent
- Delivery is not available in my neighborhood: 1.8 percent

Download chart data in Excel format.
Selected publications with findings and analysis from previous waves of the Eating and Health Module are available on the Documentation page.
