ERS Charts of Note
Subscribe to get highlights from our current and past research, Monday through Friday, or see our privacy policy.
Get the latest charts via email, or on our mobile app for  and
and 
Friday, October 16, 2015
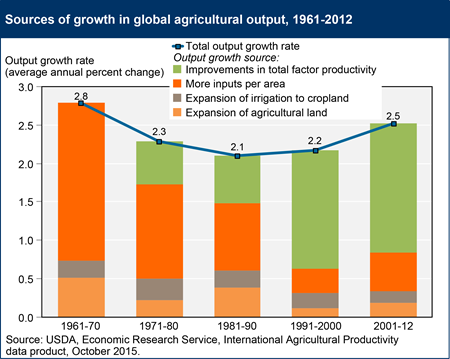
The average annual rate of global agricultural output growth slowed in the 1970s and 1980s, then accelerated in the 1990s and 2000s. In the latest period estimated (2001-12), global output of total crop and livestock commodities was expanding at an average rate of 2.5 percent per year. In the decades prior to 1990, most output growth came about from intensification of input use (i.e., using more labor, capital, and material inputs per acre of agricultural land). Bringing new land into agriculture production and extending irrigation to existing agricultural land were also important sources of growth. This changed over the last two decades, as input growth slowed. In 2001-12, improvements in productivity—getting more output from existing resources—accounted for about two-thirds of the total growth in agricultural output worldwide, reflecting the use of new technology and changes in management practices by agricultural producers around the world. This chart is based on the ERS data product, International Agricultural Productivity, updated October 2015.
Monday, April 27, 2015
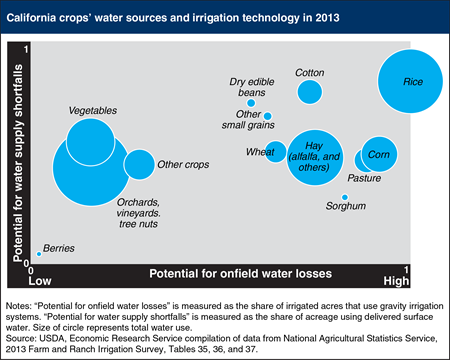
The California drought continues into 2015—as of April, 44 percent of the State is classified under the exceptional drought rating (meaning that there are exceptional and widespread crop/pasture losses; and shortages of water in reservoirs, streams, and wells creating water emergencies, as determined by U.S. Drought Monitor, produced by the interdepartmental U.S. Government National Integrated Drought Information System [NIDIS]). Farmers in California grow a wide variety of crops using off-farm surface water, groundwater, and—to a limited extent—on-farm surface water. Crops such as rice, cotton, and beans that are most dependent on off-farm surface water are the most vulnerable to reductions in snowpack and reservoir storage due to the ongoing drought. In addition, farmers use a variety of irrigation technologies to apply water. Farms that use the least amount of gravity irrigation, such as orchards/vineyards/tree nuts, vegetables, and berries, are the most able to limit evaporation losses during the drought. In many cases, the most capital intensive crops and irrigation systems, such as almond orchards using drip irrigation systems, have been strategically located over the most reliable water supplies, which is why these crops are more likely to continue irrigating during the drought. The crops that represent the predominant sources of agricultural water use—orchards, rice, hay, and vegetables—consume large amounts of water primarily because they are grown on large amounts of acreage. This chart visualizes information found in California Drought: Farm and Food Impacts in the ERS newsroom, updated April 2015.
_450px.png?v=9807.4)
Wednesday, March 11, 2015
By using new technologies, farmers can produce more food using fewer economic resources at lower costs. One measure of technological change is total factor productivity (TFP). Increased TFP means that fewer economic resources (land, labor, capital and materials) are needed to produce a given amount of economic output. However, TFP does not account for the environmental impacts of agricultural production; resources that are free to the farm sector (such as water quality, greenhouse gas emissions, biodiversity) are not typically included in TFP. As a result, TFP indexes may over- or under-estimate the actual resource savings from technological change. Growth in global agricultural TFP began to accelerate in the 1980s, led by large developing countries like China and Brazil. This growth helped keep food prices down even as global demand surged. This chart uses data available in International Agricultural Productivity on the ERS website, updated October 2014.
Monday, September 8, 2014
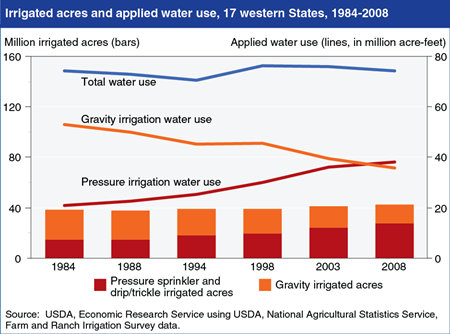
About 75 percent of irrigated cropland in the U.S. is located in 17 western States based on the 2008 Farm and Ranch Irrigation Survey (the most recent available), conducted by USDA’s National Agricultural Statistics Service. While the amount of irrigated land in the West has increased by over 2 million acres since 1984, the amount of water applied has declined slightly as irrigation systems have shifted toward more efficient methods. In 1984, 71 percent of Western crop irrigation water was applied using gravity irrigation systems that tend to use water inefficiently. By 2008, operators used gravity systems to apply just 48 percent of water for crop production while pressure-sprinkler irrigation systems, which can apply water more efficiently, accounted for 51.5 percent of irrigation water use. In 2008, much of the acreage using pressure irrigation systems included drip, low-pressure sprinkler, or low-energy precision application systems. Improved pressure-sprinkler systems resulted in remarkably stable agricultural water use over the past 25 years, as fewer acre-feet were required to irrigate an increasing number of acres. This chart is found in Water Conservation in Irrigated Agriculture: Trends and Challenges in the Face of Emerging Demands, EIB-99, September 2012.
Friday, February 28, 2014
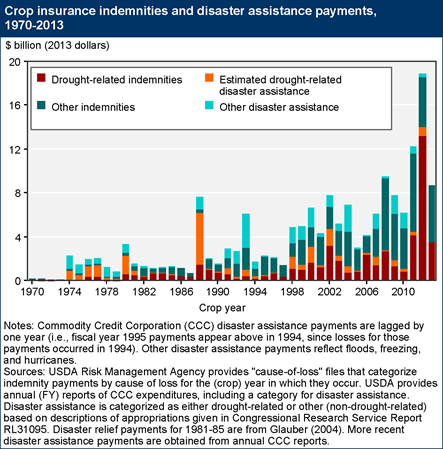
Drought is the leading single cause of production losses to crop farms, followed by excess moisture, hail, freezes, and heat. Over the past four decades, a portion of the farm losses from all these weather-related causes have been covered by a combination of crop insurance and disaster assistance payments. Over this period, crop insurance has gradually grown in significance and is now a major component of the Federal safety net for crop farmers. The rise in total insurance indemnity payments is due to a combination of expanded enrollment in crop insurance, increased liabilities due to higher yields and commodity prices, and a series of major droughts in recent decades, capped by the 2012 drought. More than 80 percent of the acres of major field crops planted in the United States are now covered by Federal crop insurance, which can help to mitigate yield or revenue losses for covered farms. Droughts also have a major impact on livestock producers, principally through their effect on feed prices. (The accompanying chart does not include livestock-related assistance or pasture/rangeland indemnity payments.) This chart updates one found in The Role of Conservation Programs in Drought Risk Adaptation, ERR-148, April 2013.
Wednesday, December 4, 2013
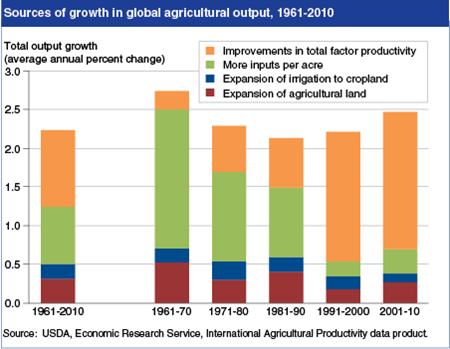
The average annual rate of global agricultural growth slowed in the 1970s and 1980s but then accelerated in the 1990s and 2000s. In the decades prior to 1990, most output growth came about from intensification of input use (i.e., using more labor, capital, and material inputs per acre of agricultural land). Bringing new land into agriculture production and extending irrigation to existing agricultural land were also important sources of growth. Over the last two decades, however, the rate of growth in agricultural resources (land, labor, capital, etc.) slowed. In 2001-10, improvements in productivity—getting more output from existing resources—accounted for more than three-quarters of the total growth in global agricultural output, reflecting the use of new technology and changes in management by agricultural producers around the world. This chart is found in the ERS data product, International Agricultural Productivity, on the ERS website, updated November 2013.
Friday, August 23, 2013
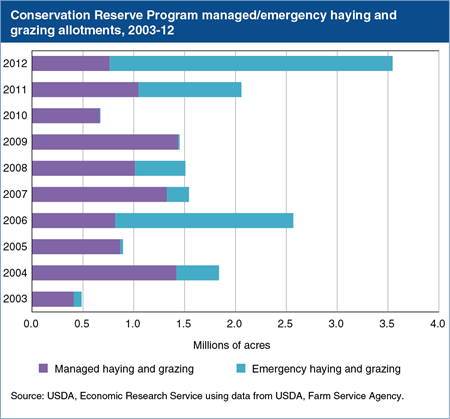
USDA’s Conservation Reserve Program (CRP) engages farmers in long-term (10- to 15-year) contracts to establish conservation covers on environmentally sensitive land. As of June 2013, about 27 million acres of farmland were enrolled in the program. An important provision within CRP is that under certain circumstances, farmers can utilize their CRP lands for managed or emergency haying and grazing. The haying and grazing of CRP land can provide important benefits to farmers, particularly during major droughts when other sources of livestock feed are scarce, and, if done correctly, can also improve the environmental value of the conservation covers. During the 2012 drought, farmers conducted emergency haying and grazing on almost 2.8 million acres and managed haying and grazing on another 700,000 acres. This chart is found in the Amber Waves article, “The Role of Conservation Program Design in Drought-Risk Adaptation,” July 2013.
Monday, May 20, 2013
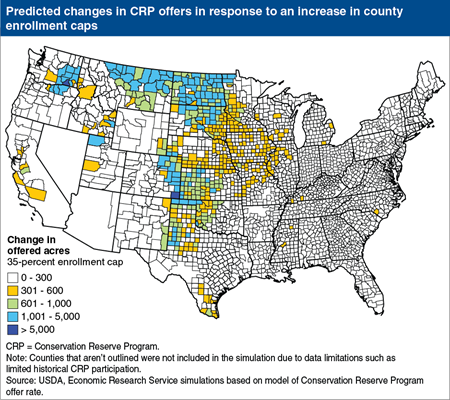
Farmers can adapt to their local climate in many ways, including through participation in USDA programs. In regions of the country that face higher levels of drought risk, farmers are more likely to offer eligible land for enrollment in the Conservation Reserve Program (CRP). As a consequence, CRP is both more competitive in these regions and drought-prone counties are more likely to face a binding CRP acreage enrollment cap. When counties are near their enrollment cap, farms are less likely to offer eligible land for CRP because those offers are less likely to be accepted for enrollment. In simulations of offer rates based on observed historical data, a national increase in the county CRP acreage enrollment cap to 35 percent of cropland in each county (from the current level of 25 percent), results in more offers from eligible farmers in drought prone regions of the Great Plains and the Intermountain West. This map is found in the ERS report, The Role of Conservation Programs in Drought Risk Adaptation, ERR-148, April 2013.
Monday, May 6, 2013
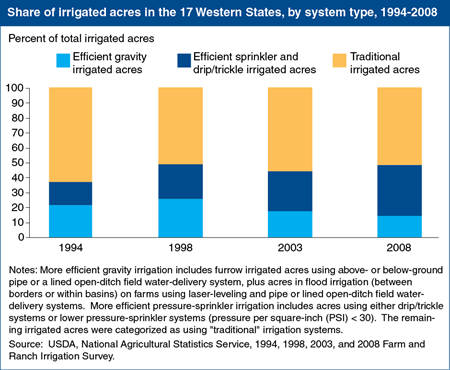
U.S. agriculture accounts for 80-90 percent of the Nation’s consumptive water use (water lost to the environment by evaporation, crop transpiration, or incorporation into products). The 17 Western States account for nearly three-quarters of U.S. irrigated agriculture. While substantial technological innovation has already occurred in irrigation systems, significant room for improvement in farm irrigation efficiency still exists. Between 1994 and 2008, the combined share of Western irrigated acres using improved gravity-flow and low-pressure sprinkler systems has increased but the rate at which traditional irrigation systems have been replaced with more efficient, improved systems has slowed over the past decade. This chart comes from the Amber Waves September 2012 finding, Improving Water-Use Efficiency Remains a Challenge for U.S. Irrigated Agriculture.
Thursday, April 4, 2013
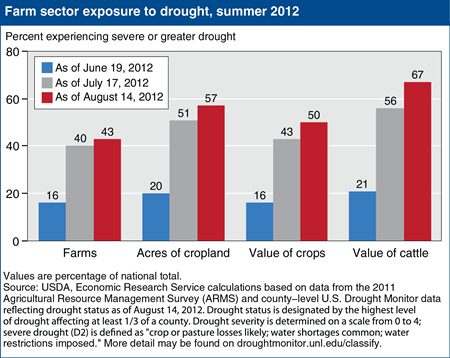
As of mid-August 2012, 43 percent of farms in the United States were experiencing severe or greater levels of drought and another 17 percent were facing moderate levels of drought (for a description of severity levels, see droughtmonitor.unl.edu/classify). A striking aspect of the 2012 drought was how the drought rapidly increased in severity in early July, during a critical time of crop development for corn and other commodities. The chart shows the progression from mid-June to mid-August of severe or greater drought within the agricultural sector. While drought conditions eased some during early September, for most crop production, exposure to drought during June-August determined the drought’s impact on agricultural production. From mid-June to mid-August, the share of farms under severe or greater drought increased from 16 to 43 percent of all farms. Total cropland under severe or greater drought increased from 20 to 57 percent, while total value of crops exposed increased from 16 to 50 percent. As of mid-July, areas with over half of the value of cattle production were already exposed to severe drought; by mid-August, almost two-thirds were exposed. This chart is based on the table found in U.S. Drought 2012: Farm and Food Impacts on the ERS website, updated March 2013.
Friday, October 26, 2012
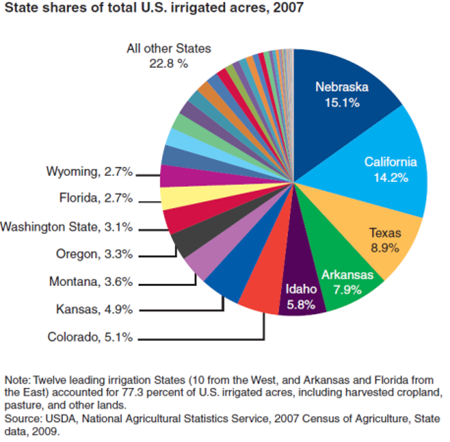
In 2007, 56.6 million farmland acres were irrigated across the United States. About 16.6 percent of U.S. harvested cropland acres were irrigated, while only 1.2 percent of pastureland acres were irrigated. Nearly three-quarters of U.S. irrigated agriculture occurred in the 17 contiguous Western States, including 73 percent of harvested irrigated cropland and 94 percent of irrigated pastureland. For 2007, 12 leading irrigation States accounted for 77.3 percent of all irrigated acres, including harvested cropland, pasture, and other lands. Nebraska's 8.6 million irrigated acres led all other States (15.1 percent of the U.S. total), followed by California with 8.0 million acres (14.2 percent), and Texas with 5 million acres (8.9 percent). Two Eastern States-Arkansas and Florida-were among the 12 leading irrigation States. Arkansas accounted for 4.5 million acres (7.9 percent) and Florida for 1.6 million acres (2.7 percent) of total U.S. irrigated acres. This chart comes from Water Conservation in Irrigated Agriculture: Trends and Challenges in the Face of Emerging Demand, EIB-99, September 2012.
Thursday, September 13, 2012
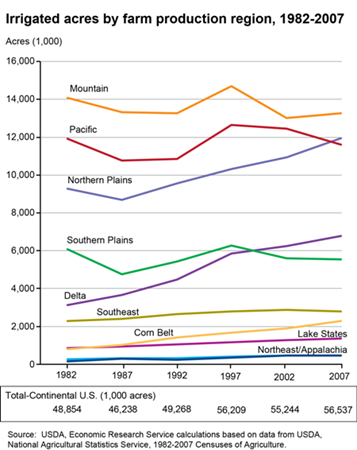
From 1982 to 1997, irrigated acres increased for most farm regions. Since 1997, however, most regions have seen either slow growth or a decline in irrigated acres. The largest growth in irrigated acres since 1997 is concentrated in the Northern Plains, Delta, and Corn Belt regions. Growth rates in the Northern Plains (primarily Nebraska) pushed irrigated acreage (at 11.9 million acres in 2007) above acreage irrigated in the Pacific region (at 11.6 million acres). Similarly, since 1997, irrigated acres in the Delta region surpassed acres irrigated in the Southern Plains. Over the same period, irrigated acres contracted in the relatively arid Mountain, Pacific, and Southern Plains regions. This chart comes from Water Conservation in Irrigated Agriculture: Trends and Challenges in the Face of Emerging Demand, EIB-99, September 2012.


