
Farm sector exposure to drought worsened during the summer of 2012
- by Economic Research Service
- 4/4/2013
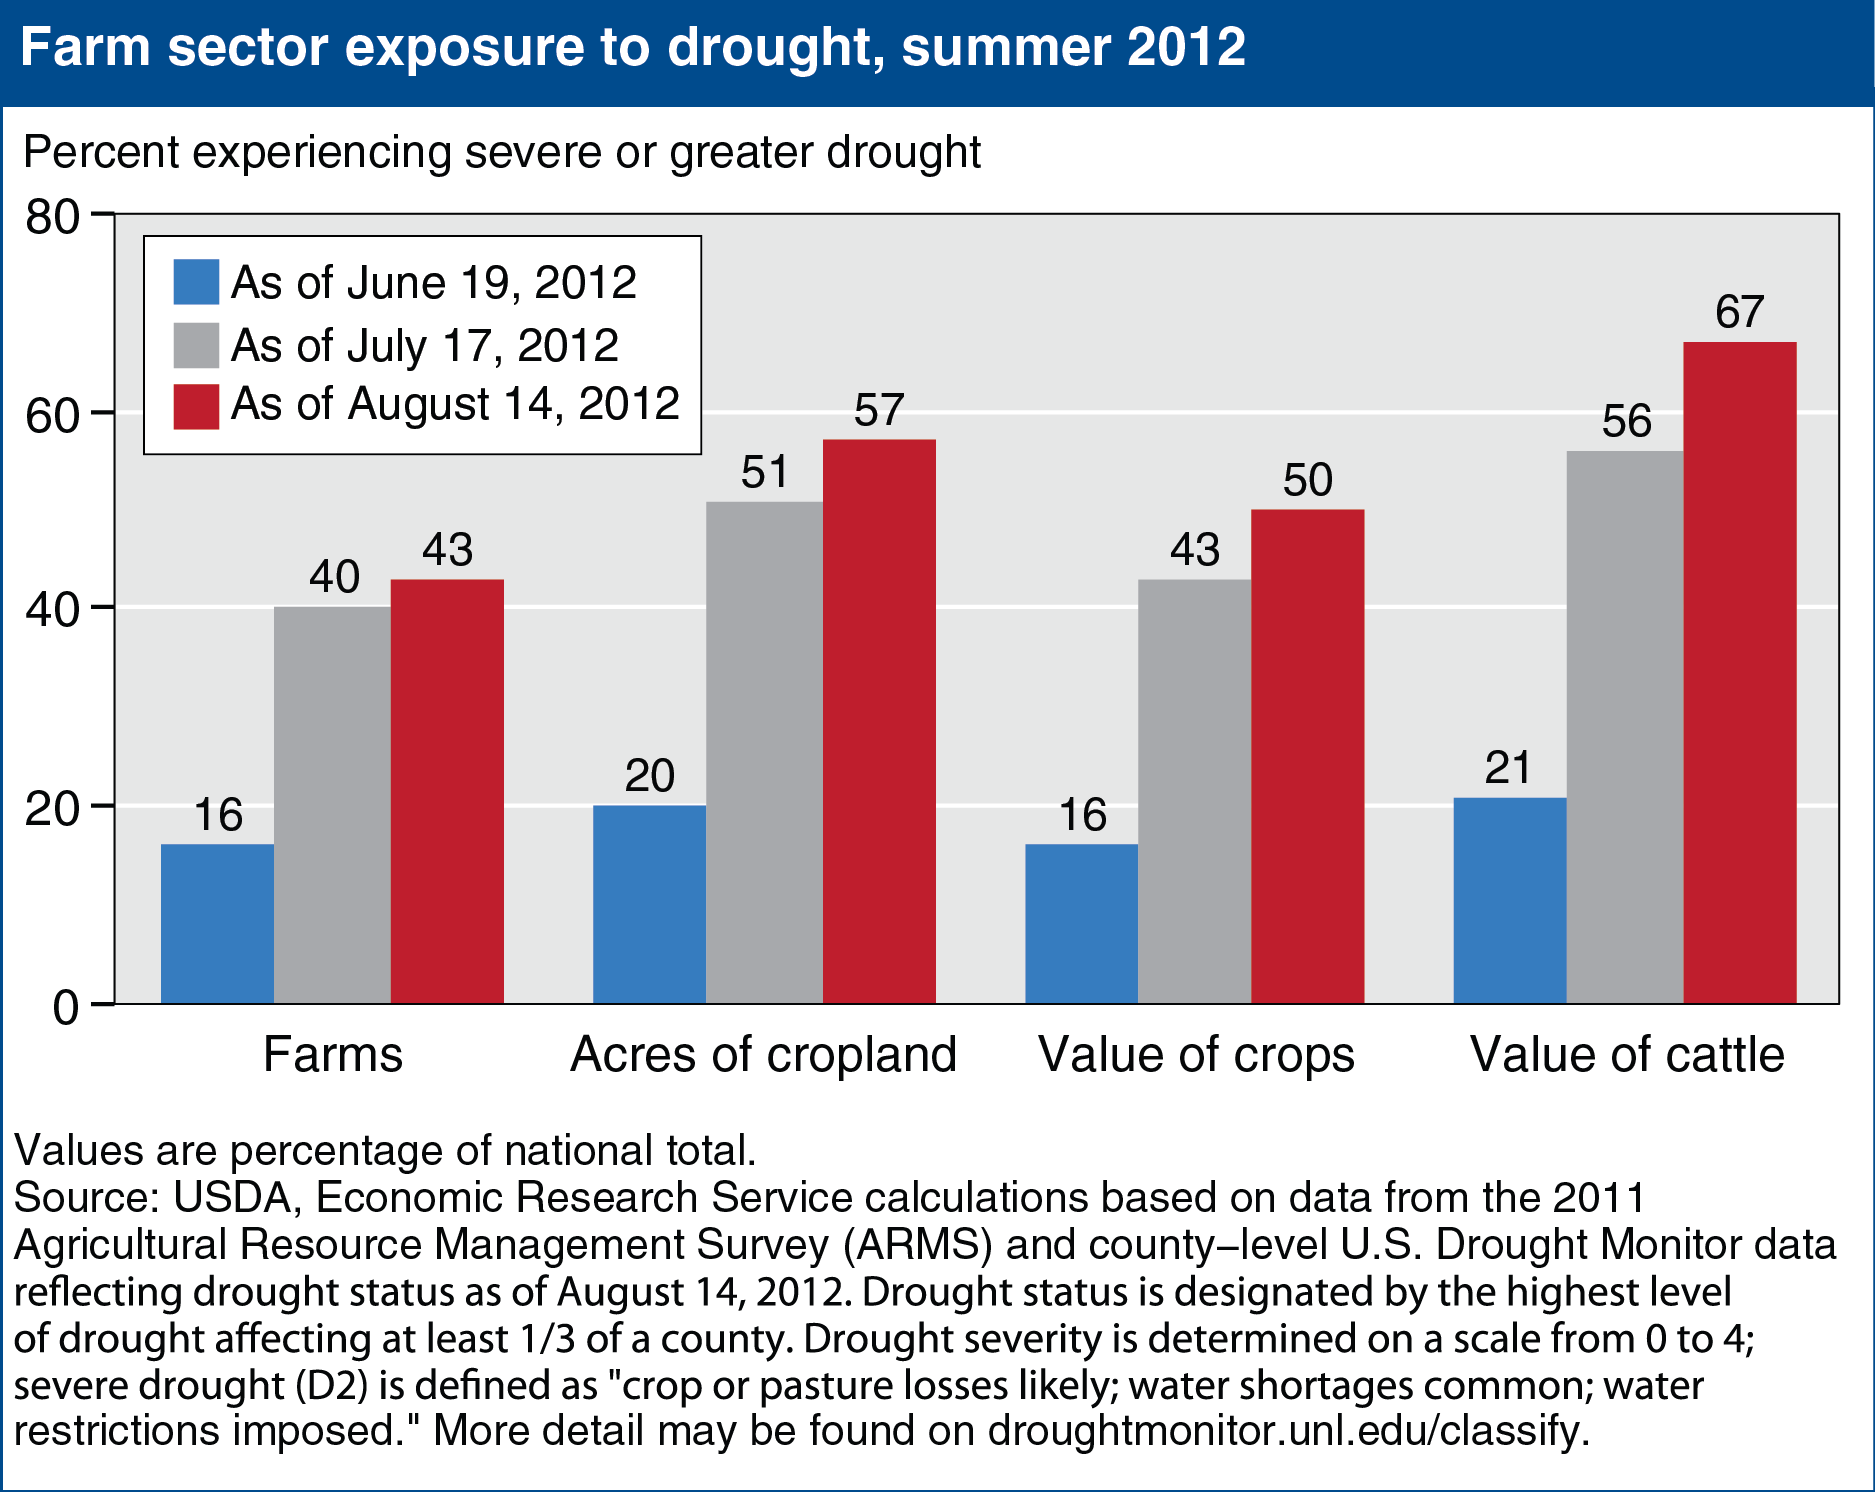
As of mid-August 2012, 43 percent of farms in the United States were experiencing severe or greater levels of drought and another 17 percent were facing moderate levels of drought (for a description of severity levels, see droughtmonitor.unl.edu/classify). A striking aspect of the 2012 drought was how the drought rapidly increased in severity in early July, during a critical time of crop development for corn and other commodities. The chart shows the progression from mid-June to mid-August of severe or greater drought within the agricultural sector. While drought conditions eased some during early September, for most crop production, exposure to drought during June-August determined the drought’s impact on agricultural production. From mid-June to mid-August, the share of farms under severe or greater drought increased from 16 to 43 percent of all farms. Total cropland under severe or greater drought increased from 20 to 57 percent, while total value of crops exposed increased from 16 to 50 percent. As of mid-July, areas with over half of the value of cattle production were already exposed to severe drought; by mid-August, almost two-thirds were exposed. This chart is based on the table found in U.S. Drought 2012: Farm and Food Impacts on the ERS website, updated March 2013.