
As the rural veteran population declined, the share that were age 65 or older increased
- by Tracey Farrigan
- 7/1/2020
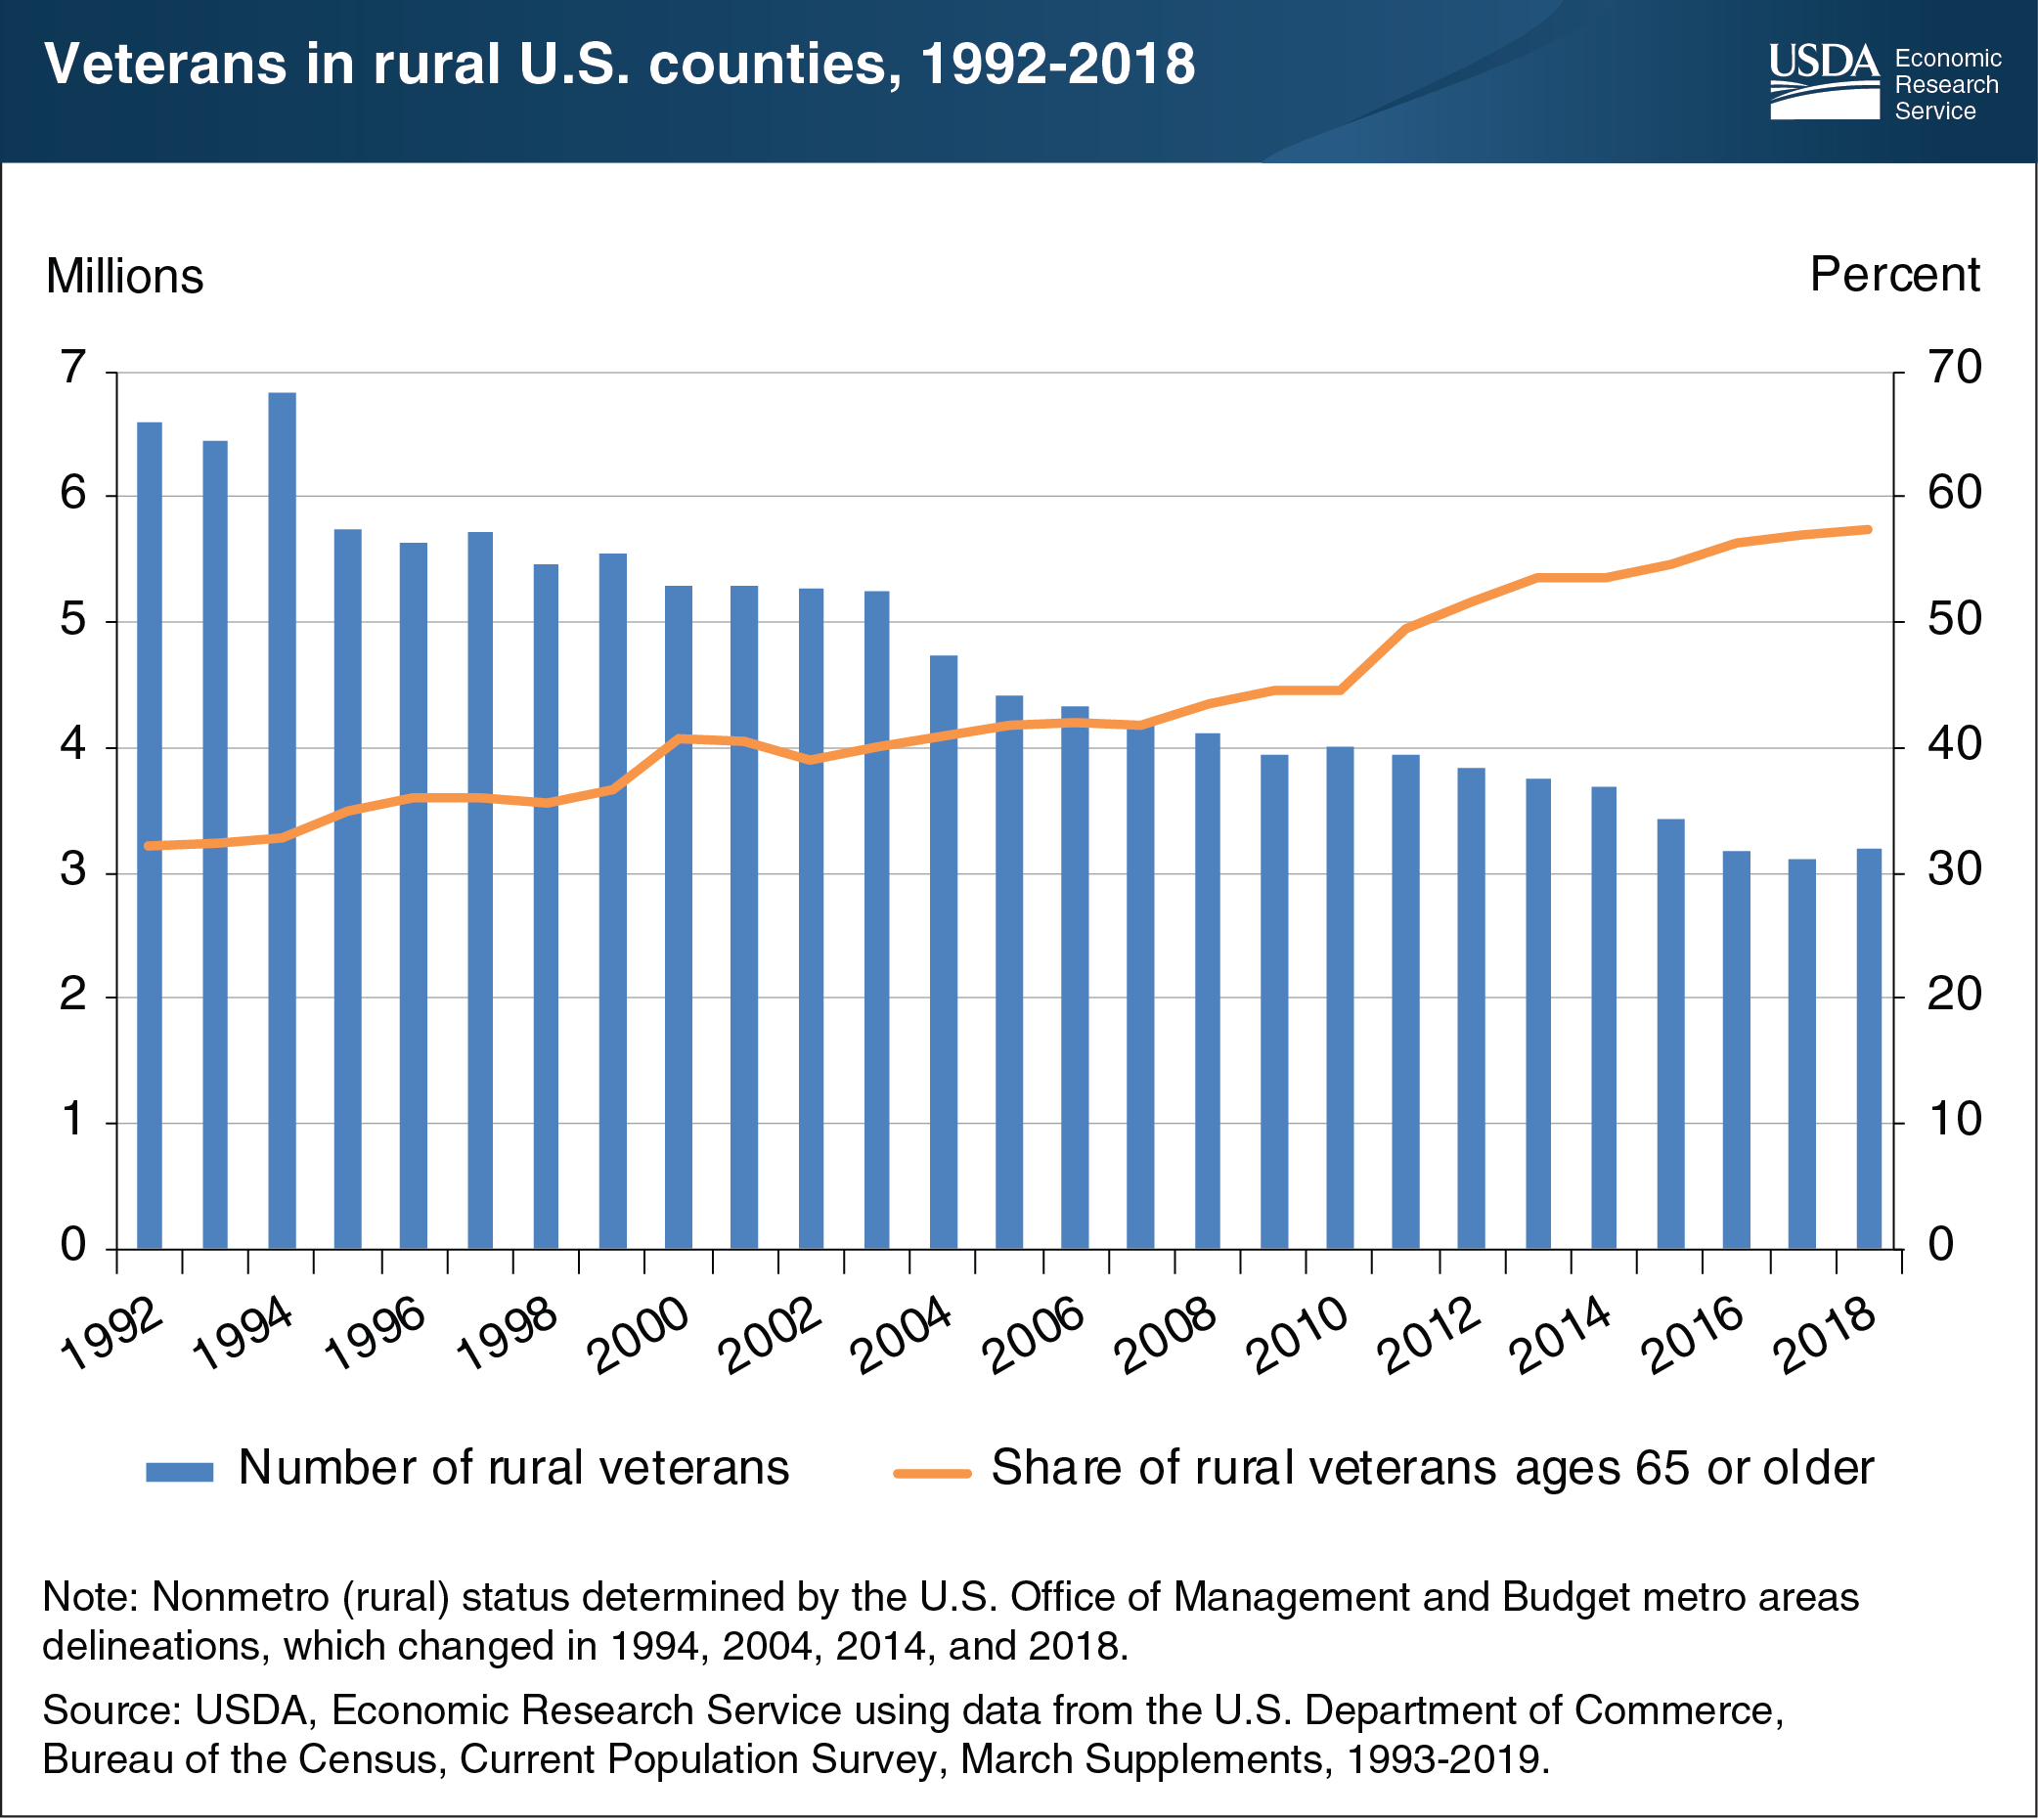
Veterans are a rapidly aging and increasingly diverse group, accounting for nearly 10 percent of the rural adult population in 2018. However, the number of veterans living in rural (nonmetro) areas has declined from 6.6 million in 1992 to 3.2 million in 2018. This decline was due largely to a drop in the size of the active military population (from about 3 million in 1992 to 1.3 million in 2018), natural decrease due to aging, and a tendency for younger veterans to settle in urban (metro) areas. Nearly 60 percent of rural veterans were ages 65 or older in 2018, and half of that group were ages 75 or older. By comparison, in 1992, the share of rural veterans age 65 or older was closer to 30 percent. This trend suggests that the number of rural veterans may continue to decline in the future. In addition, whether due to their military service or because of their age profile, over 30 percent of rural veterans reported having a disability in 2018, compared with about 15 percent of nonveterans. Older age and a higher incidence of disabilities may make rural veterans, as a group, increasingly vulnerable. This chart updates data found in the Economic Research Service report, Rural Veterans at a Glance, released November 2013.