
Record high table egg lay rates in the second half of 2019 drove up egg production despite reduced flock size
- by Kim A. Ha
- 4/10/2020
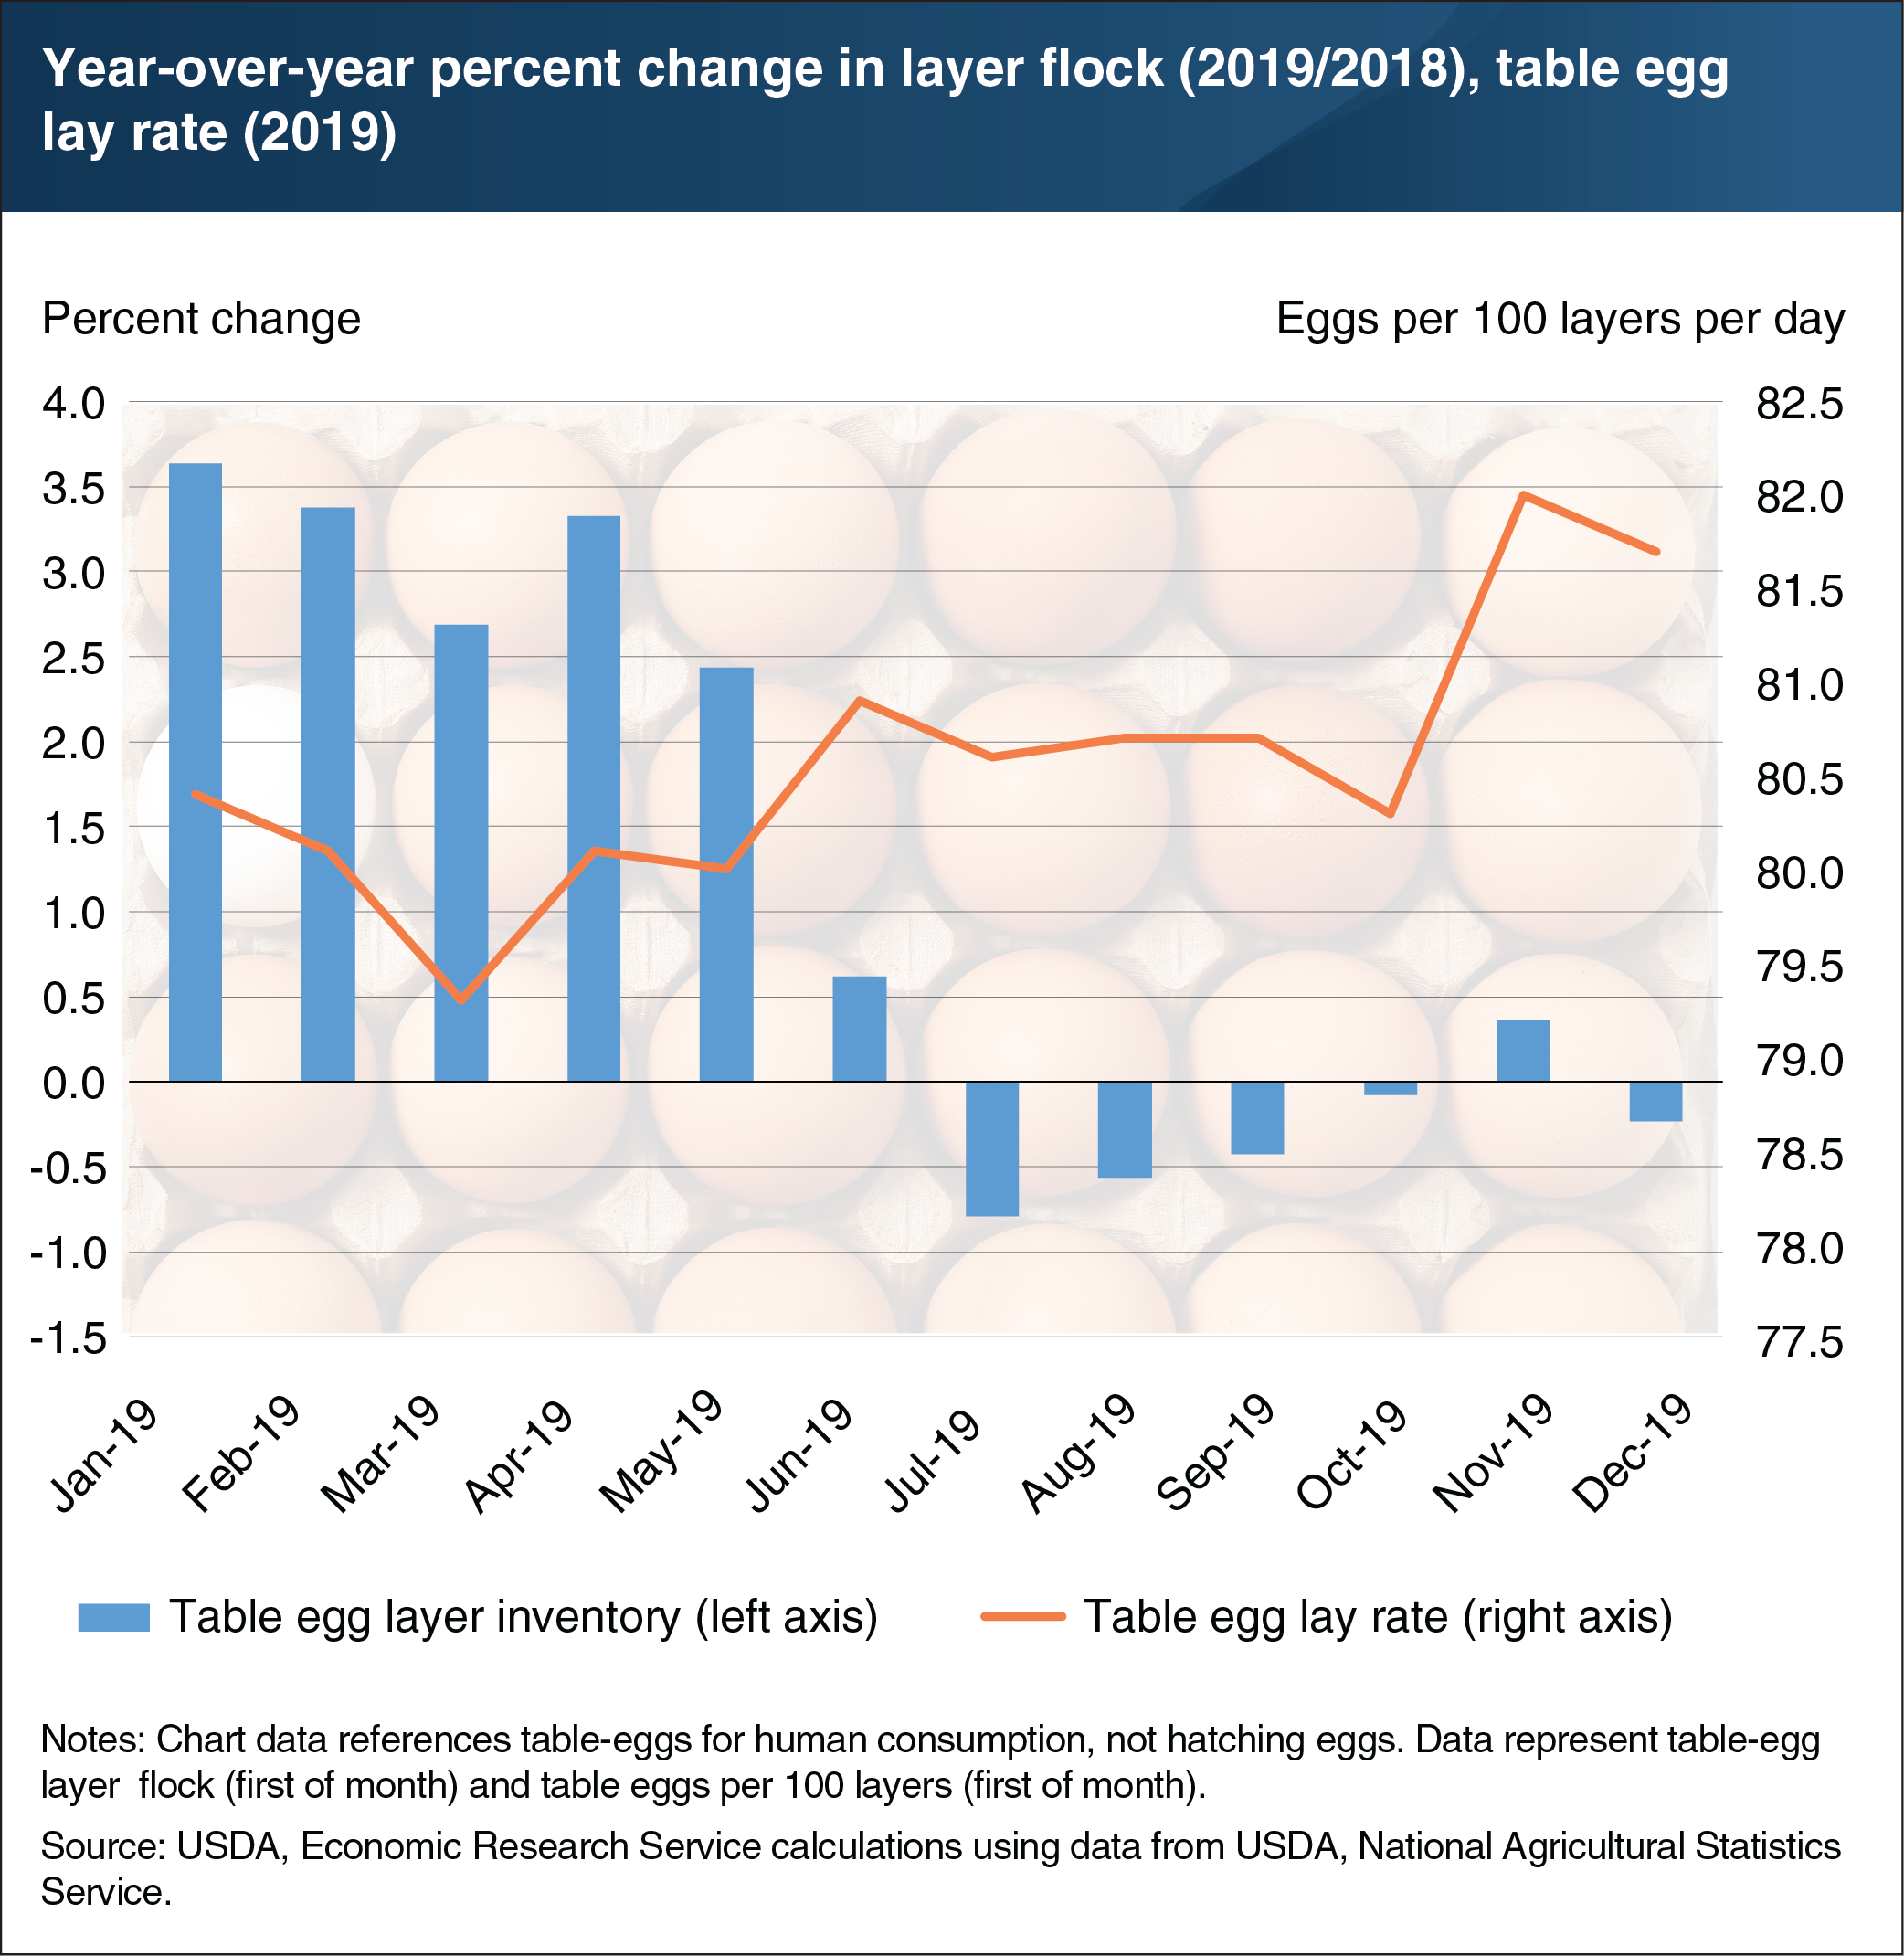
In 2019, the United States produced more than 8 billion dozen table eggs, a 2.8-percent increase over 2018. Much of this growth came in the first half of 2019, driven by a larger layer flock—a flock of egg-laying hens—as well as higher egg lay rates. However, this growth resulted in an oversupply of eggs, which put significant downward pressure on egg prices. In response, the industry took measures beginning in June 2019 to downsize the layer flock. For the remainder of 2019, the layer flock inventory fell below or hovered around previous year levels. Nonetheless, table egg production in the second half of 2019 remained 1.5 percent higher over 2018 because of record-high lay rates. On November 1, 2019, the U.S. table egg lay rate reached 82 eggs per 100 layers, the highest rate on record. Lay rates, which have increased by approximately 11 percent since 2000, have been an important driver of growth in egg production. Several factors can affect lay rates, including day length, hen age, nutrition, disease, genetics, and flock management. Egg production decreases with shorter days, particularly during fall and winter, but this can be remedied with artificial lighting. Younger hens and older hens do not produce as many eggs as those hens of peak production age (approximately 26 weeks). Finally, advancements in nutrition, disease prevention, genetic selection, and improved flock management practices have contributed to improving overall hen health, which is associated with good lay rates. In the beginning of 2020, although lay rates continued to trend higher year over year, the layer flock contracted sizably. This tightening of supply has been met with a surge in demand, causing prices to increase in March. This chart is drawn from the Economic Research Service Livestock, Dairy, and Poultry Monthly Outlook, published March 2020, and the Livestock & Meat Domestic Data: Production Indicators.