
U.S. production of ice cream and frozen yogurt totals nearly 1.3 billion gallons per year
- by Jonathan Law and Alex Melton
- 7/13/2018
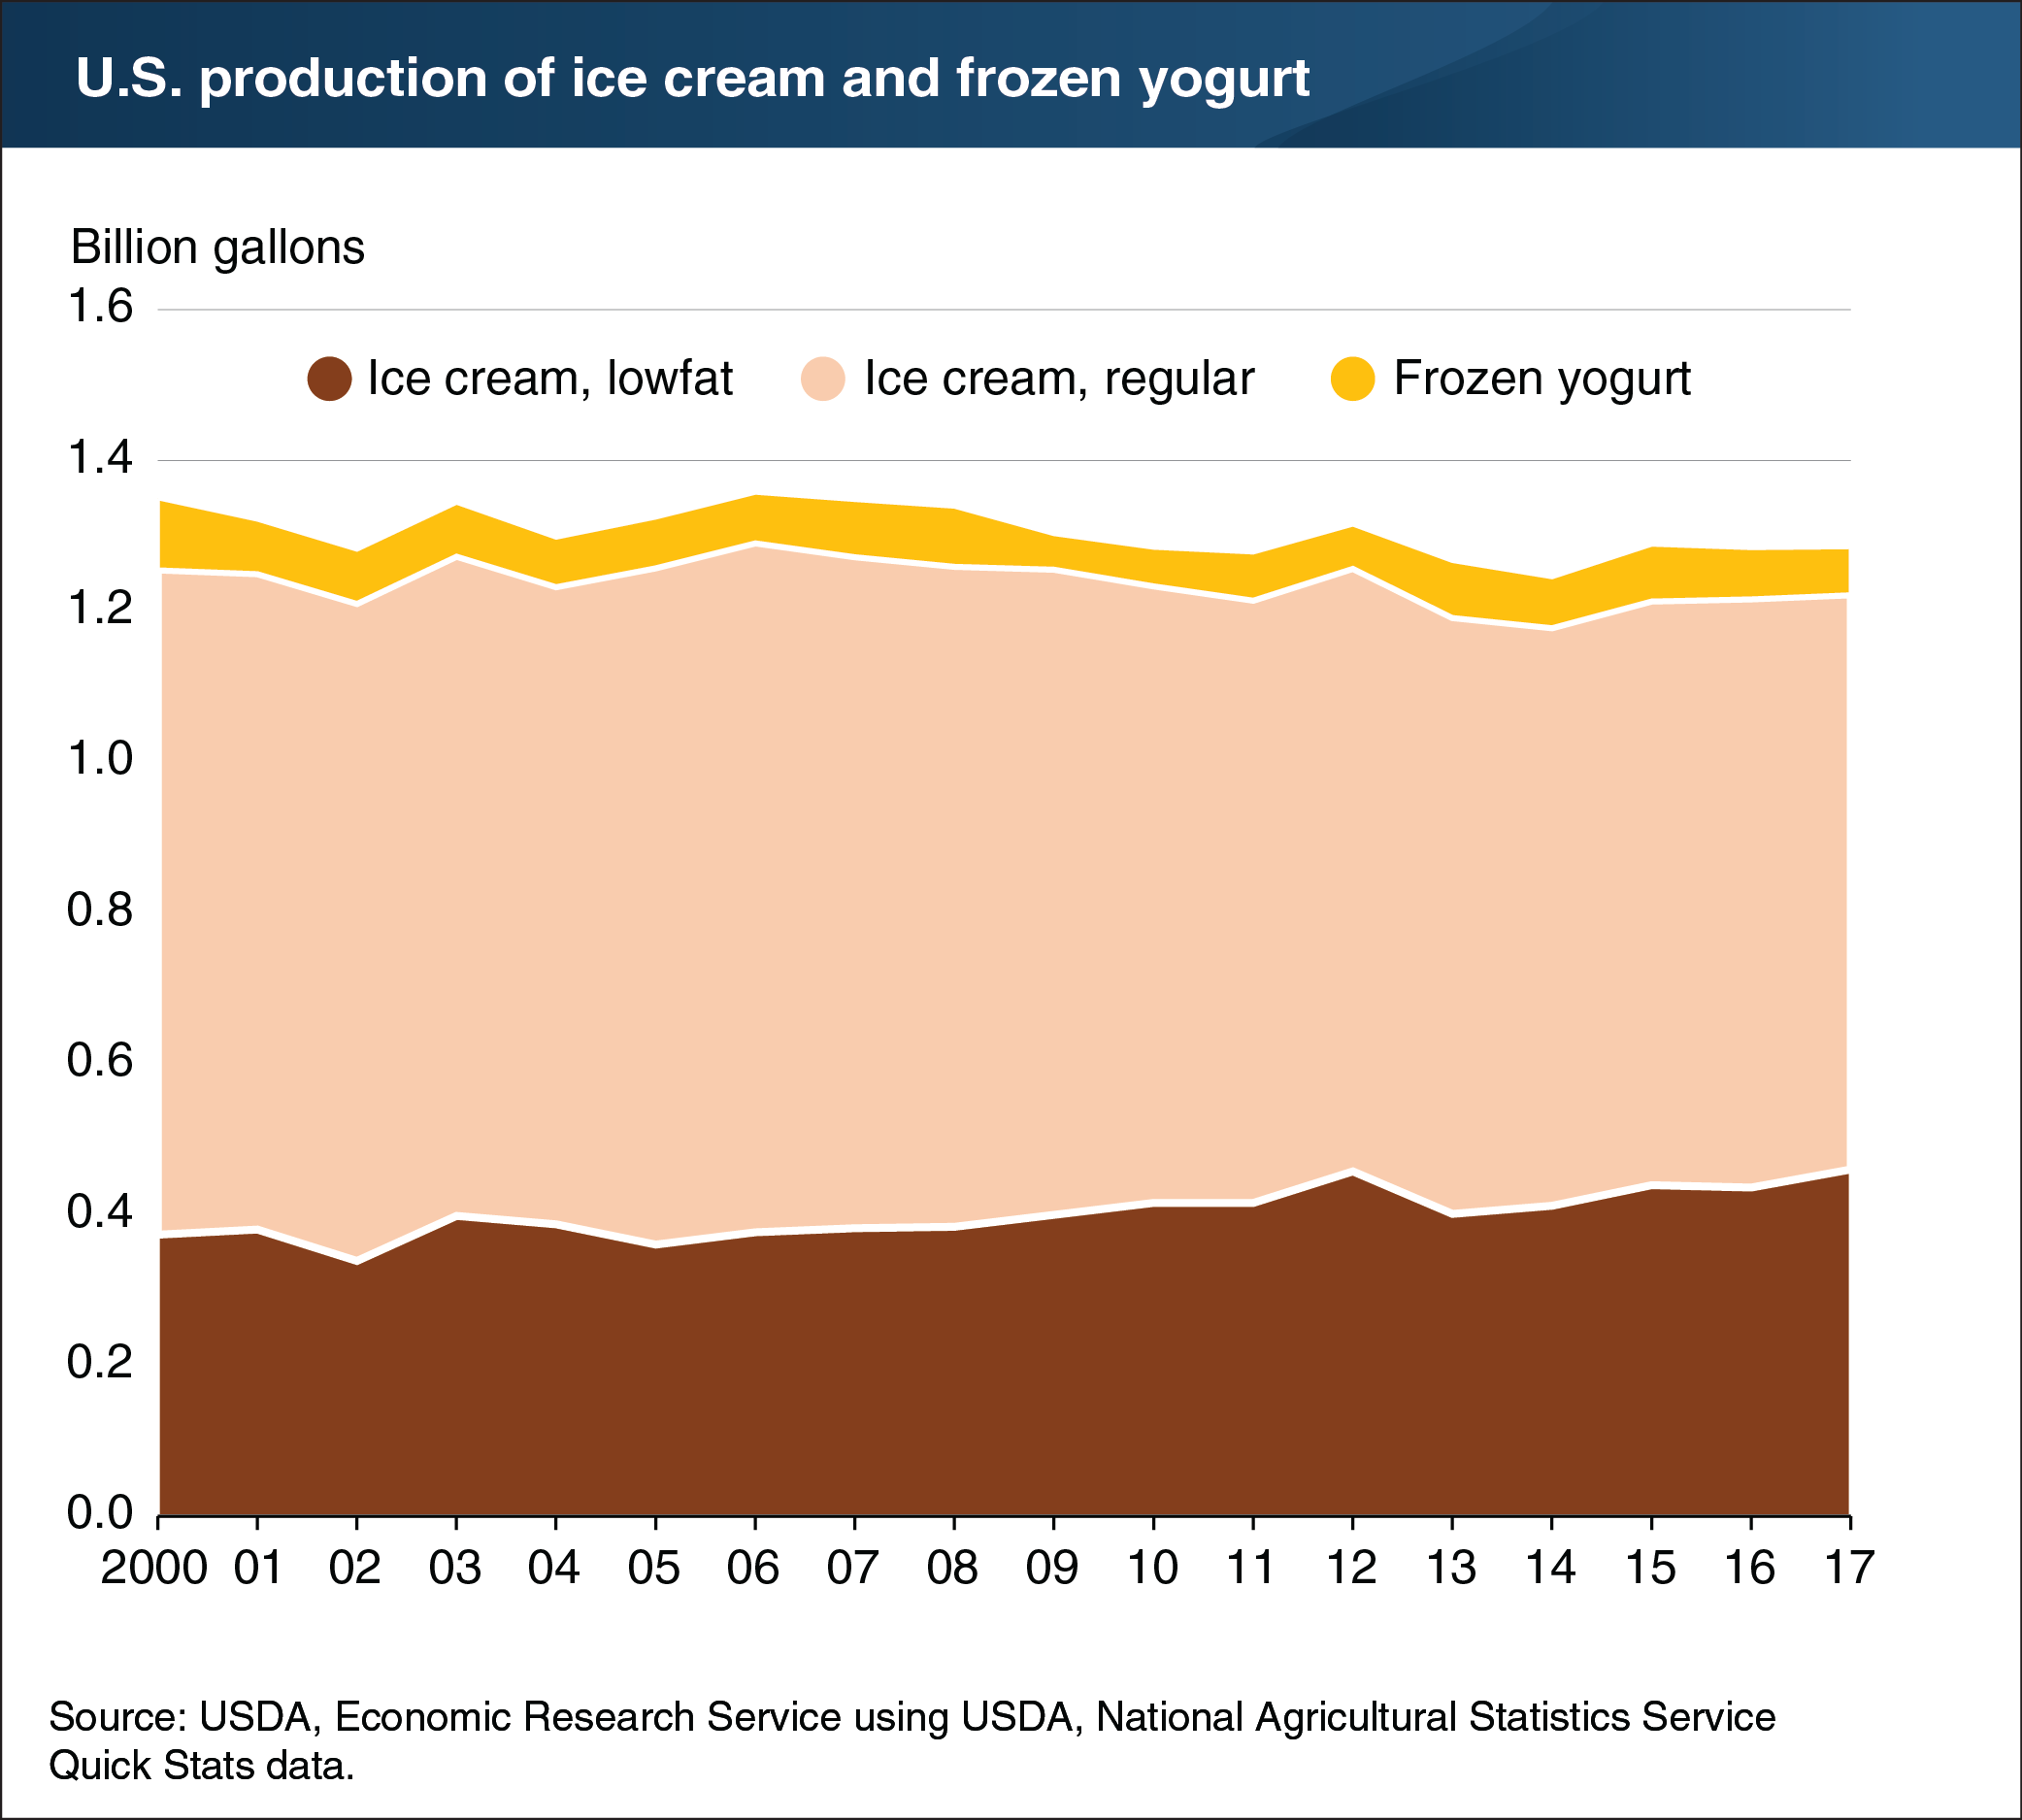
Americans continue to appreciate a cold treat every now and then, according to the latest data on U.S. ice cream and frozen yogurt production. In 2017, domestic production of ice cream (regular and low-fat) and frozen yogurt totaled just under 1.3 billion gallons. In the aggregate, production of ice cream and frozen yogurt has been quite stable, but movement has occurred among categories. As consumers have become more conscious of their intake of fats, the ice cream industry has shifted toward increased production of low-fat ice creams at the expense of regular fat content ice creams. Since 2000, production of low-fat ice cream has increased by 23 percent, while regular ice cream production has decreased by 14 percent. Perhaps due to increased availability of non-dairy ice cream options, frozen yogurt has also declined in prevalence. Production of frozen yogurt is down 34 percent since 2000 and nearly 60 percent since the mid-1990s. This chart is drawn from the ERS Dairy Data product, last updated in June 2018.