
Food stores—except specialized food stores—grew in number between 2009 and 2014
- by Alana Rhone
- 6/19/2018
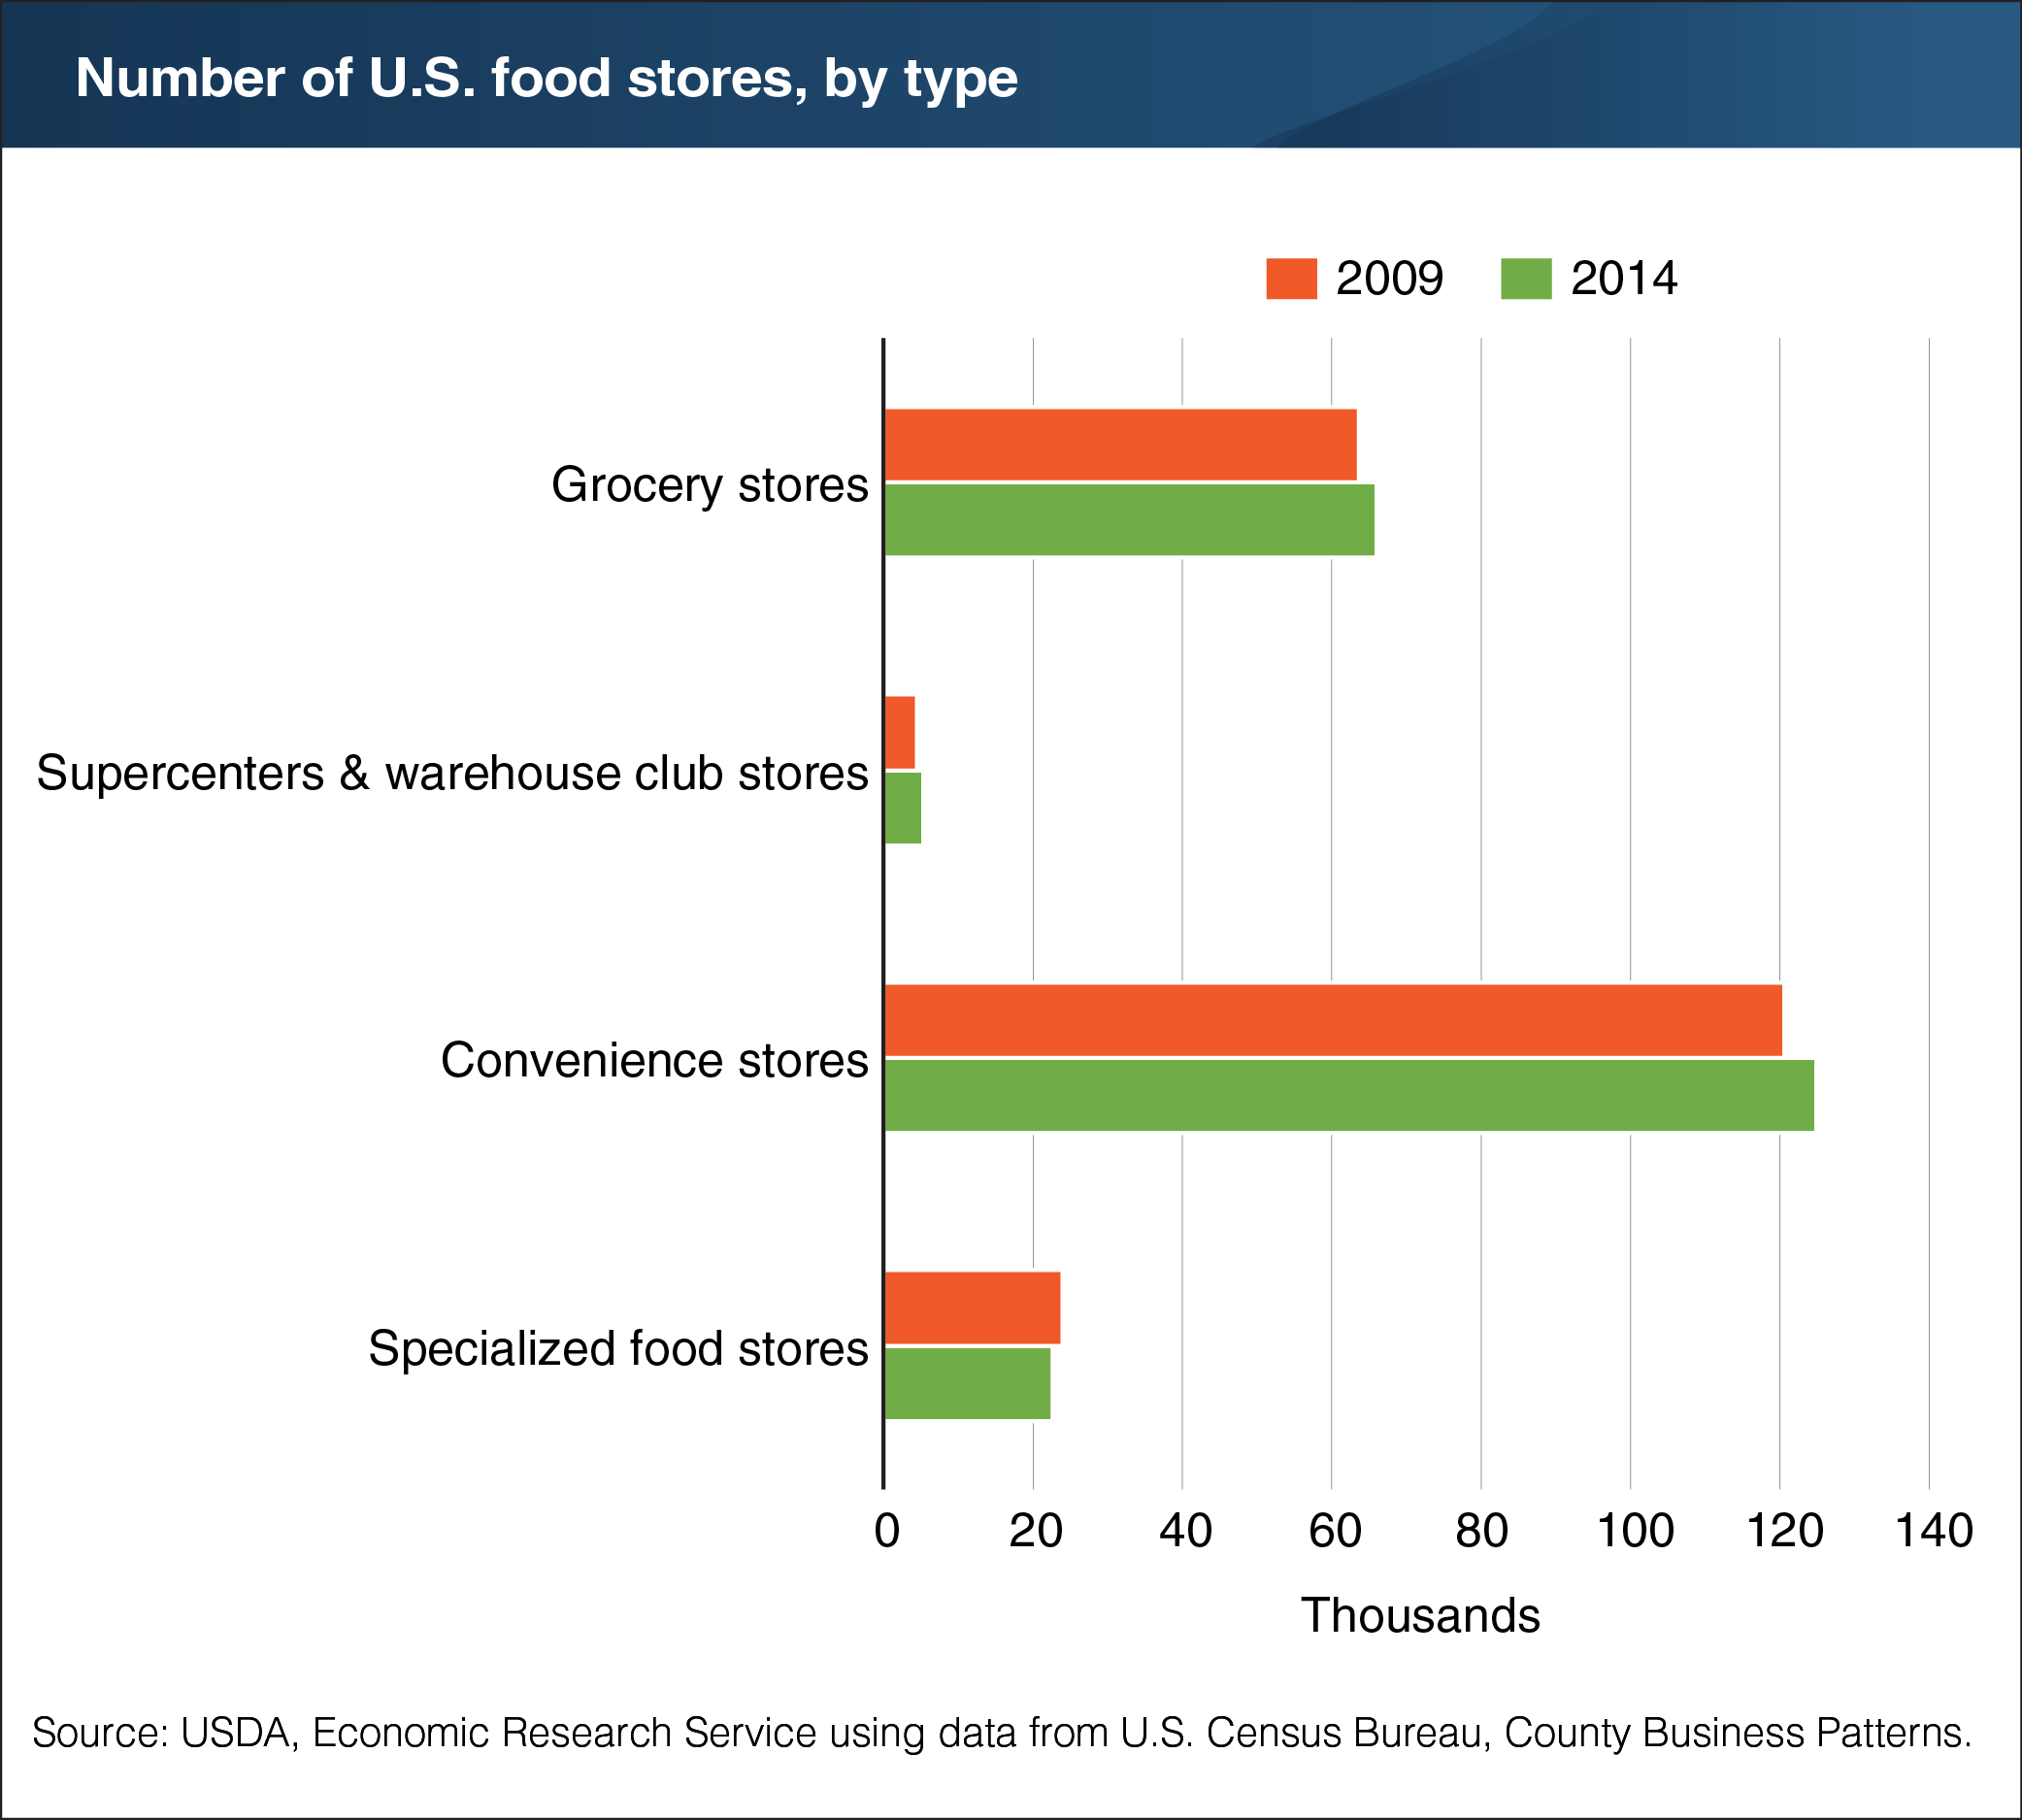
The numbers of different types of food stores and changes in those numbers over time have implications for the economic well-being of communities for reasons related to employment opportunities, tax revenues, and business development. Between 2009 and 2014, the number of grocery stores in the United States grew by 4 percent to 65,975, and the number of convenience stores grew by 4 percent as well to 124,879. Supercenters and warehouse club stores saw their numbers jump by 18 percent to 5,307 stores in 2014, while specialized food stores (bakeries, seafood markets, dairy stores, etc.) saw a 6-percent decline in store numbers. Preference for one-stop shopping by some consumers may be influencing the increase in supercenters and warehouse club stores and the decline in specialized food stores. ERS’s Food Environment Atlas provides a spatial overview of a county’s food retailing landscape by mapping the number and density of these four store types. This chart is from “County-Level Data Show Changes in the Number and Concentration of Food Stores” in the May 2018 issue of ERS’ Amber Waves magazine.