
Farm inputs have shifted over time toward less use of labor and land, and more use of capital and intermediate goods
- by Sun Ling Wang
- 4/9/2018
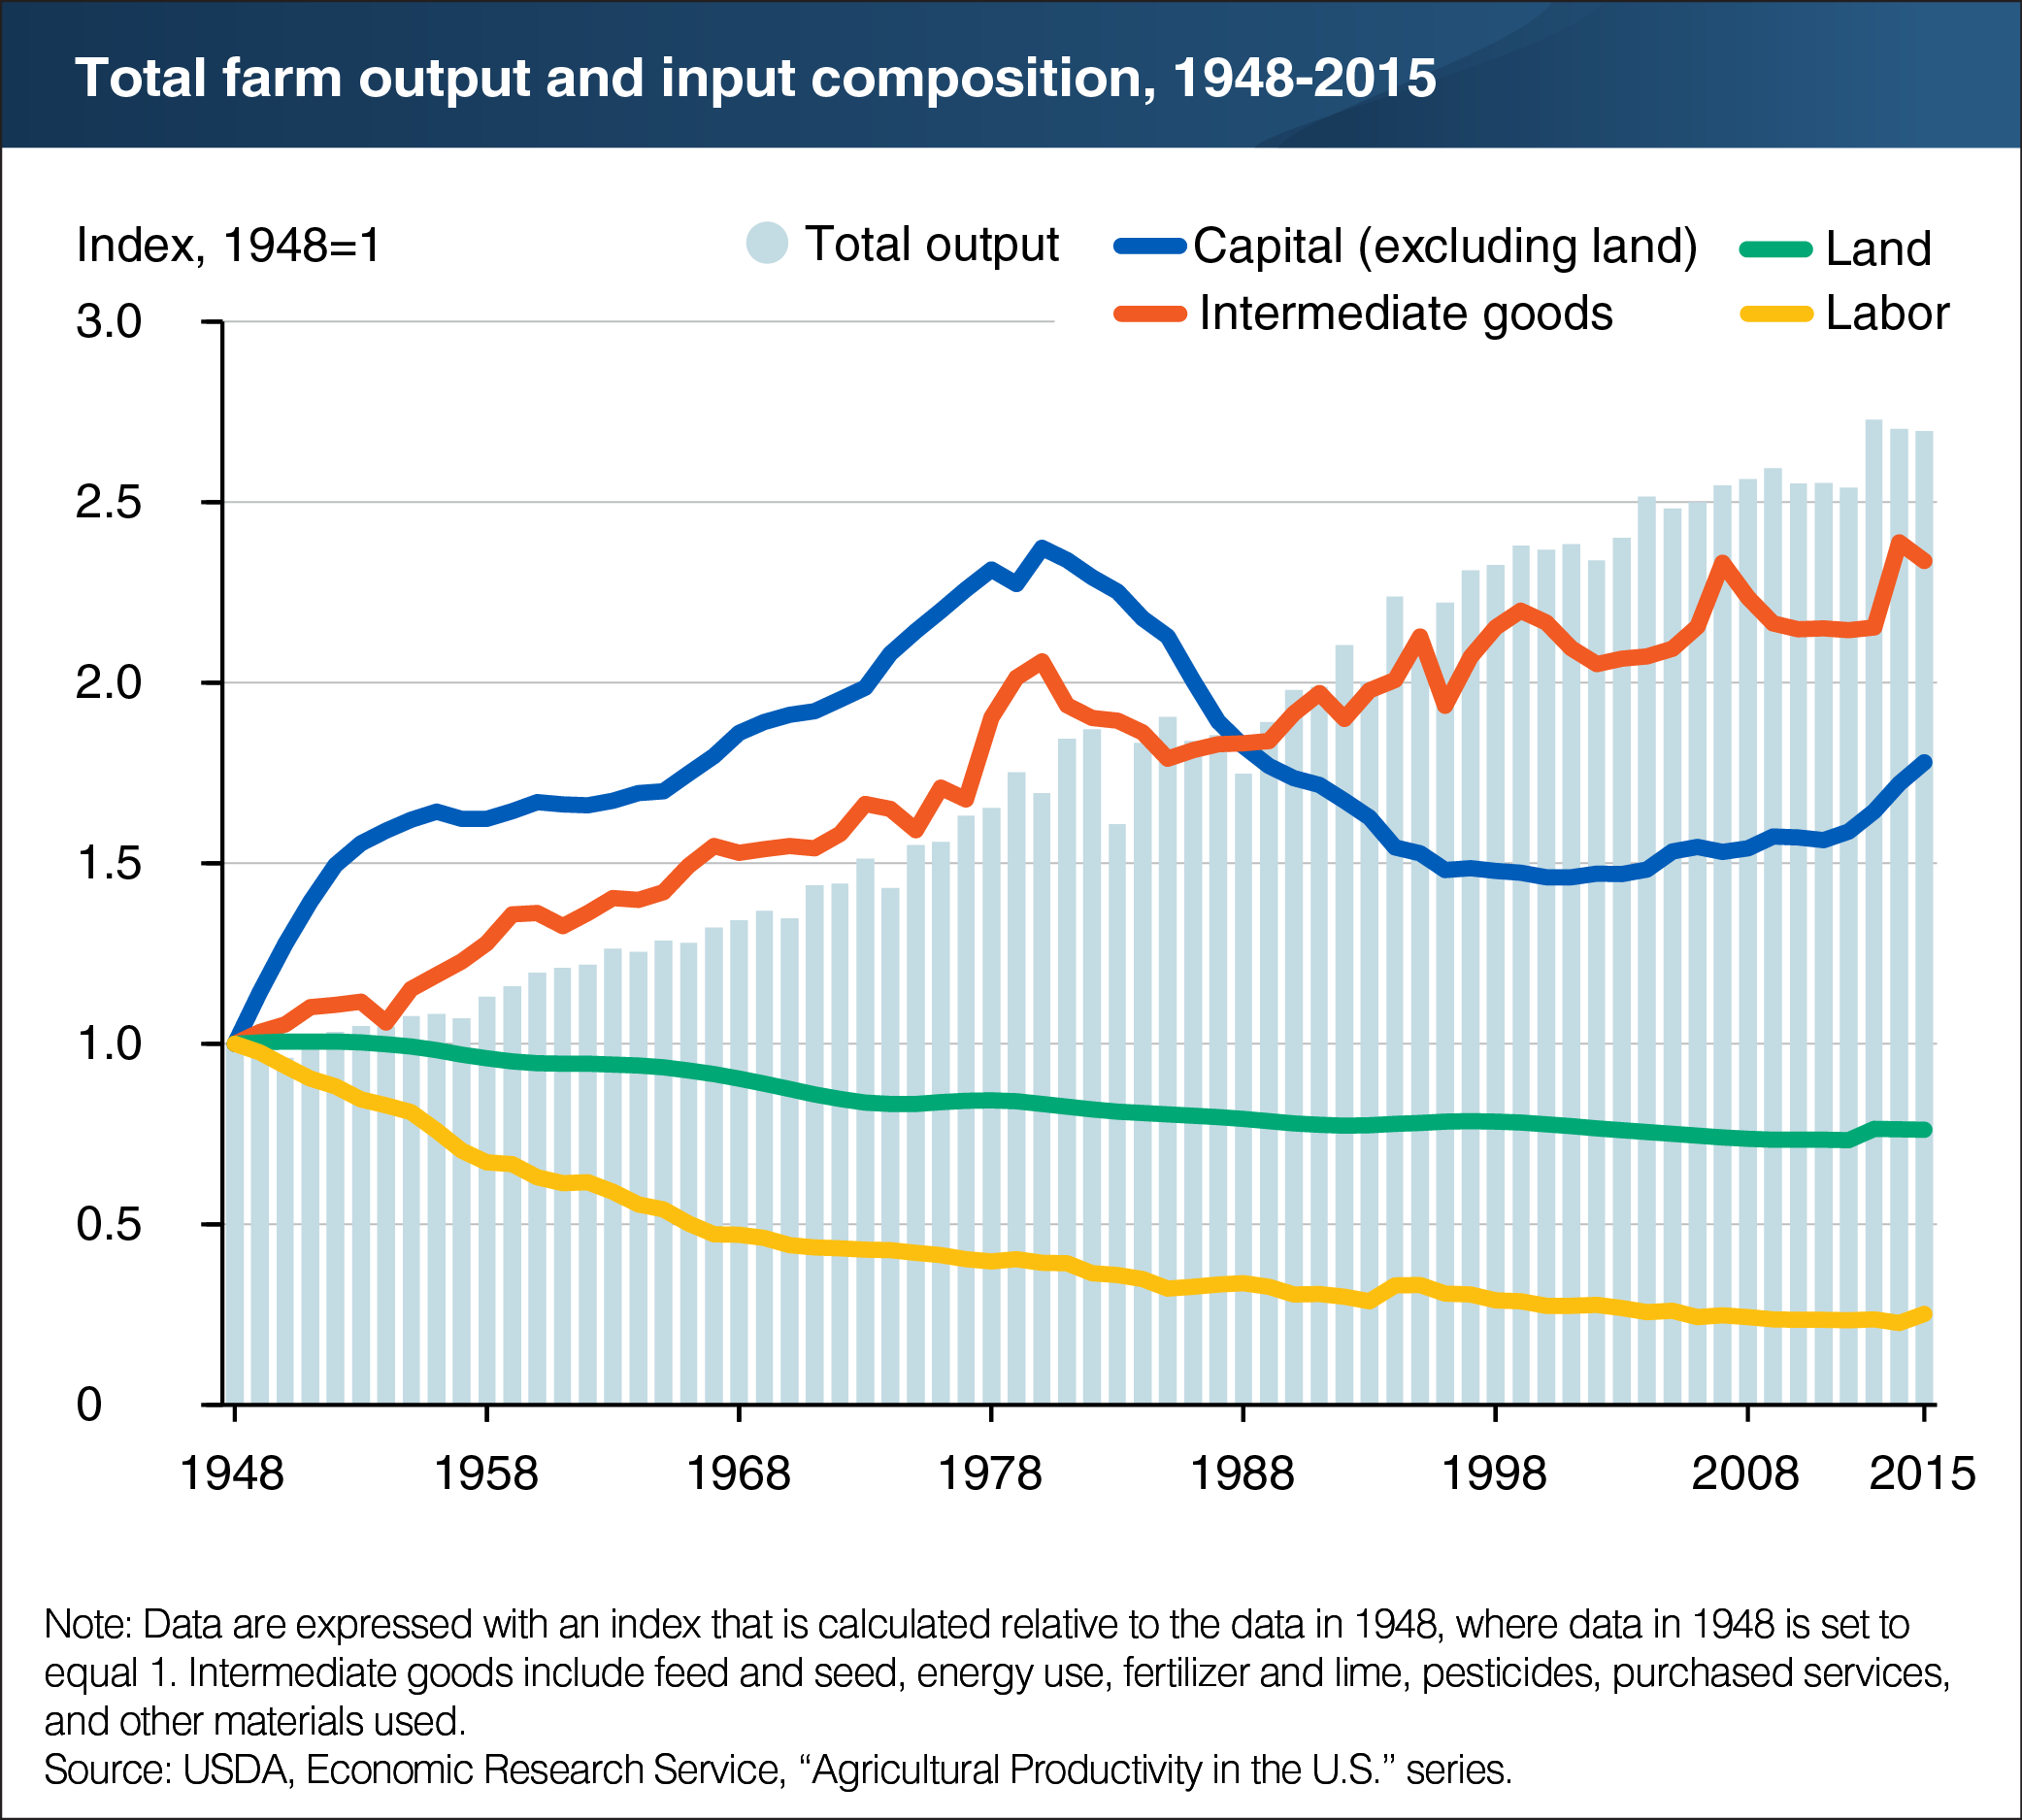
Between 1948 and 2015, total farm output nearly tripled, while farm inputs grew little. However, input composition has shifted considerably toward more use of farm machinery (part of capital inputs) and intermediate goods, such as seed, feed, energy use, fertilizer, pesticides, and purchased services. Inputs of intermediate goods and capital inputs (excluding land) grew by 134 percent and 78 percent, respectively. By comparison, labor inputs declined by 75 percent and land inputs fell by 24 percent. Many factors contributed to these input changes. For example, competing uses for labor and land from other sectors or purposes have raised the costs of those inputs. Technological advancements have also made inputs like machinery and agricultural chemicals more effective and affordable for farmers. This chart appears in the March 2018 Amber Waves data feature, "Agricultural Productivity Growth in the United States: 1948-2015."