
Grocery store food prices fell 0.2 percent in 2017
- by Annemarie Kuhns
- 2/22/2018
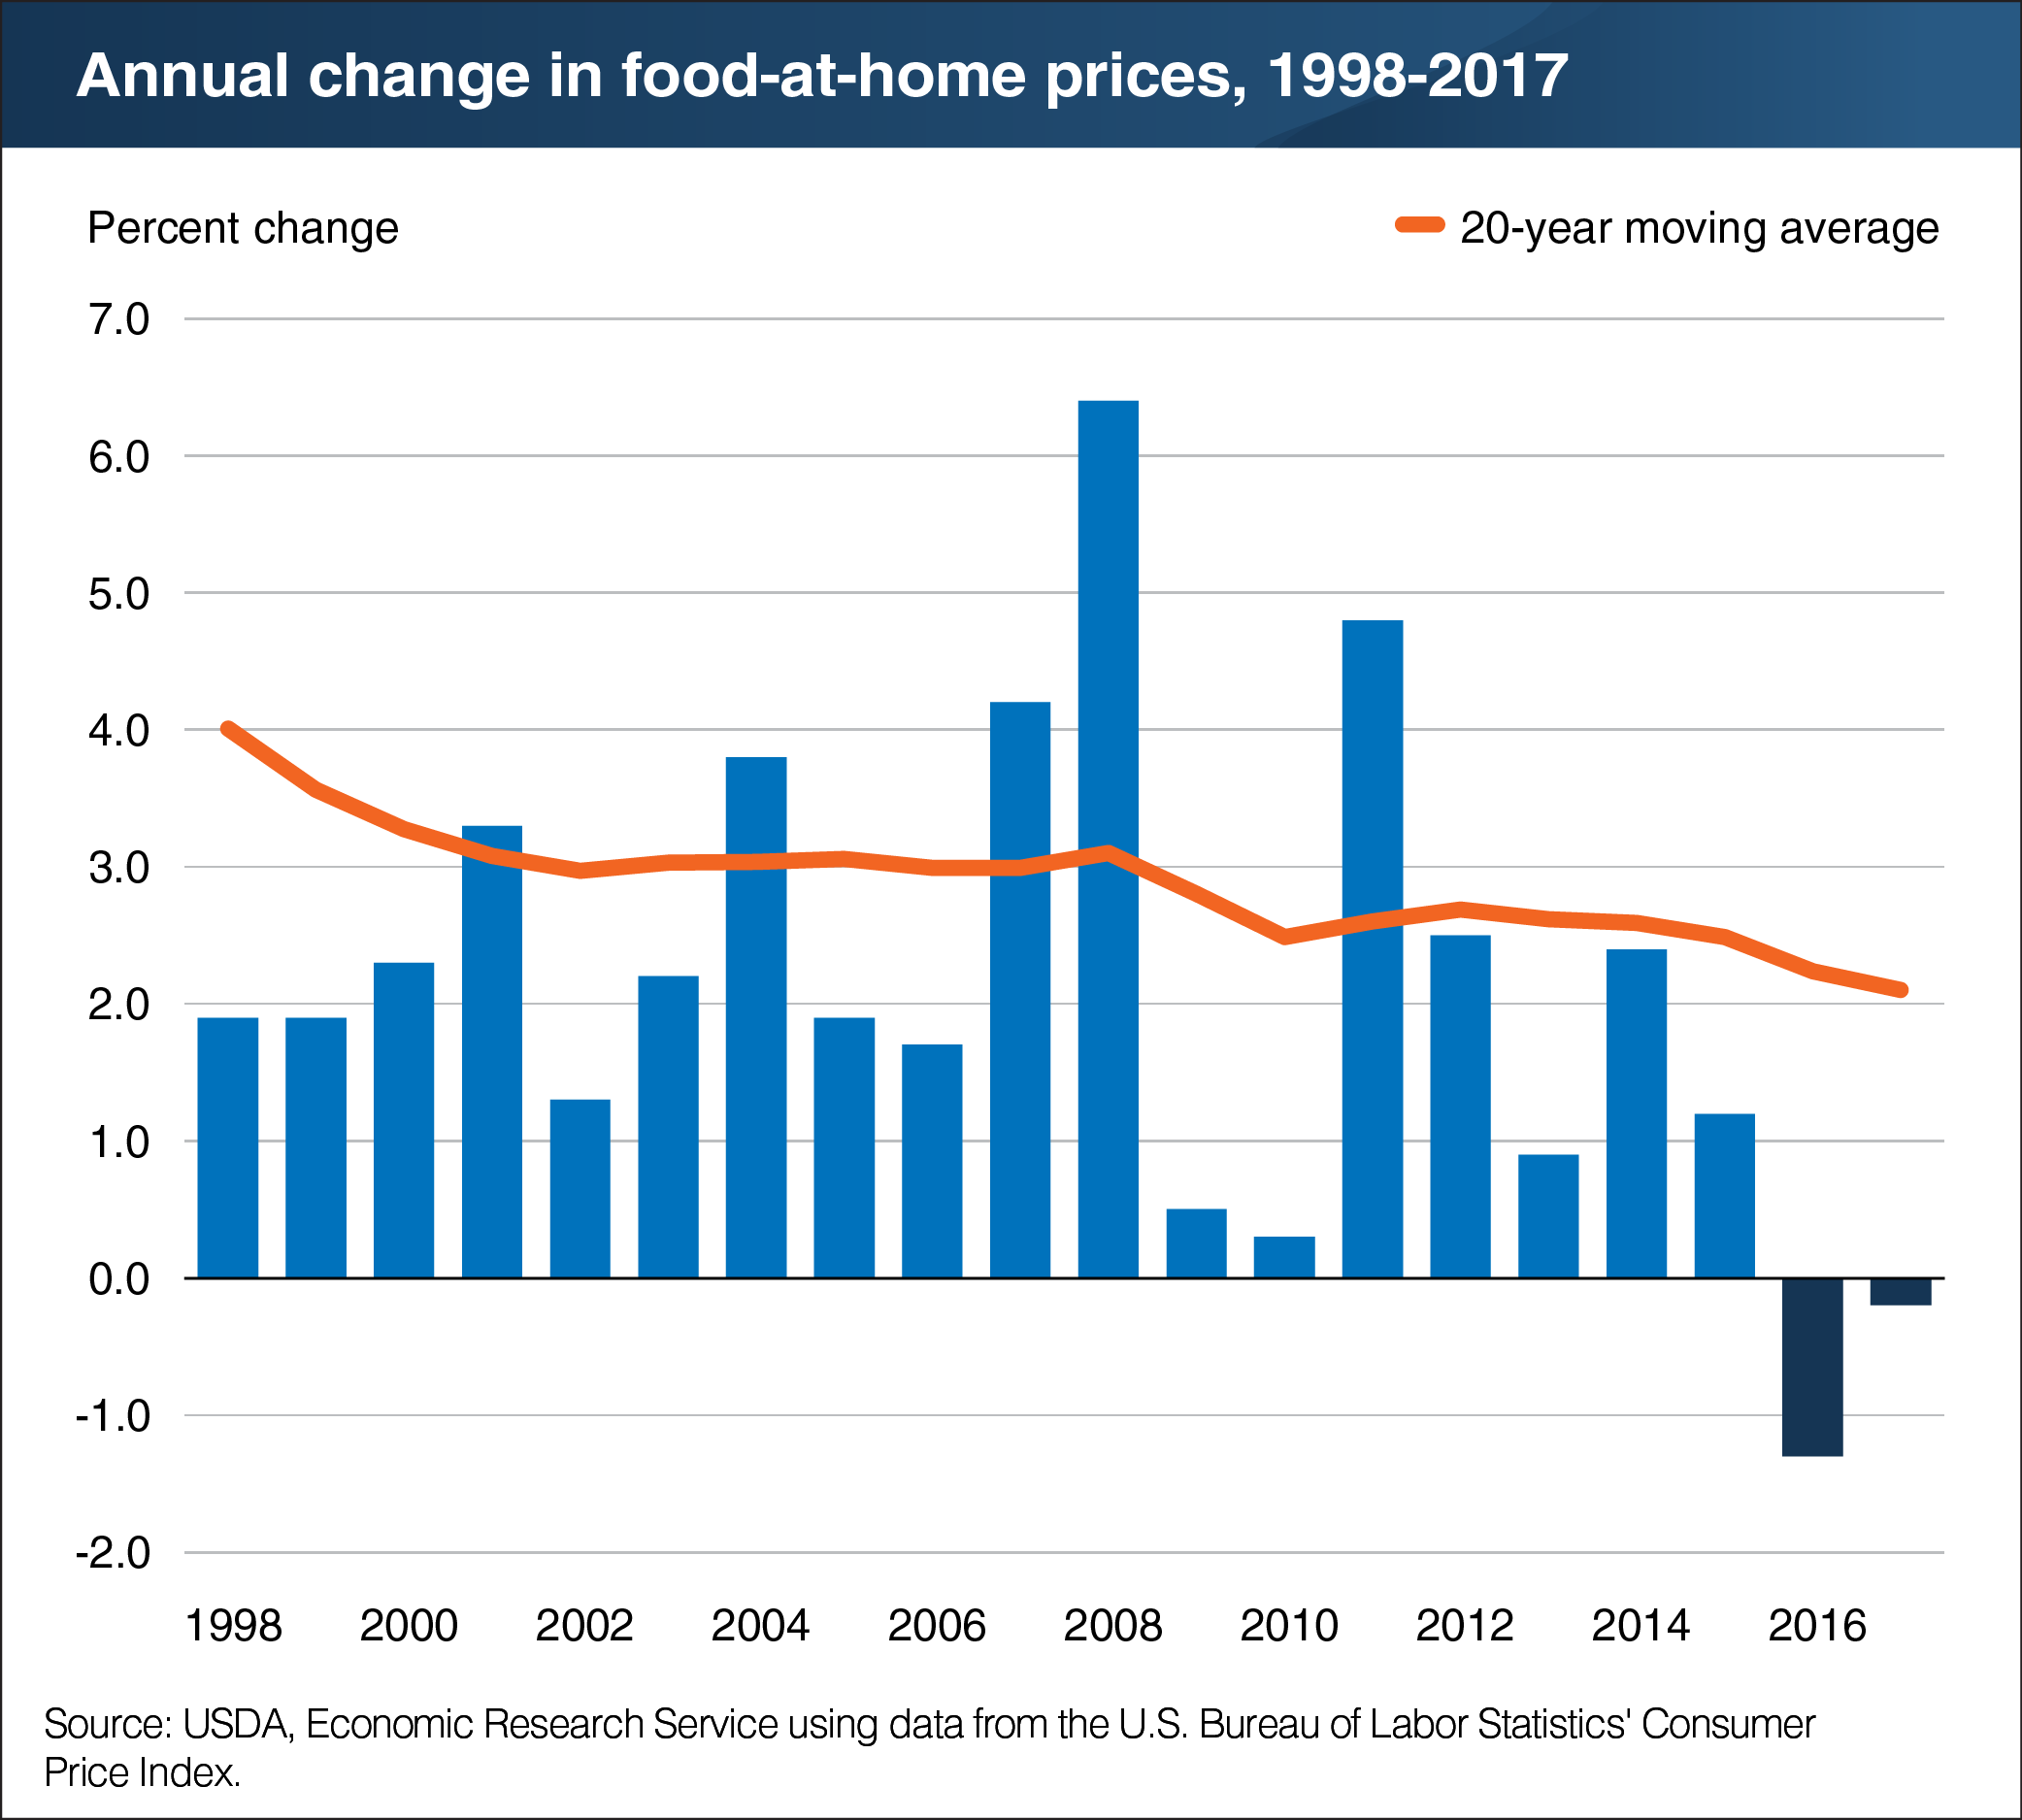
2017 marked the second consecutive year that average grocery store prices declined. At-home food prices in 2017 were 0.2 percent lower than 2016 prices. This decline followed a larger 1.3-percent drop in 2016—the first decline in annual grocery store prices since 1967. In contrast to falling food prices, overall inflation (prices for all goods and services, including food) rose by 1.3 percent in 2016 and by 2.1 percent in 2017. During 2016-17, lower food-at-home prices were driven, in part, by increased U.S. production of agricultural commodities, such as beef cattle and eggs, lower transportation costs due to lower oil prices, and a strong U.S. dollar which can make imported foods less expensive. Grocery store price changes can be volatile year to year, however the 20-year moving average, or average price change for the previous 20 years, has been slowly declining from 4 percent in 1998 to 3.1 percent in 2008 to 2.1 percent in 2017. More information on ERS's food price forecasts can be found in ERS's Food Price Outlook data product, updated February 22, 2018.