
Processed potato availability has fallen over time
- by Travis Minor
- 8/31/2017
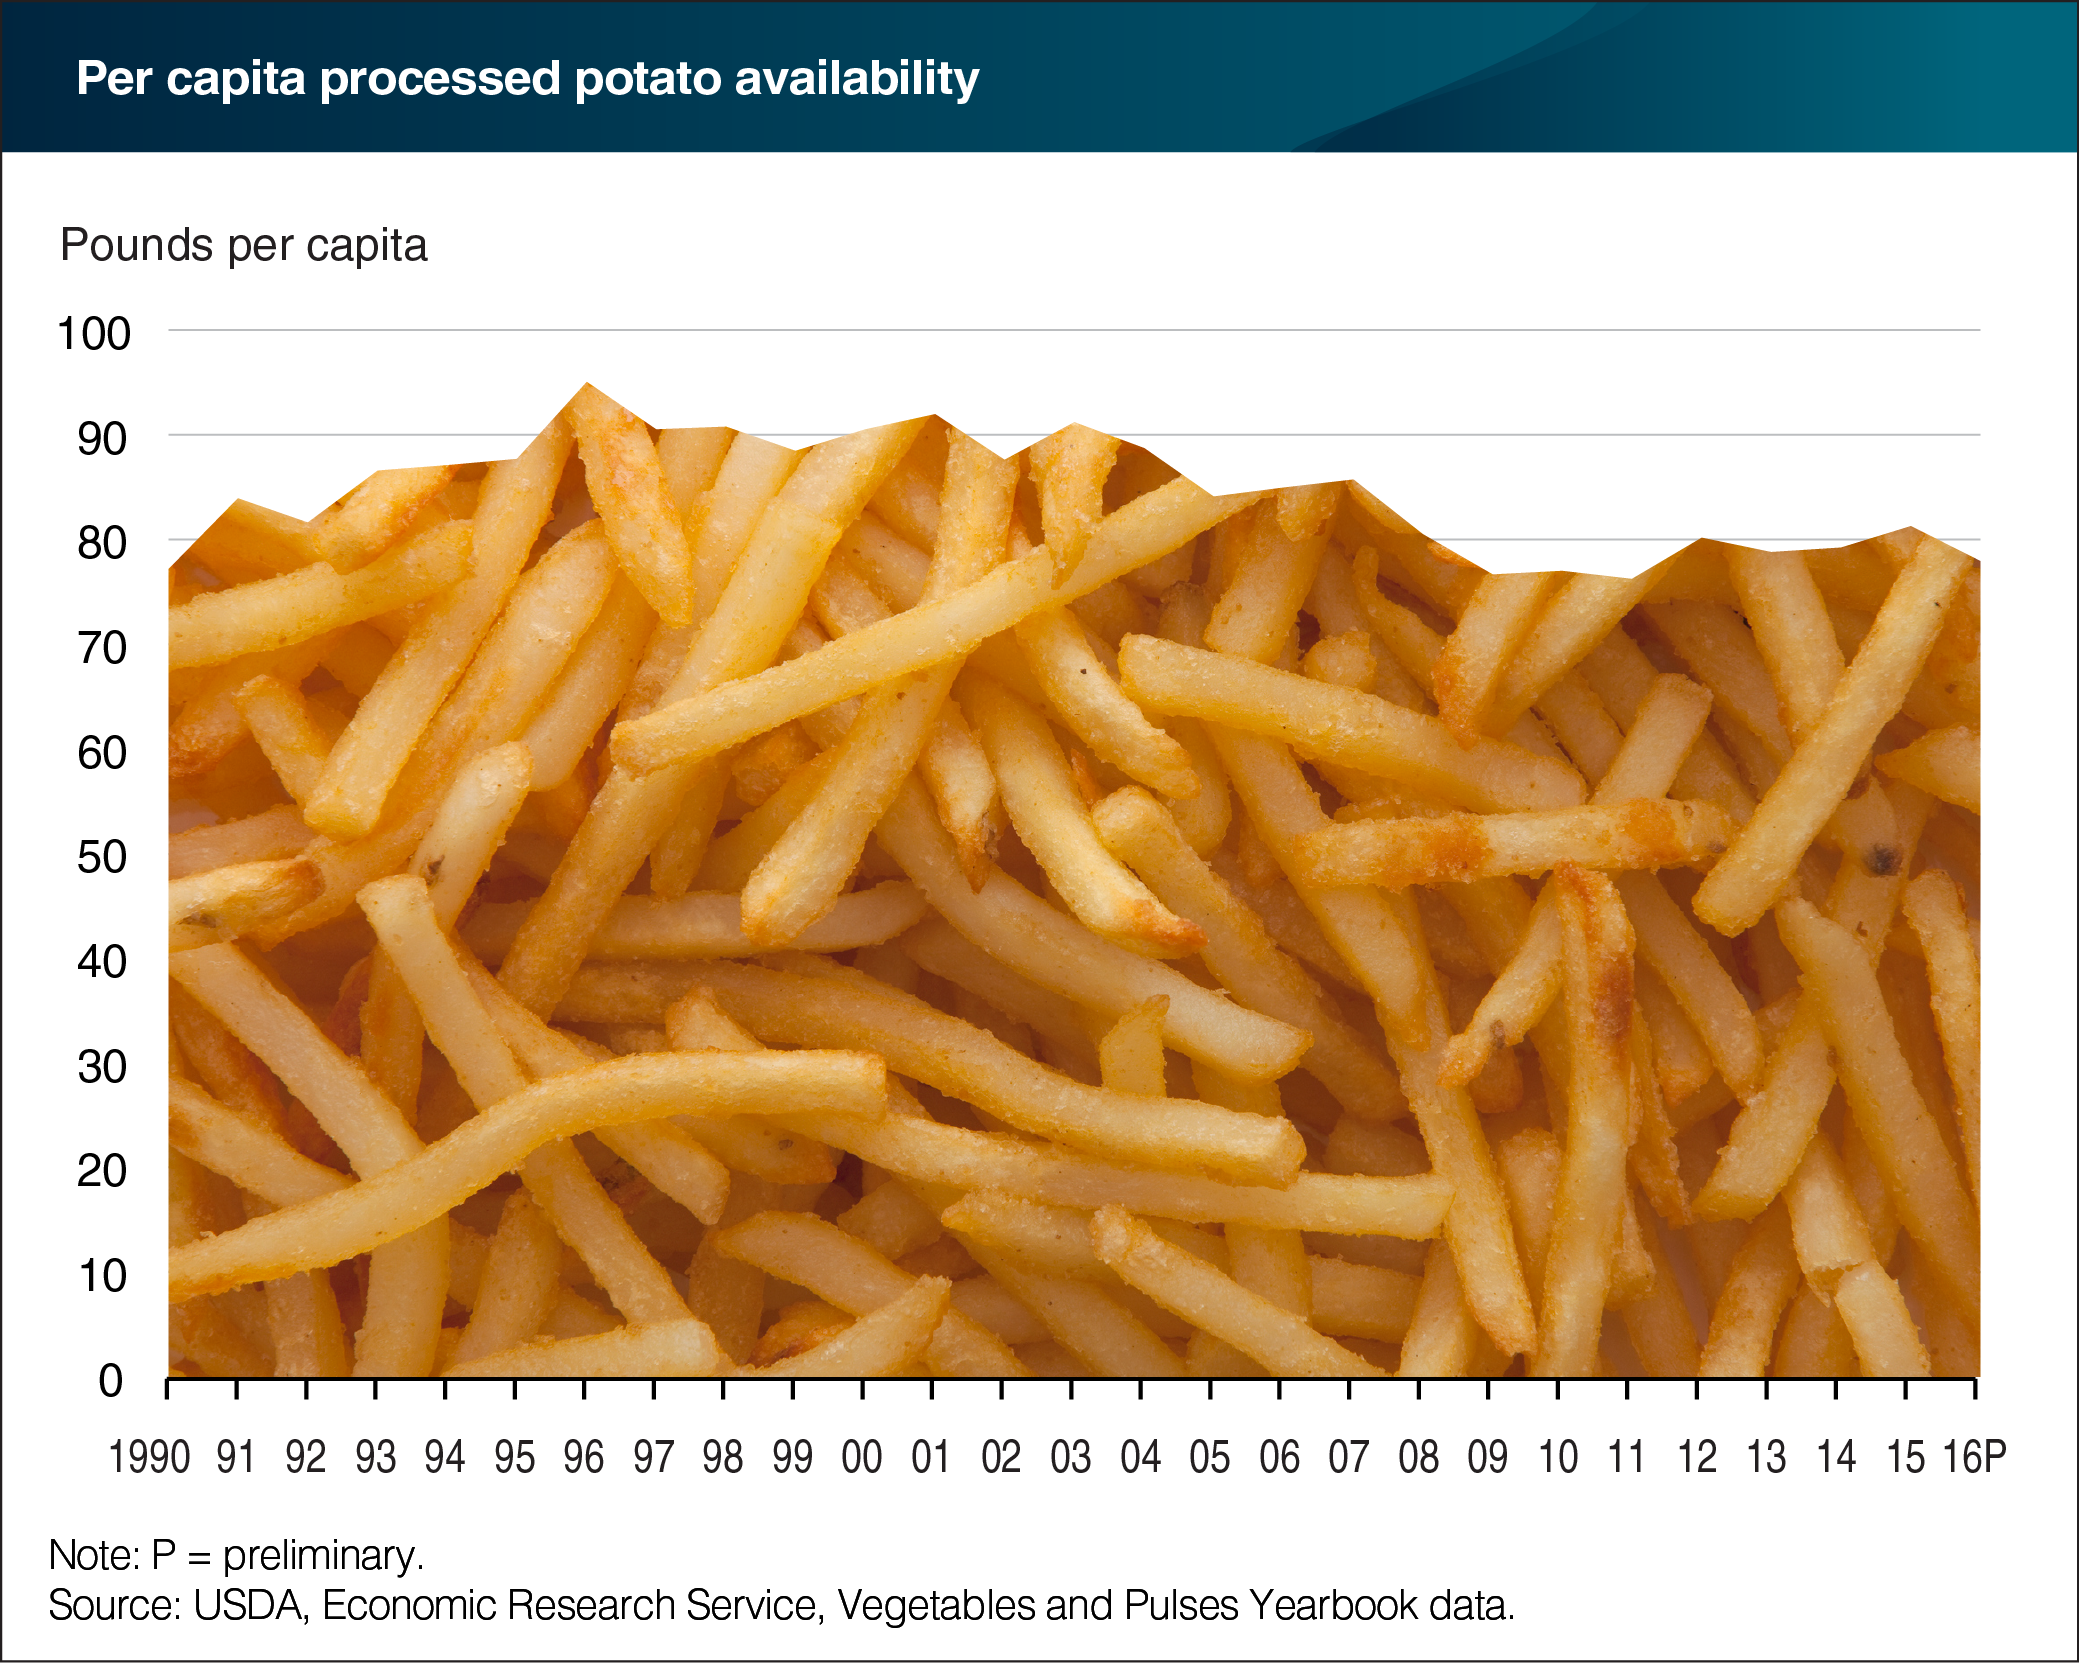
Processed vegetables make up roughly 44 percent of total per capita availability of vegetables in the United States. Potatoes (including frozen, chips, dehydrated, and canned) are the leading processed vegetable commodity available per capita. In 2016, there were over 75 pounds of processed potatoes available per capita. Since 1970, availability of processed potatoes has surpassed fresh potatoes in the United States. Spurred by the innovation of frozen French fry processing techniques in the 1950s and the increasing popularity of fast food chains, processed potatoes have composed 70 percent of total U.S. potato availability since 2010. The trend for processed potato availability has been sloping downward, however, since its peak in the mid to late 1990s. This gradual decline may indicate that Americans are shifting away from consuming processed vegetables in general. The 2015-2020 Dietary Guidelines for Americans cautions consumers from consuming excess saturated fats and sodium. This chart is adapted from a chart in the Amber Waves article, "Newly Updated ERS Data Shows 2016 Production, Trade Volume, and Per Capita Availability of Vegetables and Pulses," released in August 2017.