
Over 80 percent of food-insecure households with school-age children receive free or reduced-price school lunches
- by Katherine Ralston and Alisha Coleman-Jensen
- 8/21/2017
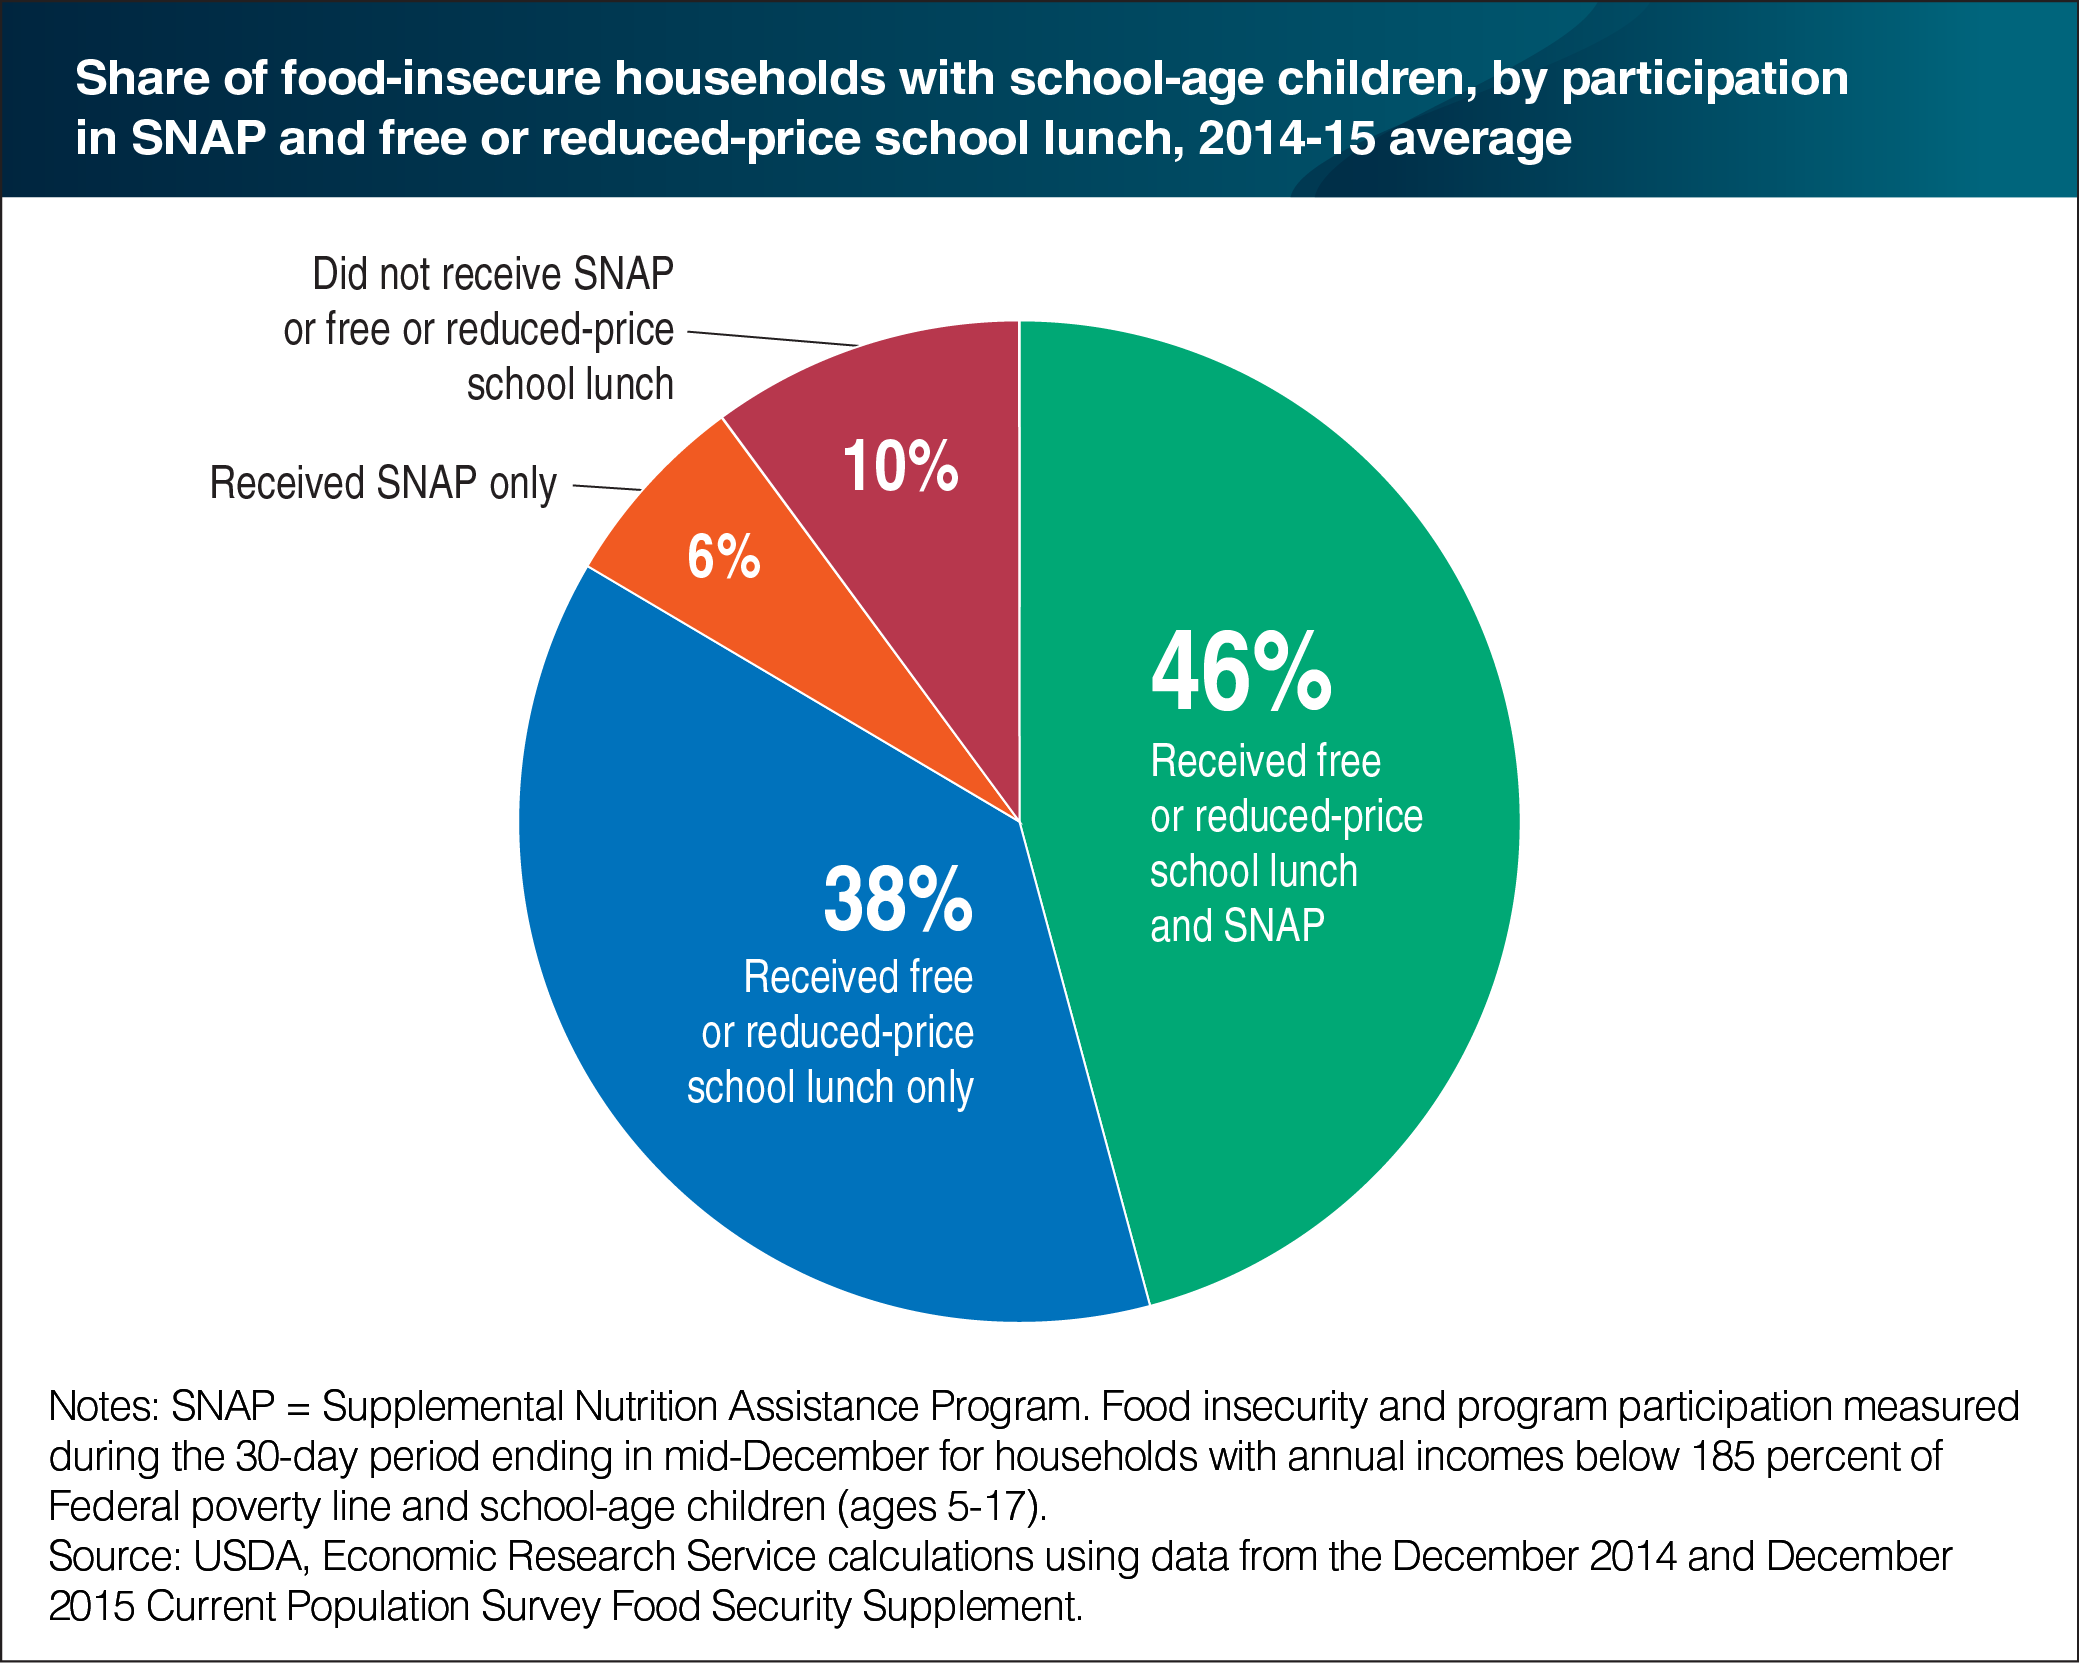
As summer comes to a close, kids head back to school. For many low-income children and teens, returning to school also means returning to free or reduced-price lunches provided through USDA’s National School Lunch Program (NSLP). In September 2016, 21.9 million children received free or reduced-price school lunches, including children who lived in food-insecure households—households that at times have difficulty putting enough food on the table due to limited resources. In 2015, 13.1 million children lived in food-insecure households. In 2014 and 2015, 84 percent of low-income food-insecure households with school-age children accessed free or reduced-price lunches through the NSLP, either in combination with Supplemental Nutrition Assistance Program (SNAP) benefits (46 percent), which provide food and nutrition assistance to low-income Americans, or alone (38 percent). An estimated 6 percent of low-income food-insecure households with school-age children received SNAP, but not free or reduced-price school lunches, and 10 percent did not participate in either program. This chart appears in "USDA’s National School Lunch Program Reduces Food Insecurity" in the August 2017 issue of ERS’s Amber Waves magazine.