
Per capita fresh vegetable availability has grown from the 1970s to the present
- by Travis Minor
- 8/8/2017
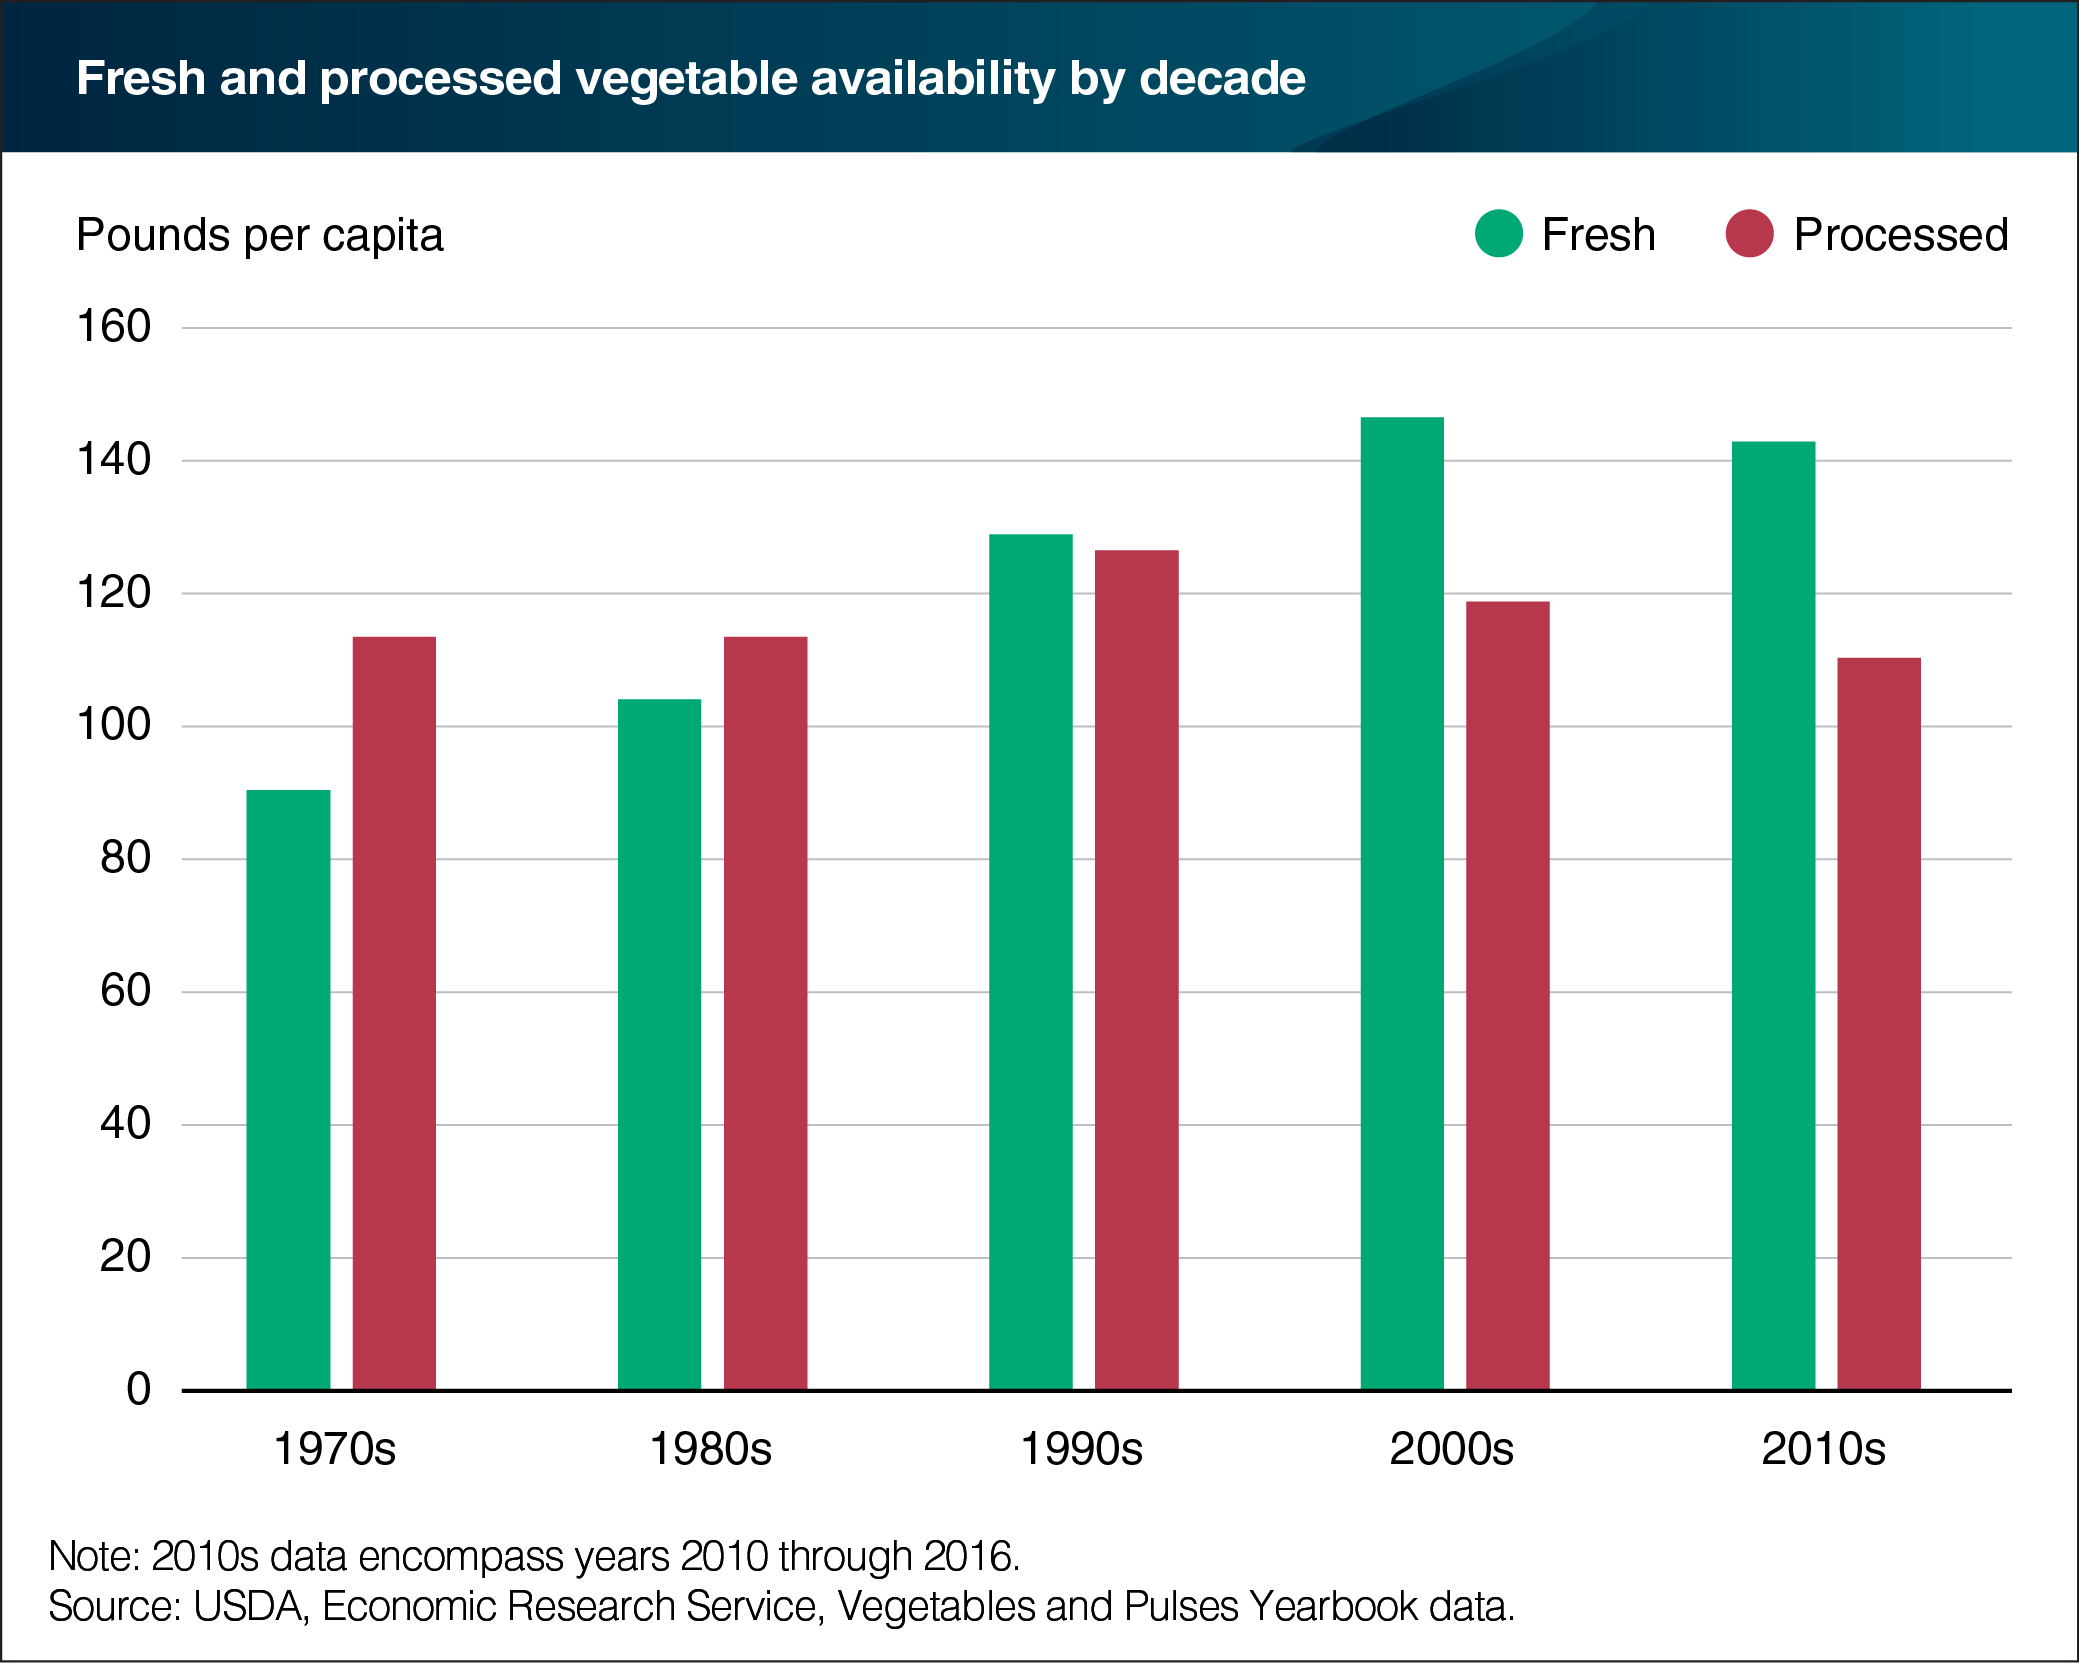
Decade averages of per capita availability of fresh and processed vegetables show that fresh vegetable availability increased from around 90 pounds per person in the 1970s to a high of almost 150 pounds per person in the 2000s. Although per capita fresh vegetable availability is down slightly in the current decade (data are through 2016), average availability is still well above the 1990s and earlier decades. Processed vegetable per capita availability tells a slightly different story; remaining relatively flat between 110 and 130 pounds per capita since the 1970s. Since the peak in the 1990s, processed vegetable availability has trended downwards. For both fresh and processed vegetable categories, tomatoes and potatoes are the most popular. In the processed category, tomato and potato use have declined steadily since the mid-1990s. Additionally, since 1990, the per capita availability of fresh tomatoes has been steadily increasing, which suggests that some people may be shifting from processed to fresh preparations. This chart appears in the Amber Waves article, "Newly Updated ERS Data Shows 2016 Production, Trade Volume, and Per Capita Availability of Vegetables and Pulses," released in August 2017.