
Services—such as finance, real estate, and administration—had the highest share of employment for both rural and urban areas in 2015
- by Thomas Hertz
- 7/12/2017
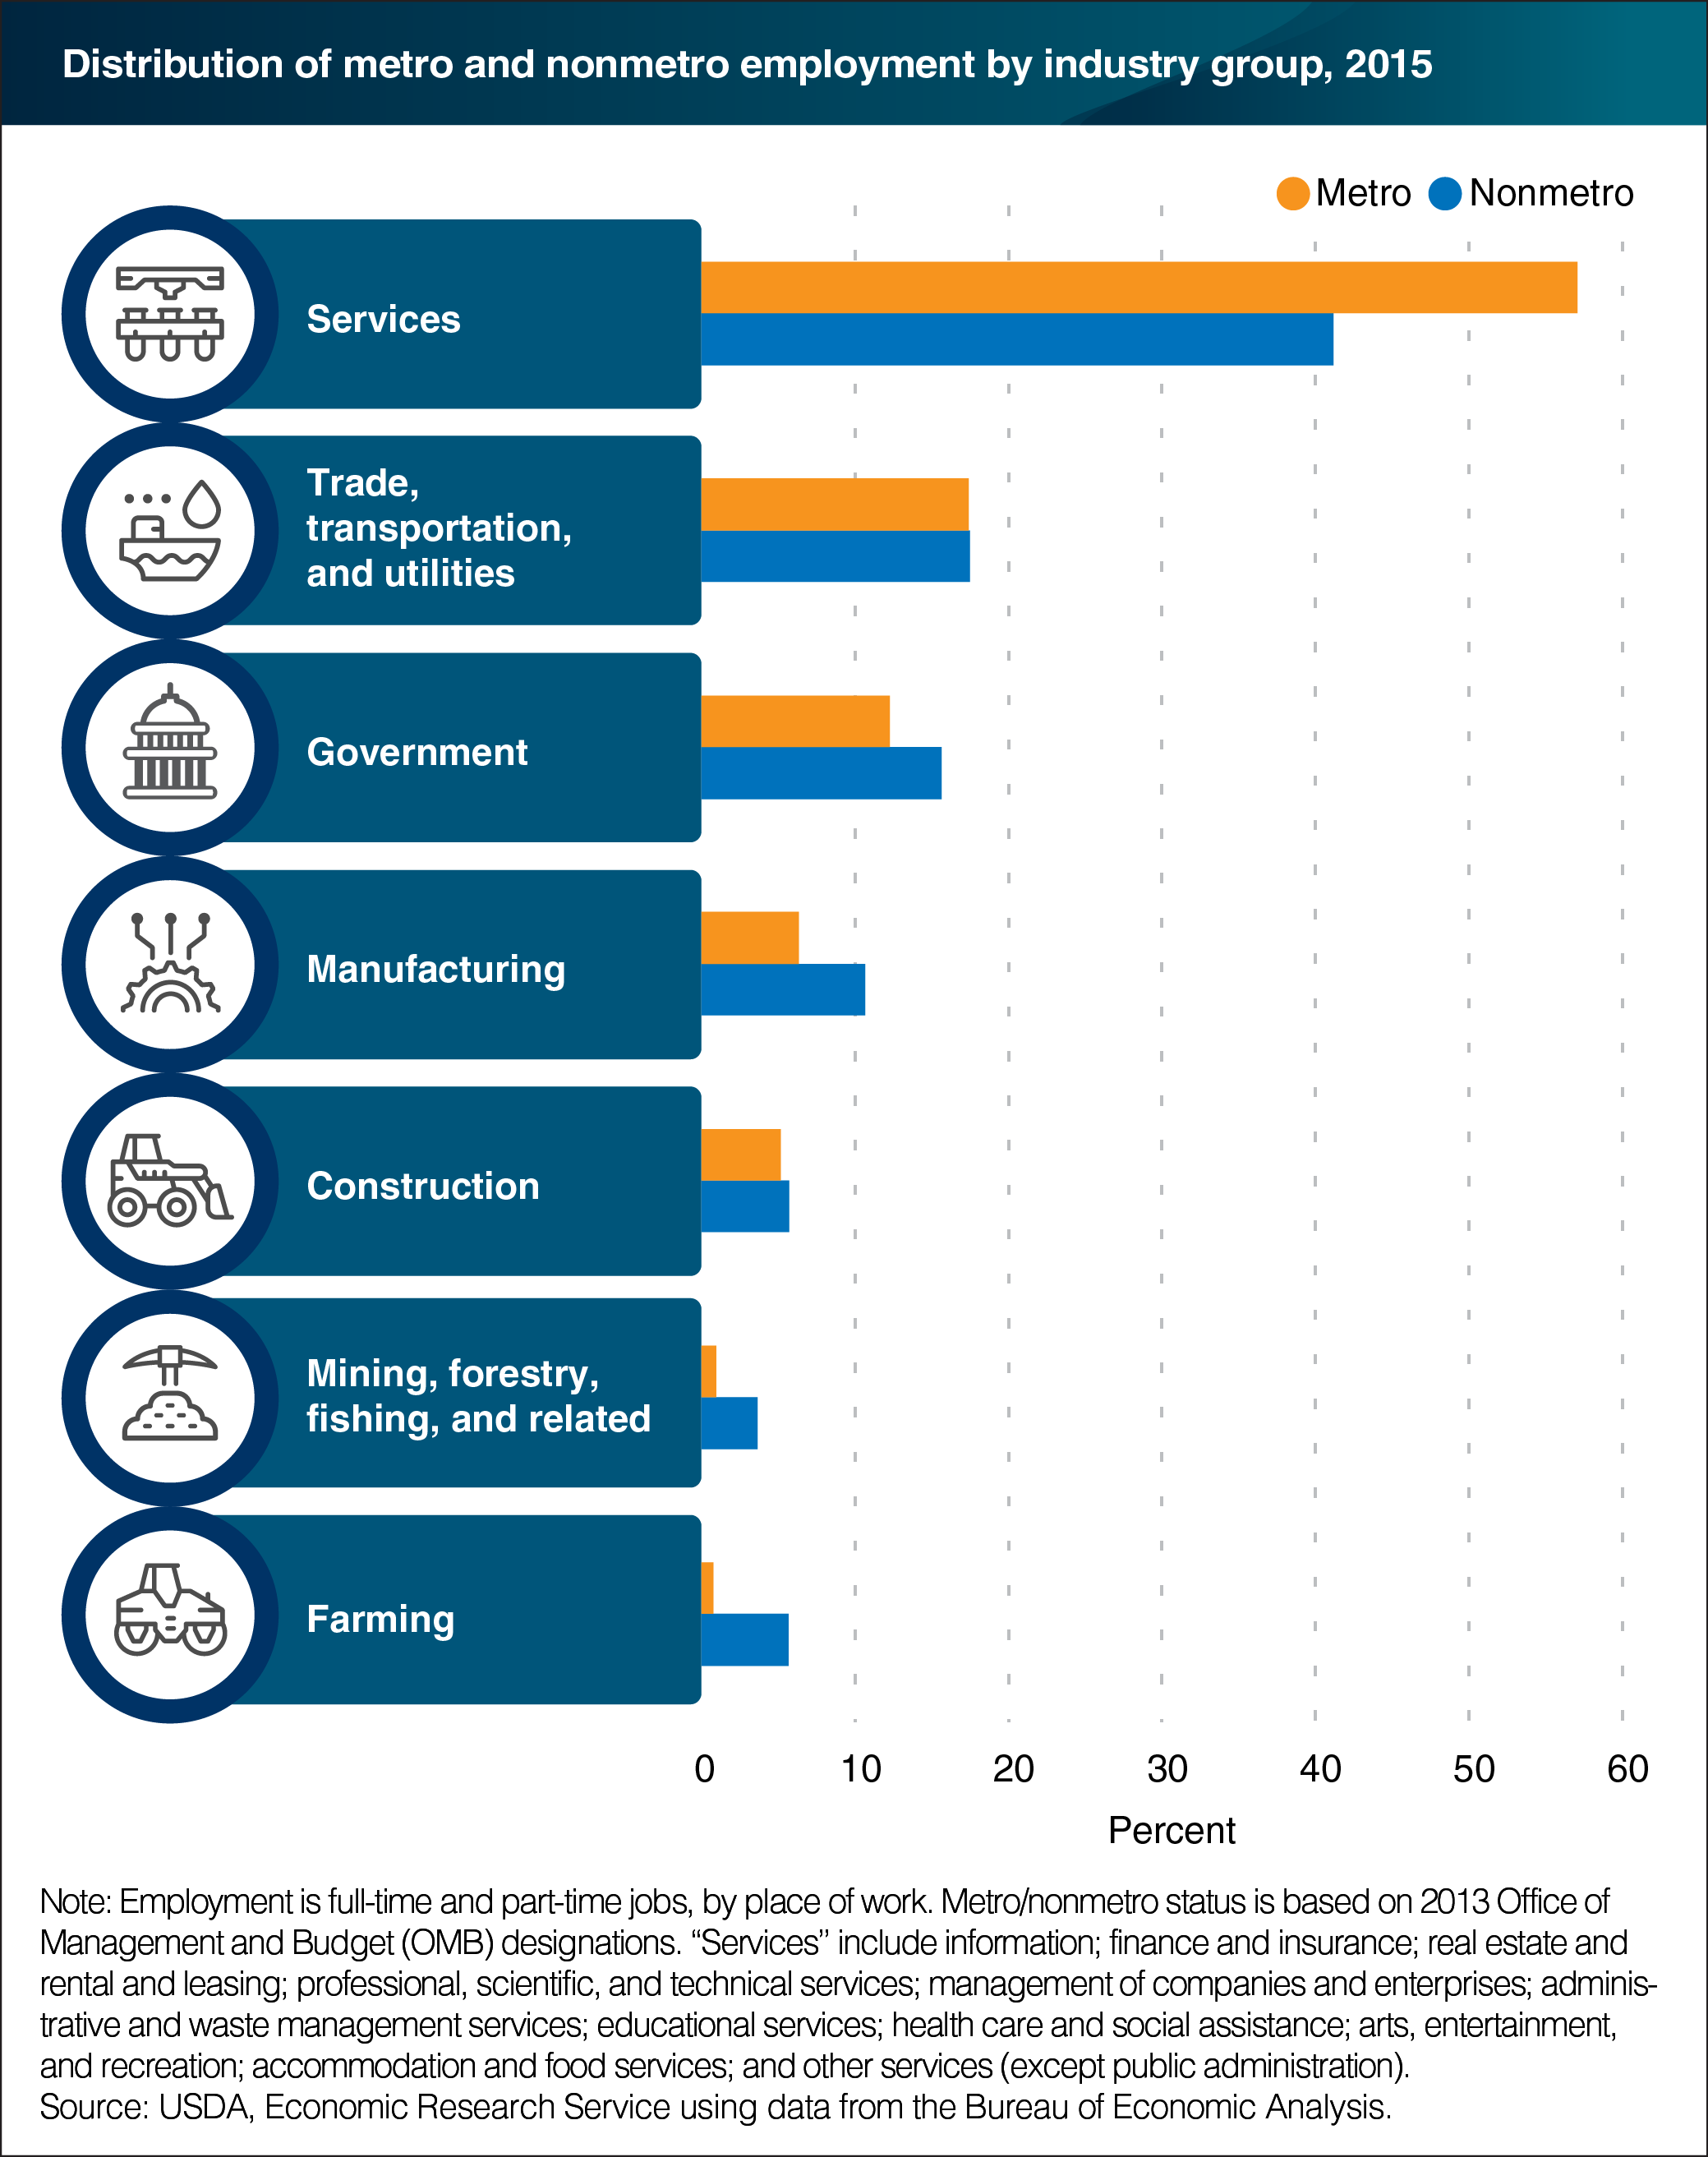
In 2015, every industry group, except for farming, employed more workers in urban (metro) areas than in rural (nonmetro) areas. However, the share of employment in each industry varied in each area. For example, farming—counting both self-employed operators and their hired workers—accounted for about 6 percent of all rural employment, compared to 1 percent in urban areas. Manufacturing also employed a larger share of the rural (11 percent) than the urban (6 percent) workforce. Services—such as finance, real estate, and administration—had the highest share of employment for both rural and urban areas. But urban areas had a higher share of employment in services: 57 percent compared to 41 percent in rural areas. Trade, transportation, and utilities had the second highest share of employment, about 17 percent for both rural and urban areas. This chart appears in the ERS topic page for Rural Employment and Unemployment, updated June 2017.